Law School Service Use: LSSSE 2017
Law schools offer services to support student success both during law school and after graduation. For seven core law school services, LSSSE asks students to either rate their satisfaction or to indicate that they did not use a particular service during the current school year. Student satisfaction levels can help guide efficient resource allocation, and non-use rates can highlight services that are overlooked or underused.
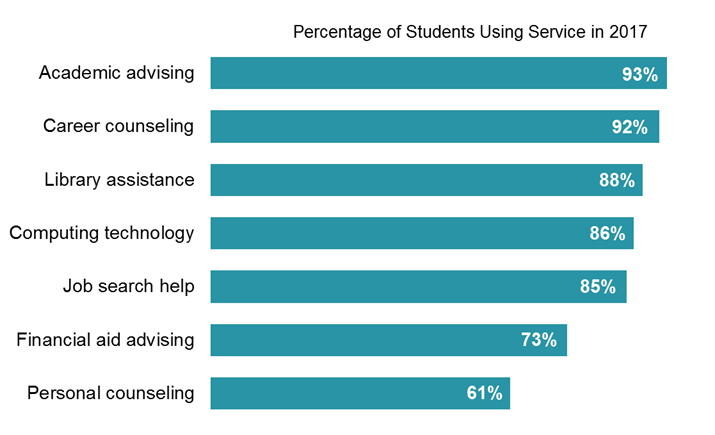
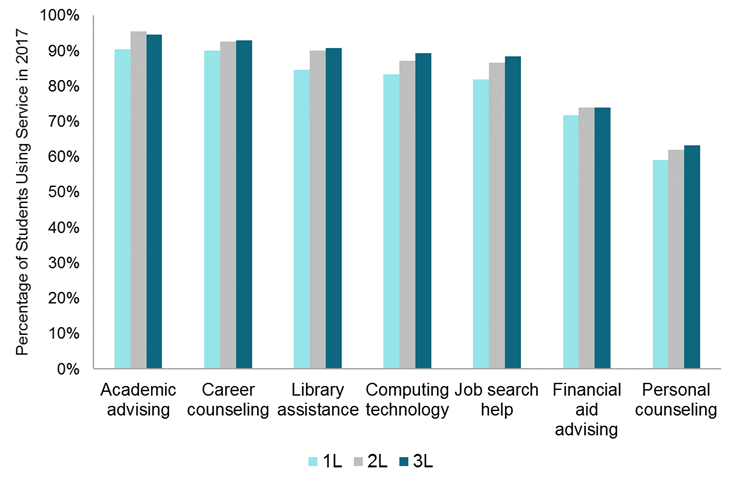
Service use was quite high among U.S. law students in general. The greatest demand was for academic advising services, which were used by 93% of students. Nearly as many students (92%) sought career counseling. Personal counseling was the least used resource, with only 61% of students giving a satisfaction rating for this service.
Among law students who answered all seven service-use questions, the average number of services used was 5.8. Part-time students used an average of 5.1 services, which was less than full-time students, who used 5.9 services on average.
Each service showed slightly higher usage among 2L and 3L students than among 1L students. This makes intuitive sense for certain services (such as job search help) that may be more relevant during later stages of the law school experience. However, this finding is somewhat surprising for more general student services such as library assistance and computing technology.
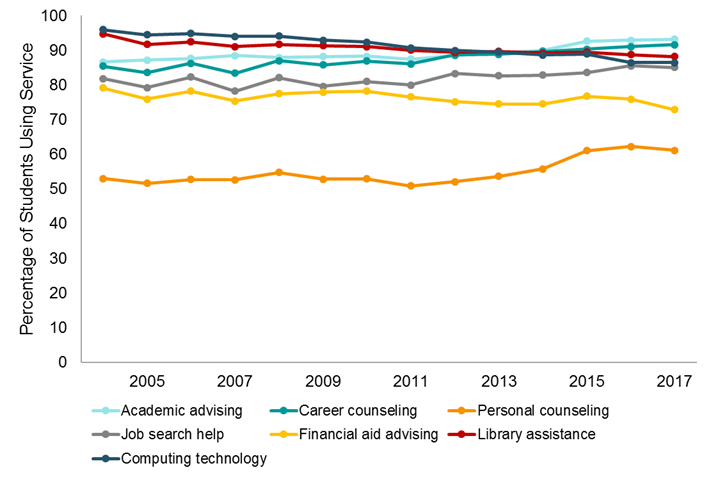
Finally, service usage has fluctuated somewhat since LSSSE started measuring student satisfaction in 2004. Use of personal counseling is trending upward, with 53% of students using this service in 2004 and 61% of students using it in 2017. Conversely, use of computing technology has decreased markedly, with 96% of respondents reporting using law school technology in 2004, compared to 86% in 2017.

LSSSE Annual Results 2006-2016: What Has Remained the Same?
In the our last post, we re-visited the LSSSE 2006 Annual Results (pdf) to look at how the trends identified as “Disappointing Findings” in 2006 compare to the results from the LSSSE 2016 survey. Today we will look at what patterns in law student engagement have remained the same.
What has not changed in the last decade?
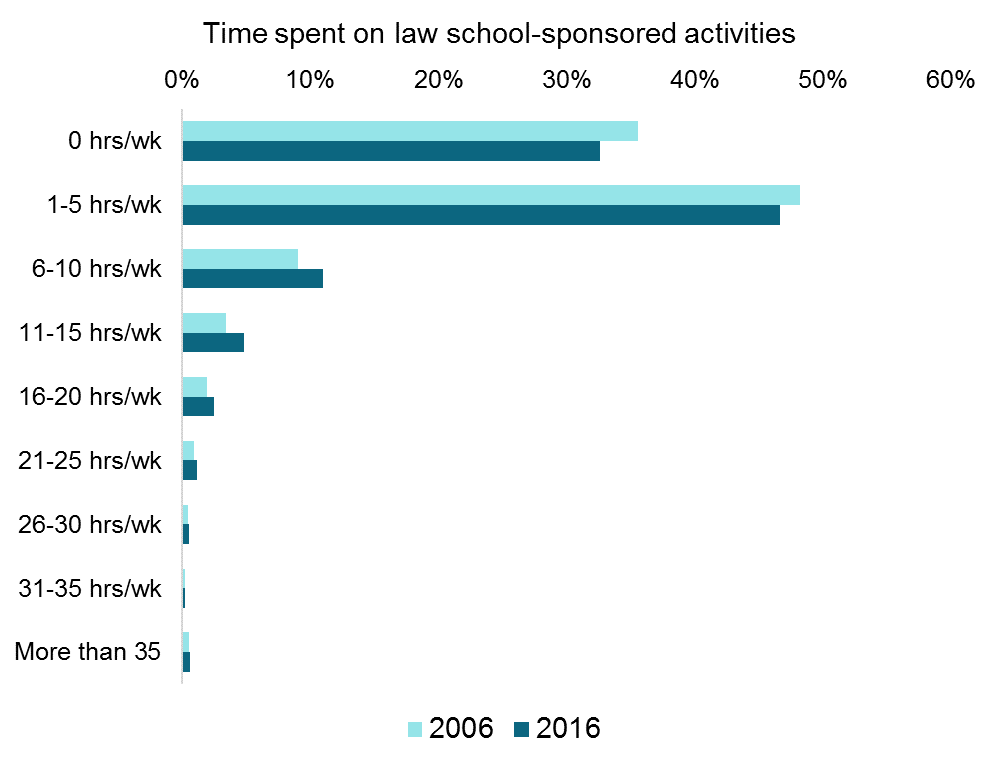
Although participation in public service has increased among law students, participation in law school-sponsored organizations (clubs, journal, committees, moot court, etc.) among all law students has stayed relatively stable. More than a third of law students (36%) spent no time during the week participating in these organizations in 2006; in 2016 the non-participation rate dipped only slightly to 33%.
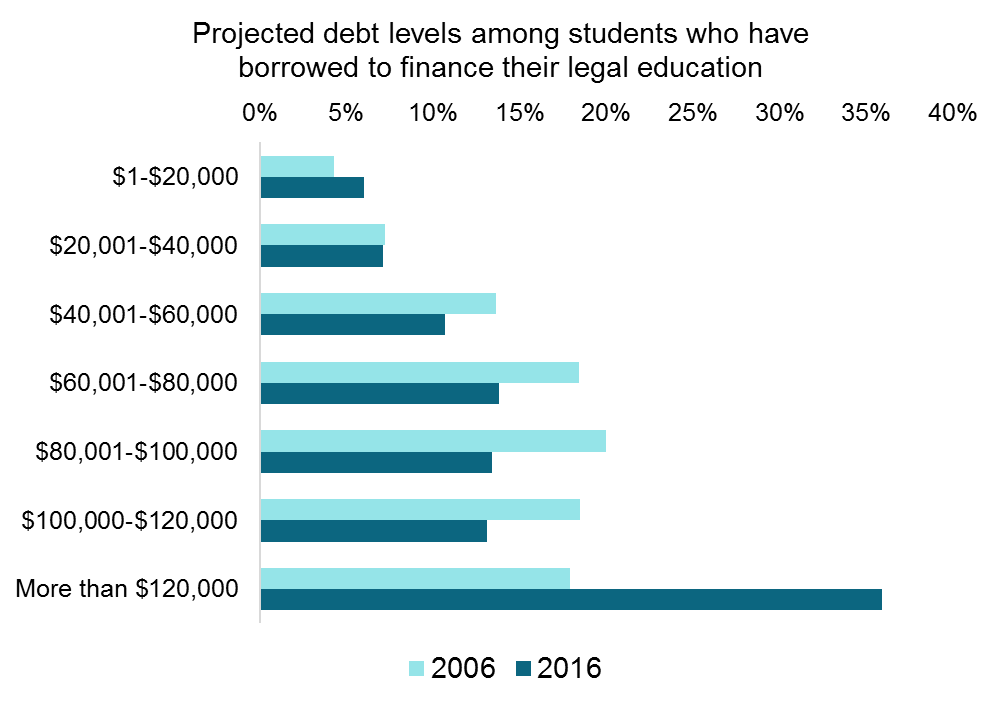
Surprisingly, at first glance the student debt load appears unchanged from 2006 to 2016. In 2006, the LSSSE Annual Results noted that of those students at U.S. law schools who incurred debt related to their legal education, 75% will owe more than $60,000 by graduation. In 2016, that number was 76%. However, if we look at the distribution of debt by category, we see a remarkably different picture. In 2006, survey respondents selected their projected debt law school debt using the following categories:
- $0
- $1-$20,000
- $20,001-$40,000
- $40,001-$60,000
- $60,001-$80,000
- $80,001-$100,000
- $100,000-$120,000
- More than $120,000
In 2016, those categories were expanded to more accurately capture higher debt levels among law students:
- $0
- $1-$20,000
- $20,001-$40,000
- $40,001-$60,000
- $60,001-$80,000
- $80,001-$100,000
- $100,000-$120,000
- $120,001-$140,000
- $140,001-$160,000
- $160,001-$180,000
- $180,001-$200,000
- More than $200,000
If we collapse the higher categories from the 2016 data into a single “More than $120,000” category to compare with the 2006 data, it becomes clear that student loan debt has become much more onerous for law students in 2016 compared to 2006, despite the fact that the overall percentage of students who owe more than $60,000 has remained unchanged.
The pattern is similar among students who wish to work for public interest organizations, which generally pay less than other law careers. In 2006, the LSSSE Annual Results warned that 67% of aspiring public interest lawyers expected to owe more than $60,000 upon graduation. In 2016, the exact same percentage (67%) of students hoping to work for public interest organizations reported expecting to owe more than $60,000, but the percentage of students who wish to work for public interest organizations and who will owe more than $120,000 has approximately doubled.
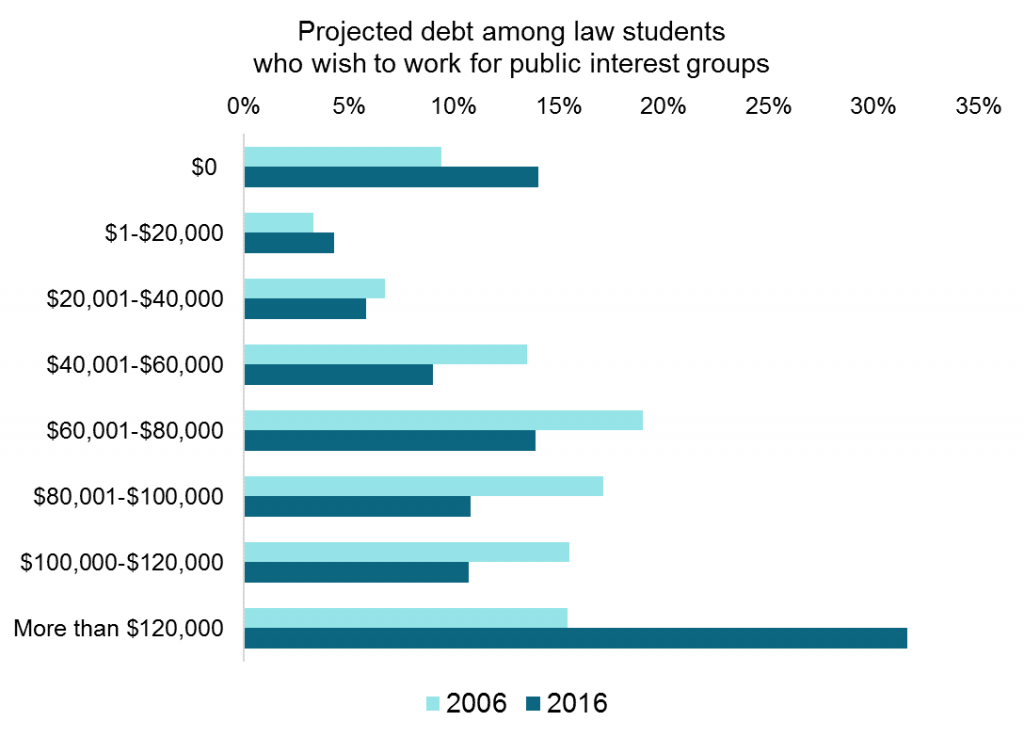
The LSSSE 2016 results show that while the percentage of students who will owe more than $60,000 has not changed between 2006 and 2016, students in the highest borrowing categories are taking on significantly heavier financial burdens than students in 2006.


LSSSE Annual Results 2006-2016: What Has Changed?
The 2006 LSSSE Annual Results (pdf) targeted several potential areas of improvement for law student engagement. In particular, the report highlighted somewhat low participation in pro bono and volunteer work and a relative lack of time spent on law school-sponsored activities. The report also noted a high student debt load, particularly among students who planned to work for public interest organizations. We used the 2016 LSSSE data to see what has changed and what has stayed the same over the last ten years. In this first of two posts, we will describe what has changed in the last decade.
What has changed in the last decade?
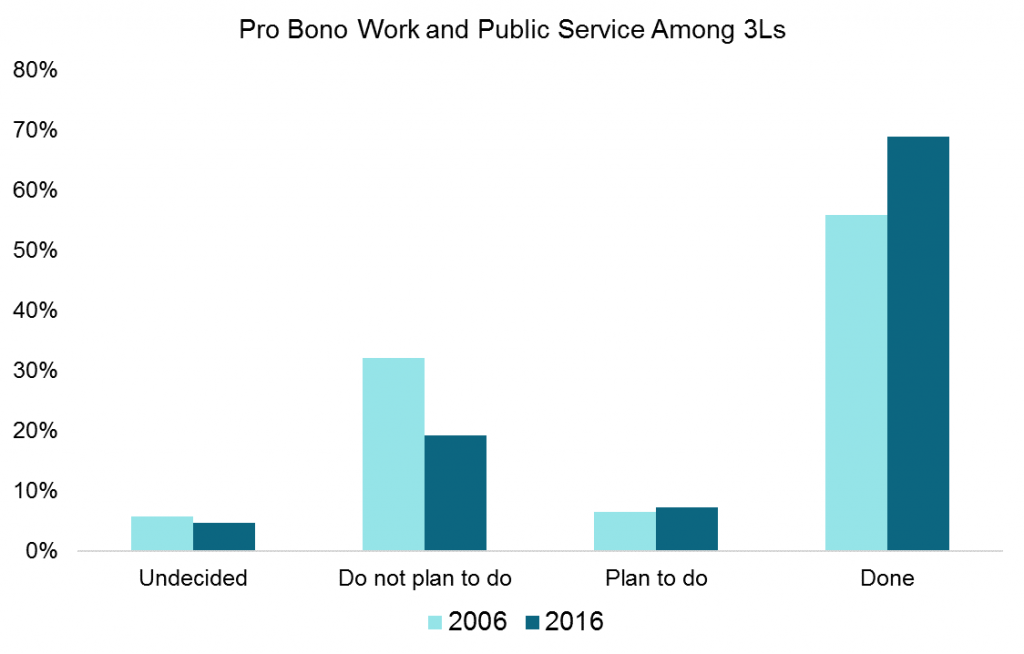
Participation in public service among law students has increased substantially. In 2006, nearly a third of 3L respondents (32%) reported that they had not done any pro bono or volunteer work during law school and had no plans to do so. In 2016, only 19% of 3L respondents reported having not done any pro bono work or public service and having no plans to do so. In terms of weekly time usage, three-quarters (77%) of 3L respondents in 2006 spent no time during the week on legal pro bono work not required for class. By 2016, that number had declined to 66% of 3Ls.
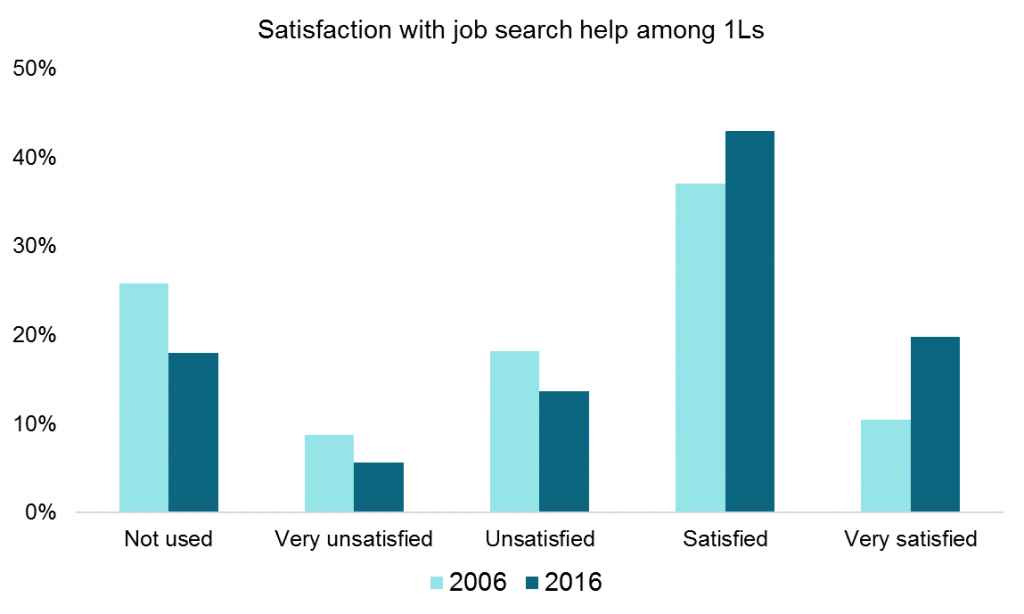
More law students are using job search assistance earlier in their legal educations, perhaps due to increased awareness of changes in the legal employment landscape. One in four 1Ls (26%) reported never using job search assistance at their law school in 2006. In 2016, that number was less than one in five (18%).
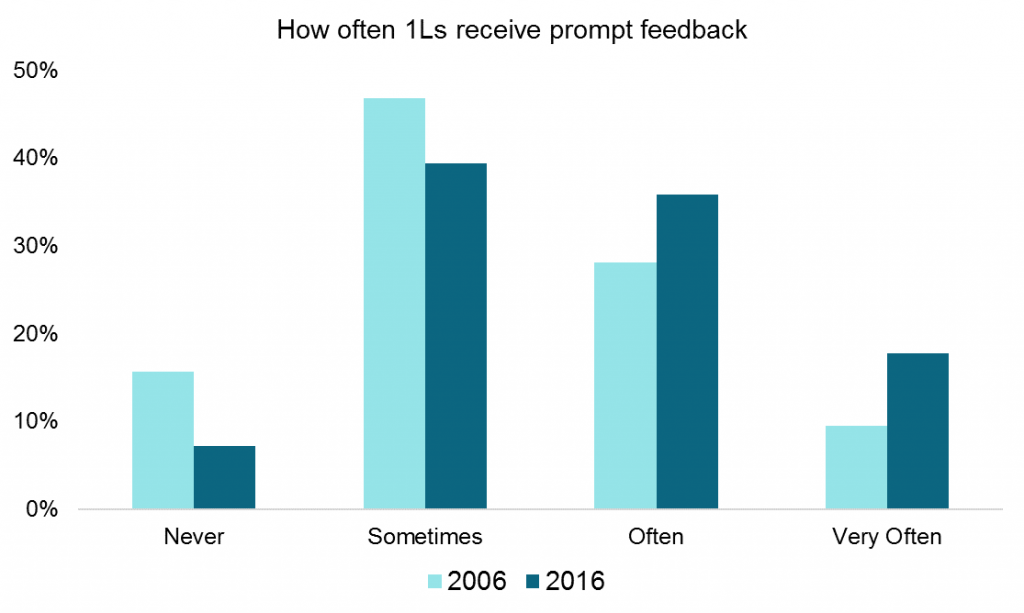
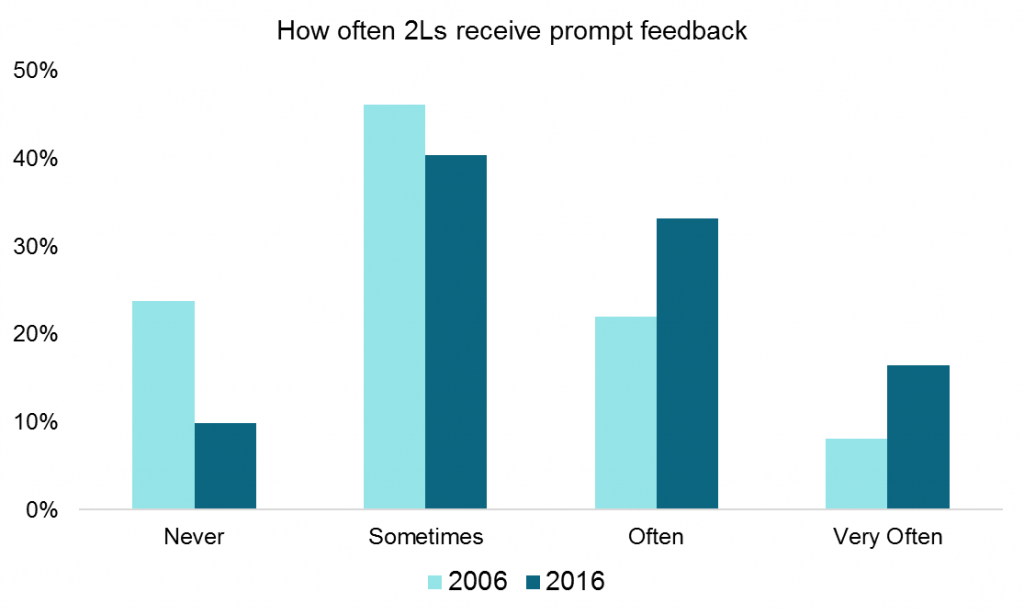
Law school faculty also appear to be more diligent about giving timely feedback to students. In 2006, about 15% of 1Ls and 24% of 2Ls reported never receiving prompt feedback from faculty members. In 2016, only 7% of 1Ls and 10% of 2Ls said they never received timely feedback from faculty.
Overall, law school students in 2016 showed more participation in public service and greater satisfaction with faculty feedback. This suggests progress in ameliorating some of the concerns identified by the 2006 LSSSE Annual Report. In our next post, we will look at which of the findings from 2006 are still areas ripe for improvement today.
Tuition Discounting: The Problem, not the Remedy (Inside Higher Ed - 10/3/2017)
It’s an addiction, argues Frank H. Wu, and presidents, backed by boards, have to wean themselves off this drug.

LSSSE Annual Results 2016: Scholarships and the Law School Experience (Part 5)
This is the fifth installment in a series of five posts based on data from the 2016 LSSSE survey administration and the 2016 Annual Report. The LSSSE 2016 Annual Report highlights inequities in scholarship policies and the consequences for student loan debt. In this post, we examine how scholarship recipients and non-recipients rate their stress levels and overall satisfaction with law school.
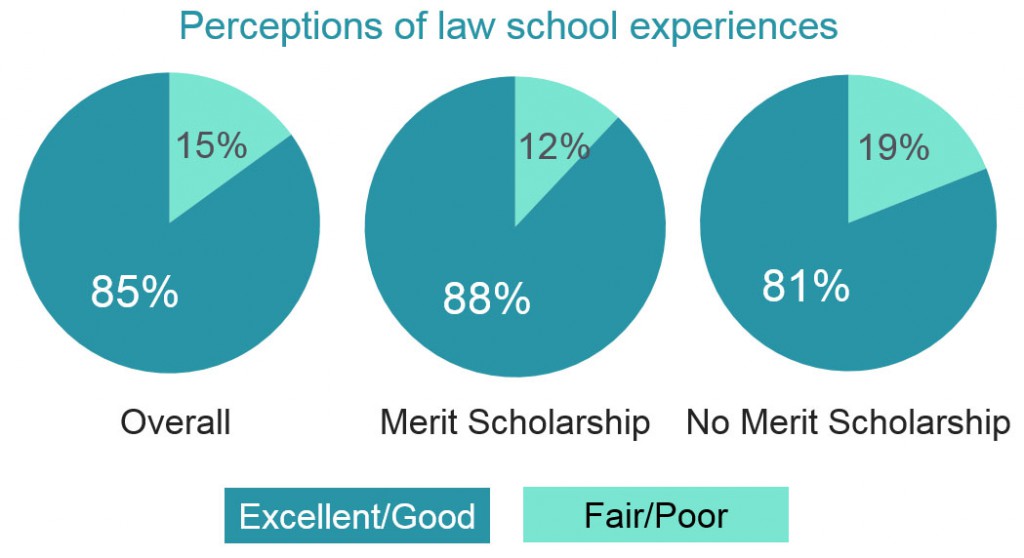
Law students tend to have favorable perceptions of their law school experiences. Eighty-five percent of LSSSE respondents rated their law school experiences “good” or “excellent.” Receipt of a scholarship was associated with even higher satisfaction. Eighty-eight percent of respondents who received merit scholarships rated their experiences favorably, compared to 81% of respondents who did not receive merit scholarships. Similar trends persisted across racial and socioeconomic classifications, with the most intense effects being among black and Latino respondents.
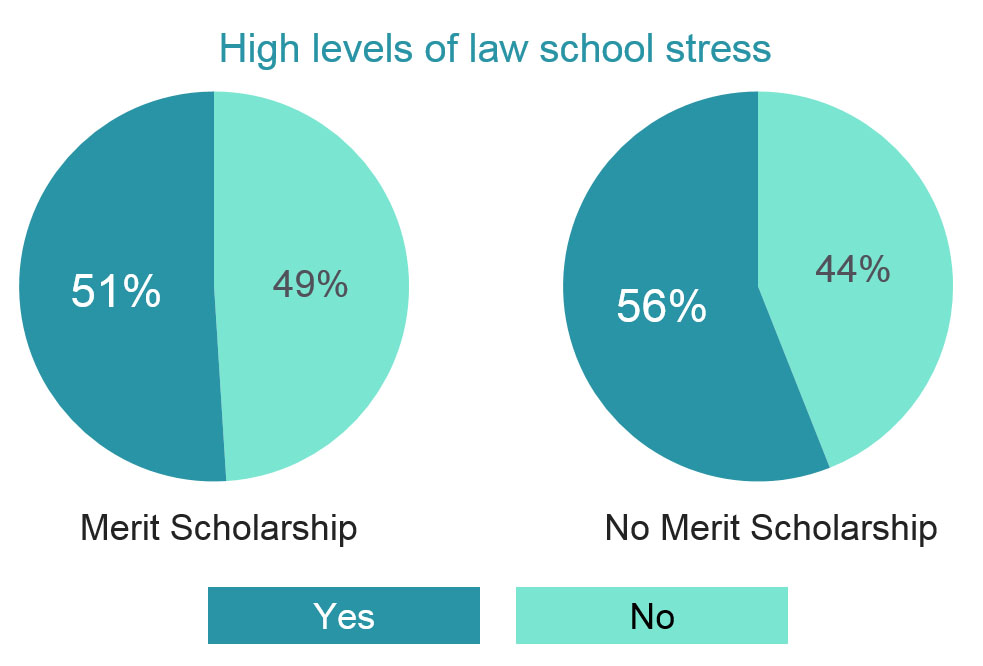
A subset of 2,256 respondents were surveyed about the extent and nature of law school-related stress they experienced. Among this group, the receipt of a merit scholarship was associated with stress levels. Fifty-one percent of respondents who received merit scholarships reported high levels of law school stress, compared to 56% of respondents with no merit scholarships.

LSSSE Annual Results 2016: Scholarships and Debt (Part 4)
This is the fourth installment in a series of five posts based on data from the 2016 LSSSE survey administration and the 2016 Annual Report. The LSSSE 2016 Annual Report highlights inequities in scholarship policies and the associated consequences for student loan debt. In this post, we look at the expected student loan debts among merit- and need-based scholarship recipients.
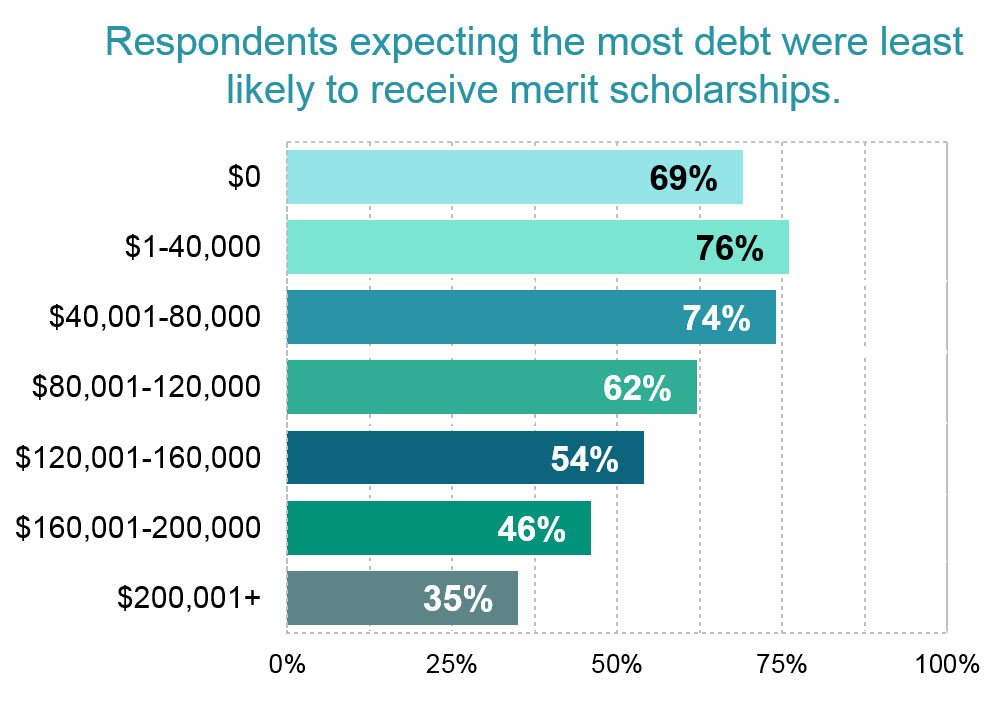
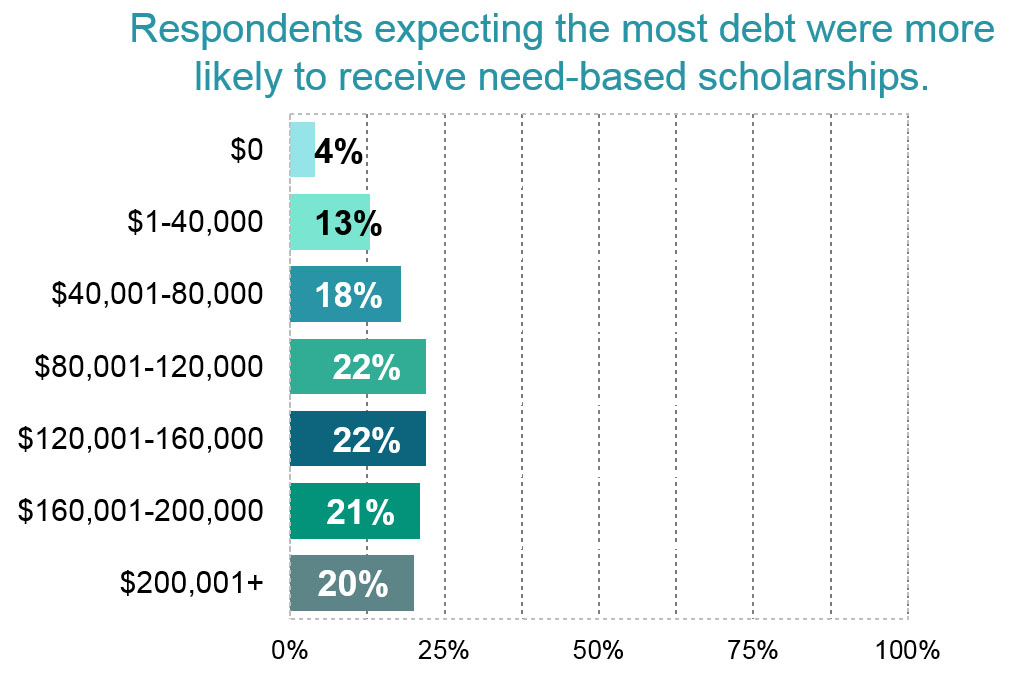
The distribution of law school scholarships has vast implications for student debt trends. The more a student receives in scholarship aid, the less likely it is that they will have to rely on loans to fund their studies. Among 2016 LSSSE respondents, students expecting higher law school debts were less likely to have received merit scholarships. Respondents expecting more than $200,000 in debt were only about half as likely to have received a merit scholarship as those expecting $80,000 or less. At each interval above $40,000 in expected debt, chances of having received a merit scholarship declined.
Conversely, respondents expecting higher law school debts were more likely to have received need-based scholarships. However, the relative rarity of those awards limits their impact.
In our next and final post in this series, we will show how receipt of a scholarship relates to self-reported stress levels and overall satisfaction with law school.
Мега даркнет площадка, Mega даркнет ссылка, Mega даркнет сайт, Mega площадка Mega даркнет площадка!
Diversity Within Diversity: The Student Experience (Part 3)
This final installment based on the Report, Diversity Within Diversity: The Varied Experiences Of Asian And Asian American Law Students, highlights findings related to the law student experience.
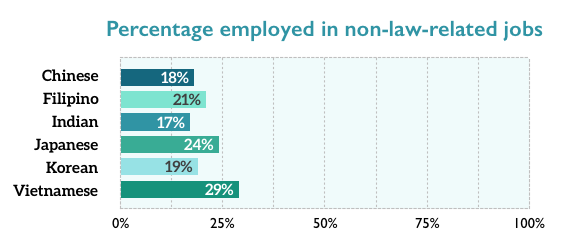
LSSSE asks respondents about how they spend their time, in the context of their studies and beyond. Employment can be a very useful part of the law school experience if it has relevance to the practice or study of law. Some employment, however, is motivated by necessity, and not necessarily a desire to foster one’s professional development. LSSSE respondents are asked to stipulate whether employment is law related or non-law-related.
Among the six subgroups, Vietnamese respondents were most likely to report being employed, with the disproportions being particularly apparent in non-law-related jobs. They were also most likely to report working eight or more hours per week in either setting. The relatively high proportions of employment, particularly in non-law-related jobs, raises questions about the role of financial pressures among Vietnamese law students.
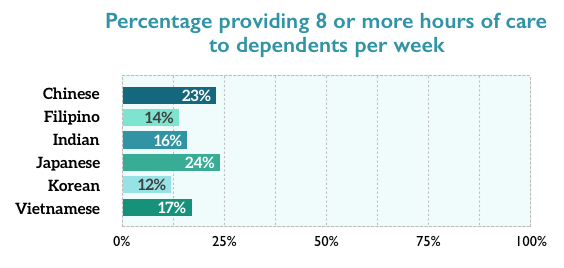
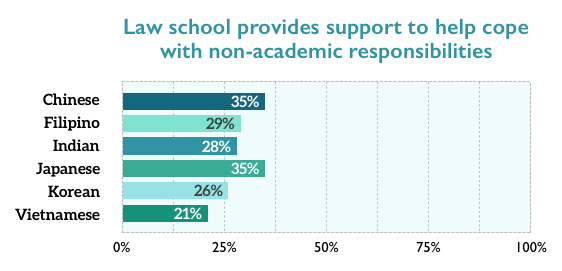
Vietnamese respondents were also most likely to report spending time providing care to dependents residing in the same household, with Vietnamese and Japanese respondents reporting the largest time commitment. Vietnamese respondents were least likely to report feeling as if their law school helped them cope with their nonacademic responsibilities.
Asian respondents overwhelmingly reported favorable relationships within their law school, but Vietnamese respondents were noticeably more likely to state that other students were “unfriendly and unsupportive.” Korean respondents had the least favorable perceptions of their professors, with less than half harboring the most intensely positive feelings.
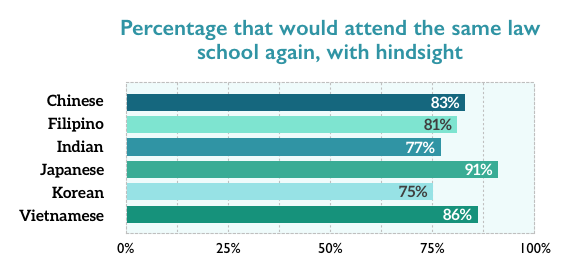
Vietnamese respondents were least likely to report feeling as if they were acquiring a broad legal education, with one-in-5 expressing an unfavorable perception. In that vein, almost one-quarter rated their law school experiences fair or poor, again the highest proportion. Interestingly, given these perceptions, 86% of Vietnamese respondents stated that they would probably or definitely attend the same law school again, if given the benefit of hindsight. Only Japanese respondents had a higher proportion expressing this ostensibly favorable assessment. On the other hand, Korean respondents were least likely to state that they would attend the same law school again, with 1-in-4 stating expressing regret.
Conclusion
The experiences of Asian subgroups within the LSSSE pool varied, belying the prevailing assumptions about the Asian monolith. Their backgrounds, informed in large part by immigration patterns, differed markedly. There were vast disparities in expected law school debt. There were differences in how they spent their time, and how they perceived the law school experience. In the end, the distinctive aspects of each group manifested. As law schools work to ensure that their programs benefit all students, the experiences of subgroups within our broad classifications (racial/ethnic and others) should also be considered.
(Photo courtesy of Southwestern Law School)

Diversity Within Diversity: Scholarships and Student Loan Debt (Part 2)
This second installment based on the Report, Diversity Within Diversity: The Varied Experiences Of Asian And Asian American Law Students, highlights findings related to scholarships and student loan debt.
Scholarships
Given the outsized role that the LSAT plays in determining who goes to law school, where they go, and how much they pay, the trends suggest that Filipino and Vietnamese applicants are much less likely to gain admission and less likely to receive lucrative scholarships, even if they receive an admission offer. As explained in the LSSSE report, Law School Scholarship Policies: Engines of Inequity, the overall trends routinely highlight a strong link between LSAT score and receipt of so-called merit scholarships.
But those linkages were not observed as strongly among the Asian subgroups. Sixty-five percent (65%) of Vietnamese respondents reported receiving merit scholarships, the highest proportion, along with Japanese respondents. LSAT score differences suggest that Chinese respondents would have received these scholarships in the highest proportions; but their rate of 57% was tied with Filipino respondents.
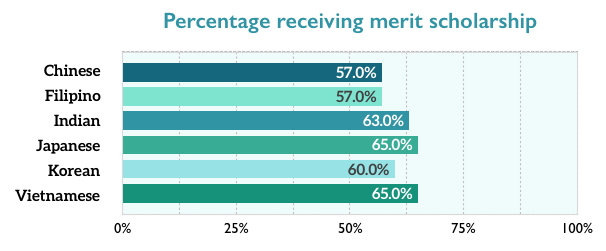
International students are sometimes ineligible to receive merit scholarships awarded by law schools. But immigrant status does not explain why receipt of merit scholarships (from all sources) among Chinese respondents seemed depressed. Chinese immigrants were only slightly less likely to report having received a merit scholarship of some type than Chinese Americans – 55% vs. 56%. For many reasons, the LSAT score should not be the primary determinant of who gets a merit scholarship; but it commonly is. Therefore, the trends among Asian respondents are somewhat of a riddle.
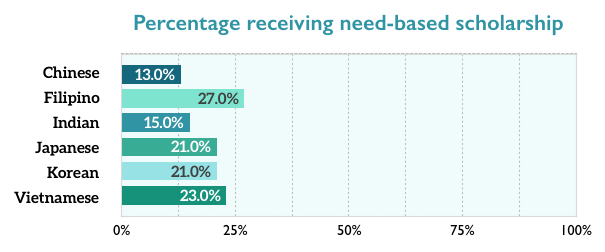
The need-based scholarship awarding trends took a more predictable track, with Filipino respondents (27%) mostly likely to have received this aid, followed by Vietnamese respondents (23%). Chinese respondents (13%) were least likely to report receiving this aid, a possible artifact of the high proportion of international students.
Student Loan Debt
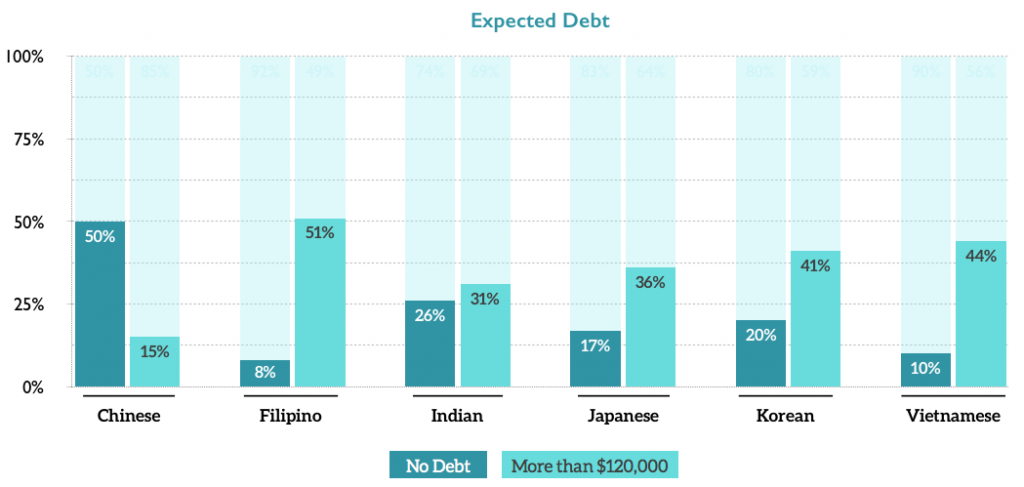
The LSSSE Survey asks respondents to estimate the amount of debt they expect to incur from law school. Half of Chinese respondents expected no law school debt – the highest proportion. Once again, this trend can be explained by the high proportion of international students among the Chinese subgroup. International students do not qualify for U.S. government student loans and, therefore, are much less likely to report expecting student loan debt.
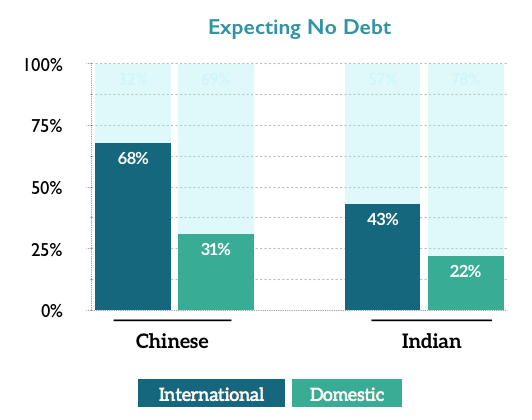
Among Chinese and Indian respondents, international students were more than twice as likely to expect no student loan debt than domestic students. Less than 10% of Filipino and Vietnamese respondents expected to leave law school debt-free. Half of Filipinos expected to owe more than $120,000, compared to 15% of Chinese respondents.
And at the highest end of the spectrum, Filipinos were about seven times as likely to expect more than $200,000 in law school debt than Chinese respondents, 14% to 2%.