
Diversity Within Diversity: Scholarships and Student Loan Debt (Part 2)
This second installment based on the Report, Diversity Within Diversity: The Varied Experiences Of Asian And Asian American Law Students, highlights findings related to scholarships and student loan debt.
Scholarships
Given the outsized role that the LSAT plays in determining who goes to law school, where they go, and how much they pay, the trends suggest that Filipino and Vietnamese applicants are much less likely to gain admission and less likely to receive lucrative scholarships, even if they receive an admission offer. As explained in the LSSSE report, Law School Scholarship Policies: Engines of Inequity, the overall trends routinely highlight a strong link between LSAT score and receipt of so-called merit scholarships.
But those linkages were not observed as strongly among the Asian subgroups. Sixty-five percent (65%) of Vietnamese respondents reported receiving merit scholarships, the highest proportion, along with Japanese respondents. LSAT score differences suggest that Chinese respondents would have received these scholarships in the highest proportions; but their rate of 57% was tied with Filipino respondents.
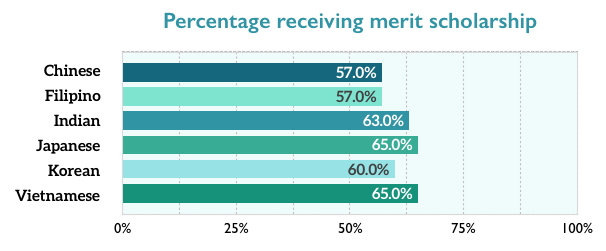
International students are sometimes ineligible to receive merit scholarships awarded by law schools. But immigrant status does not explain why receipt of merit scholarships (from all sources) among Chinese respondents seemed depressed. Chinese immigrants were only slightly less likely to report having received a merit scholarship of some type than Chinese Americans – 55% vs. 56%. For many reasons, the LSAT score should not be the primary determinant of who gets a merit scholarship; but it commonly is. Therefore, the trends among Asian respondents are somewhat of a riddle.
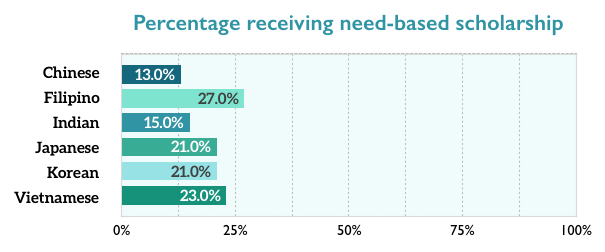
The need-based scholarship awarding trends took a more predictable track, with Filipino respondents (27%) mostly likely to have received this aid, followed by Vietnamese respondents (23%). Chinese respondents (13%) were least likely to report receiving this aid, a possible artifact of the high proportion of international students.
Student Loan Debt
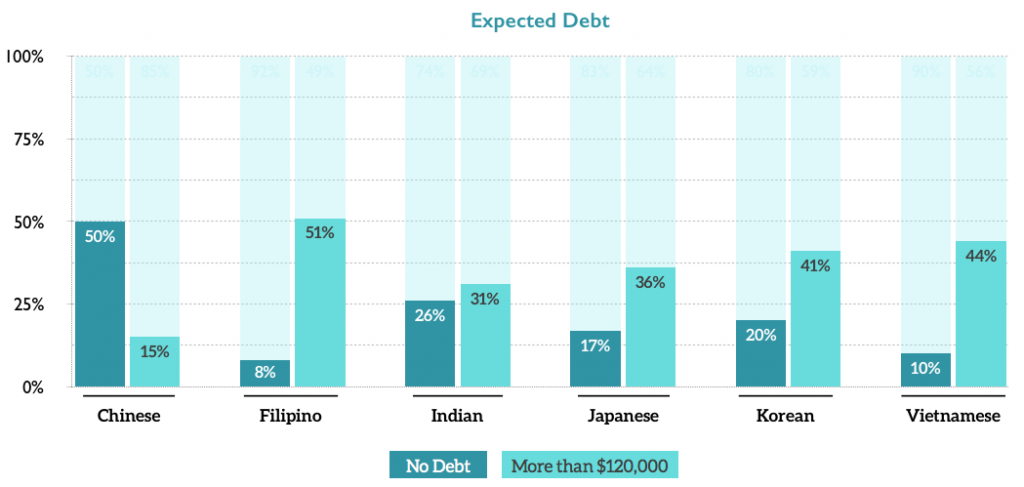
The LSSSE Survey asks respondents to estimate the amount of debt they expect to incur from law school. Half of Chinese respondents expected no law school debt – the highest proportion. Once again, this trend can be explained by the high proportion of international students among the Chinese subgroup. International students do not qualify for U.S. government student loans and, therefore, are much less likely to report expecting student loan debt.
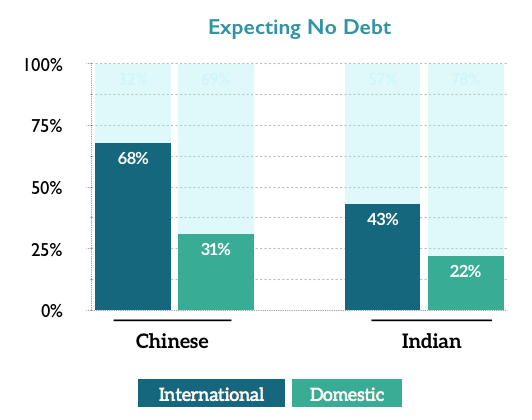
Among Chinese and Indian respondents, international students were more than twice as likely to expect no student loan debt than domestic students. Less than 10% of Filipino and Vietnamese respondents expected to leave law school debt-free. Half of Filipinos expected to owe more than $120,000, compared to 15% of Chinese respondents.
And at the highest end of the spectrum, Filipinos were about seven times as likely to expect more than $200,000 in law school debt than Chinese respondents, 14% to 2%.

Diversity Within Diversity: The Varied Experiences Of Asian And Asian American Law Students (Part 1)
This is the first installment in a series based on data from the 2016 LSSSE survey administration and the LSSSE Report, Diversity Within Diversity: The Varied Experiences Of Asian And Asian American Law Students.
In 2016, LSSSE, for the first time, asked respondents identifying as Asian or Hispanic/Latino to also identify an ethnic subgroup. This report presents various disaggregated data for the Asian subgroups.
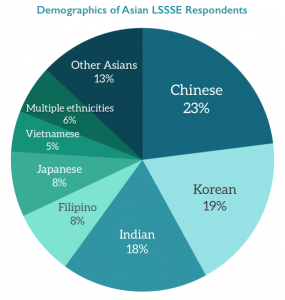
The data presented in this Report comes from the LSSSE Survey responses of more than 16,000 students at 67 U.S. law schools. A total of 1,147 LSSSE respondents identified as Asian, comprising 7% of the LSSSE pool – and about 1-in-7 of all Asian law students in the United States.
Chinese respondents were the largest Asian subgroup (23%), followed by Koreans (19%) and Indians (18%). There were six subgroups that comprised at least 5% of the pool of Asian respondents.
Comprising 81% of all Asian respondents, this report will center on these six groups. About 6% of respondents identified with multiple Asian subgroups or with an Asian subgroup and another race; their data is excluded from the subgroup analyses, as are data for respondents who identified with groups comprising less than 5% of the pool. The data presented in this report provide a glimpse into the experiences of these law students over the course of one school year.
Socioeconomic background
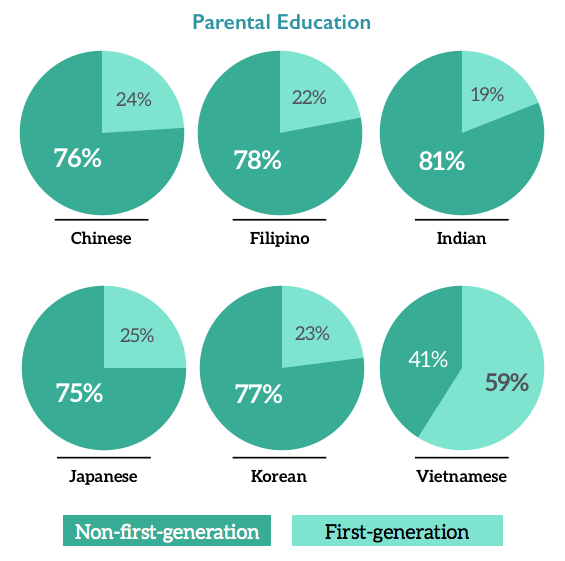
Socioeconomics loom large in the ascent to law school, and law students tend to be a relatively affluent group. The LSSSE Survey attempts to get a sense of the socioeconomic backgrounds of respondents by asking about the education levels of their parents. Researchers often use parental education as a proxy for socioeconomic status. The linkages between higher education and income dictate that students with college-educated parents tend to come from more affluent backgrounds. Respondents with at least one parent possessing a BA/BS or higher comprised more than 75% of each subgroup, with one glaring exception: Vietnamese respondents.
Only 41% of Vietnamese respondents had at least one parent with a BA/BS or higher. Put the other way, about 6-in-10 Vietnamese respondents were among the first-generation in their family to graduate from college. These trends align with the overall educational attainment figures cited earlier, and can be explained in large part by different immigration histories and patterns among groups.
Immigrant Status
Half of Chinese respondents reported being international students. This was the highest proportion by far; the second-highest being among Indian respondents (24%). The lowest proportion (1%) was among Filipino respondents.

LSSSE Annual Results 2016: Socioeconomic Background and Economic Inequity (Part 3)
This is the third installment in a series of five posts based on data from the 2016 LSSSE survey administration and the 2016 Annual Report. The LSSSE 2016 Annual Report highlights inequities in scholarship policies and the associated consequences for student loan debt.
Equity is often assumed to be the same as equality, but they are different. Equity accounts for differences in ways that equality does not. In fact, the insensitivity of equality-based frameworks can exacerbate inequity through a dichotomous compounding of privilege and disadvantage. Merit scholarship programs provide a classic example of this phenomenon. Merit scholarships tend to be awarded through equality frameworks, in which similar criteria are applied to all applicants. These criteria most often revolve around standardized test scores and other factors that track closely to non-merit indicators, such as socioeconomic status. In the end, wealth and privilege become proxies for merit, a conflation that results in financial windfalls and further advantages for applicants least in need of such assistance.
We used parental education as a proxy for a respondent’s socioeconomic background in order to compare debt and scholarship trends. Framing socioeconomic background based on parental education is common in the research literature and is rooted in the fact that children of college-educated parents are more likely than other children to come from relatively affluent backgrounds. We classified our respondents into three parental education groupings:
FG-HS: “first-generation” respondents for whom neither parent has more than a high school diploma
FG-SC: “first-generation” respondents for whom at least one parent has some college experience, but no bachelor’s degree
N-FG: “non-first-generation” respondents for whom at least one parent has a bachelor’s degree or higher
The debt burden is highest among respondents for whom neither parent has more than a high school diploma. Almost half of these “first-generation” respondents (FG-HS) expected to owe more than $100,000, compared to 34% to non-first-generation (N-FG) respondents.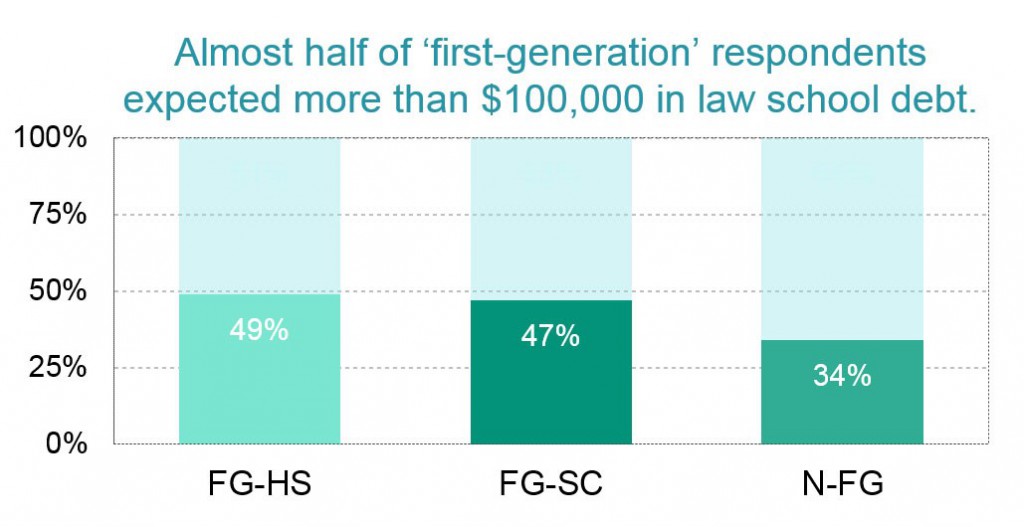
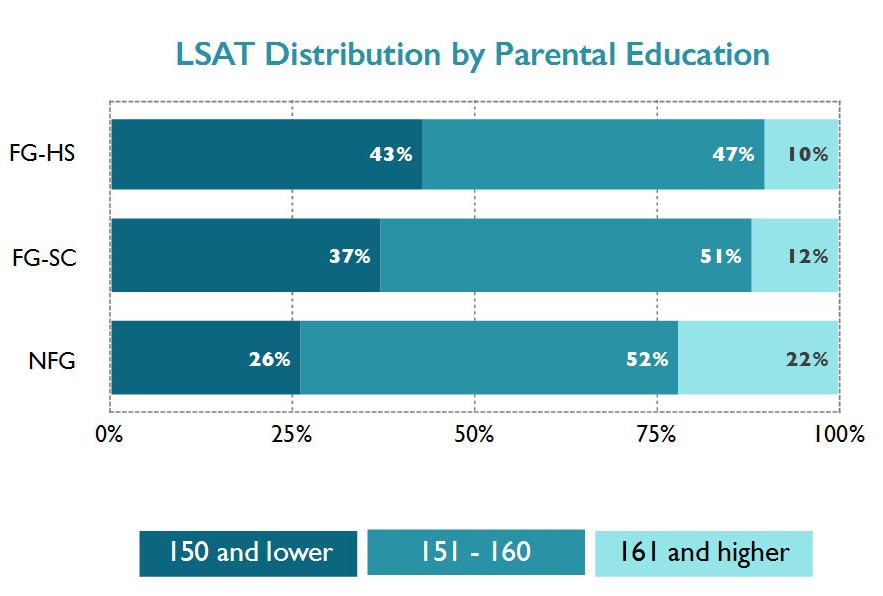
In our sample, N-FG respondents – presumably the most privileged group – were most likely to have received a merit scholarship; FG-HS respondents – the least privileged – were least likely. Like the disparities in scholarship awards among participants with different racial and ethnic backgrounds (see previous post), the disparities among students with differing parental education levels align with LSAT score trends. Forty-three percent of FG-HS respondents had LSAT scores below 151, compared to about a quarter of N-FG respondents. At the other end, 22% of N-FG respondents scored at 160 or higher, compared to just 10% of FG-HS respondents
The question is often posed: Why shouldn’t the LSAT be a primary criterion for determining who gains admission to law school and who receives scholarships? The most basic answer to this question is that the LSAT is designed to be a predictor of first-year law school performance and, in fact, explains roughly 38% of the variance in first-year law school grades. But the LSAT is even less reliable in predicting longer-term outcomes, such as bar exam performance and career success. Despite these limitations, the LSAT remains a central factor in most admissions and scholarship awarding decisions. It is an unfortunate and uncomfortable truth that a large number of admissions and merit scholarship decisions are rooted in a fundamental misuse of the LSAT. The heavy reliance on LSAT scores to award scholarship money exacerbates disadvantages based on privilege by distributing resources inequitably. Equity requires that we encourage the success of all our students by appreciating their differences and meeting their needs to the extent possible.
In our next post in this series, we will show some interesting associations between the type of scholarship students receive and their expected student loan debt levels.

LSSSE Annual Results 2016: Race, Ethnicity, and Economic Inequity (Part 2)
This is the second installment in a series of five posts based on data from the 2016 LSSSE survey administration and the 2016 Annual Report. The LSSSE 2016 Annual Report highlights inequities in scholarship policies and the associated consequences for student loan debt. In this post, we examine whether the financial costs of a legal education reinforce or mitigate larger societal inequities based on race and ethnicity.
Equity is important given the risks involved with attending law school. If scholarships are awarded to students with the most financial need, these students could attend law school with less financial stress and less reliance on student loans. The aid would, in turn, minimize risks among students for whom law school is already riskiest. Unfortunately, based on the LSSSE Survey data, law school scholarships flow most generously to students with the least financial need and least generously to those with the most need.
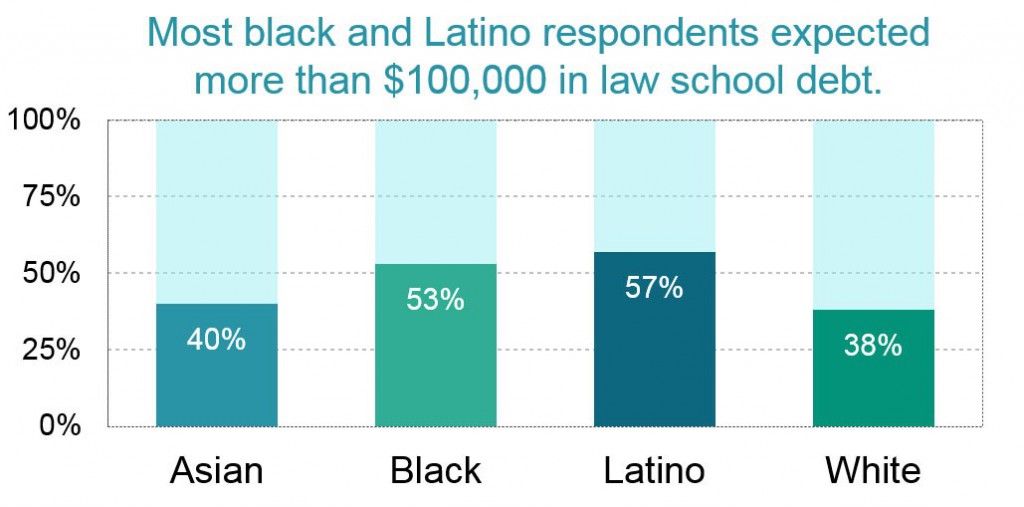
The income and wealth inequalities that plague our society foster vast disparities in student loan debt among people with similar levels of education. According to the Brookings Institution, “black college graduates owe $7,400 more [in student debt] on average than their white peers.” Four years after graduation, this gap balloons to $25,000, due to differences in interest accrual and graduate school borrowing. LSSSE data align with these findings. Fifty-three percent of black respondents and 57% of Latino respondents expected to owe more than $100,000 in law school debt upon graduation, compared to 38% of white and 40% of Asian respondents. As the Brookings data illustrate, higher interest accrual on higher debts will likely exacerbate these already yawning disparities over time.
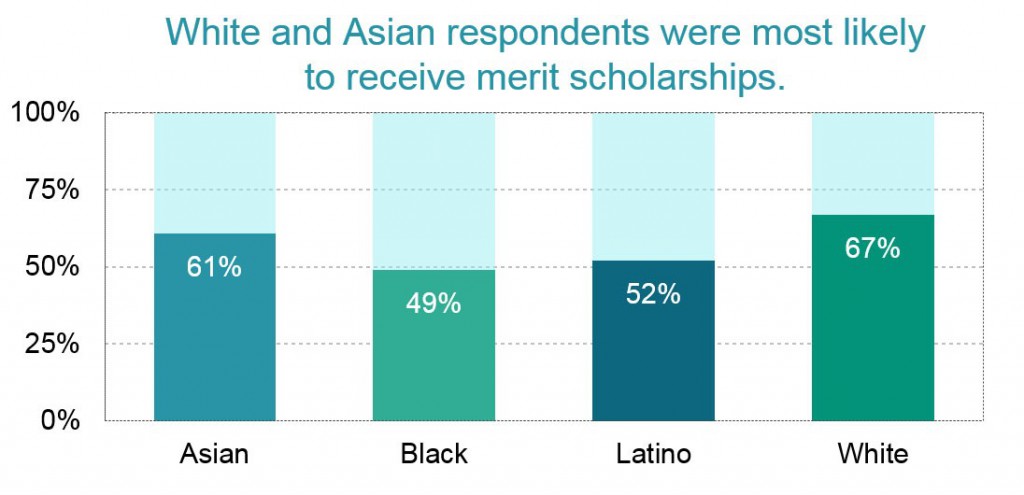
The close correspondence between LSAT scores and merit scholarships fostered racial and socioeconomic disparities. White and Asian respondents were most likely to have received a merit scholarship. Black and Latino respondents were least likely.
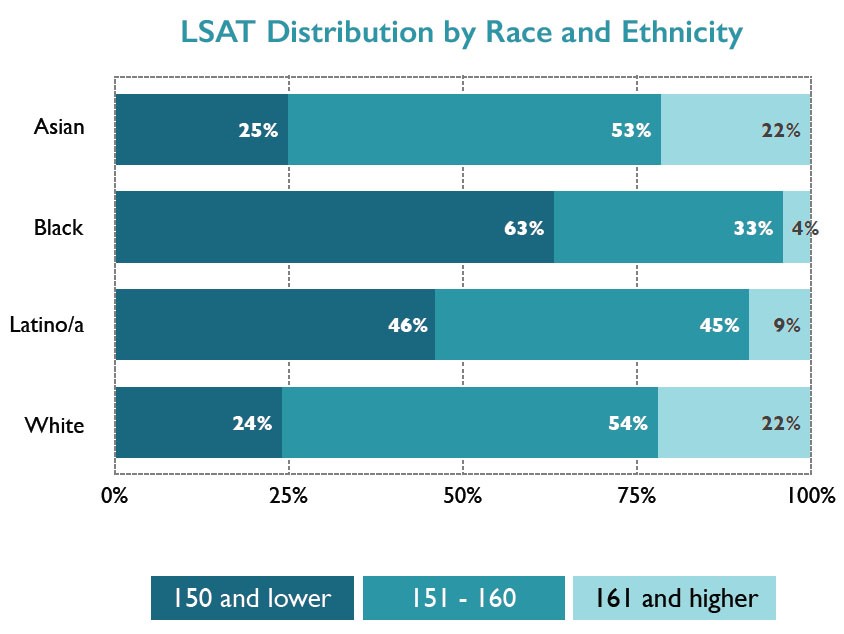
The underlying reason for this disparity is that LSAT scores among blacks and Latinos tend to be lower than those of whites and Asians. In the LSSSE sample, 63% of black respondents and 46% of Latino respondents had LSAT scores below the rough national median of 151. Only about a quarter of white and Asian respondents had scores below 151. At the other end of the distribution, where scholarship money flows most abundantly, 22% of white and Asian respondents scored above 160, while only 4% of black and 9% of Latino respondents scored at that level.
In our next post, we will highlight some differences in scholarship and debt patterns among students from different socioeconomic backgrounds and expand on why heavy reliance on LSAT scores to allocate scholarship funding may be deeply problematic for those who value equity in education.