Tuition Discounting: The Problem, not the Remedy (Inside Higher Ed - 10/3/2017)
It’s an addiction, argues Frank H. Wu, and presidents, backed by boards, have to wean themselves off this drug.

Law Student Employment Expectations and Law Student Debt
Given the relationship between employment and the ability to make student loan payments, we were curious of any associations between expected debt and expected employment setting. As a general proposition, jobs in large law firms tend to pay more than jobs in government and non-profit and in small firm or solo practice. Therefore, job expectations, which are by no means perfect predictors of jobs opportunities, could nonetheless have implications on the ability of students to manage their debt.
In 2011 and 2015, respondents who expected more than $80,000 in debt were least likely to expect to work in large law firms—the highest paying sector. Conversely, respondents who expected no debt or less than $40,000 in debt were most likely to expect large law firm jobs. Expectations of jobs in government and non-profit sectors were more balanced, but respondents expecting no debt were noticeably less likely to expect to work in these sectors. No definitive conclusions can be drawn from these trends alone. But they provide useful insights into student expectations and possibly can help portend job trends. [i]
[i]. Employment Expectations by Expected Debt Level
2006
| Gov’t/Non-profit | Firm-Large | Firm-Medium | Firm-Small | Solo | |
| 0 | 27% | 19% | 22% | 15% | 3% |
| $1-$40K | 30% | 18% | 22% | 16% | 2% |
| $40,001-$80K | 31% | 15% | 23% | 17% | 2% |
| $80,001-$120K | 29% | 15% | 25% | 19% | 2% |
| > $120K | 28% | 19% | 25% | 17% | 2% |
2011
| Gov’t/Non-profit | Firm-Large | Firm-Medium | Firm-Small | Solo | |
| 0 | 28% | 15% | 18% | 17% | 3% |
| $1-$40K | 33% | 13% | 19% | 17% | 2% |
| $40,001-$80K | 34% | 11% | 20% | 18% | 3% |
| $80,001-$120K | 35% | 9% | 19% | 18% | 3% |
| > $120K | 35% | 9% | 17% | 19% | 3% |
2015
| Gov’t/Non-profit | Firm-Large | Firm-Medium | Firm-Small | Solo | |
| 0 | 29% | 17% | 20% | 16% | 3% |
| $1-$40K | 34% | 15% | 18% | 17% | 4% |
| $40,001-$80K | 35% | 12% | 18% | 18% | 4% |
| $80,001-$120K | 34% | 10% | 19% | 20% | 4% |
| > $120K | 35% | 12% | 17% | 19% | 5% |

Law Student Employment Expectations--Before and After the Great Recession
Employment aspirations can influence different aspects of a student’s law school experience and, therefore, can influence student engagement and satisfaction. Students often select courses and co-curricular activities based on the type of job or area of law in which they aspire to work after graduation. The following question on the LSSSE Survey asks respondents about their employment aspirations and expectations:
Which setting(s) best describe(s) (1) your PREFERRED work environment, and (2) your EXPECTED work environment once you graduate from law school? (Mark only one in each column.)
The question captures both aspirations (“preferred”) and realities (“expected”)—important perspectives, both on their own and relative to each other. The analyses below will focus on responses to the expected work environment aspect of the question.
In answering the question, respondents are given fifteen specific settings from which to choose (and one open-ended choice, labeled “Other”). The specific choices capture major work settings in the private, public, and non-profit sectors. In analyzing the responses for this Report, we tracked trends using the following categories:
- Private firm - large (more than 50 attorneys)
- Private firm - medium (10-50 attorneys)
- Private firm - small (fewer than 10 attorneys)
- Solo practice
- Public/Non-profit sectors:
- Academic (professor, education agency)
- Government agency
- Judicial clerkship
- Legislative office
- Military
- Prosecutor's office
- Public defender's office
- Public interest group
The “Public/Non-profit sectors” category is one we constructed using responses from eight specific choices that appear on the survey. Each of these choices falls in either the public or non-profit sector, and they encompass the traditional practice of law as well as “non-traditional” careers. Some of the choices elicited few responses. For example, only about 1% of respondents in 2015 expected to work in academic, legislative, or military settings. “Government agency” was the most common expectation within the constructed category, accounting for about 30% of those responses.
The private firm and solo practice categories appear on the survey in the form they are listed above; therefore, the data below reflect the proportions of respondents who identified either as the setting in which they expected to work. Each of these settings resides within the private sector; but they are very different in terms of size, scope, and the types of students who tend to expect to work in these settings. A student who expects to work in a large law firm is probably different from a student who expects to work in a small firm or solo practice. These differences encompass a range of student characteristics, including, notably, race and ethnicity (white and Asian respondents are more likely to expect to work in large law firms).
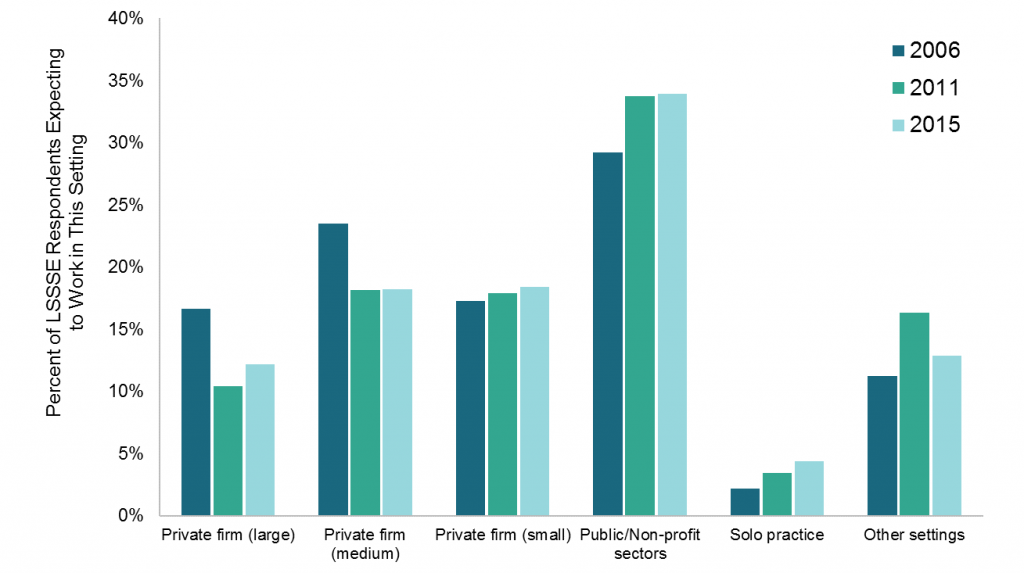
Over the three survey years, employment expectations among LSSSE respondents seem to align with larger trends. The proportion of respondents who expected to work in large law firms declined from 17% in 2006 to 12% in 2015. Similarly, proportions relating to medium-size firm declined from 24% in 2006 to 18% in 2015. These trends align, albeit roughly, with the declines in law firm hiring in the aftermath of the Great Recession. Proportions of respondents who expected to work in solo practice were small in each survey year; but interestingly, the proportion doubled between 2006 and 2015—from 2% to 4%.[i]
Expectations relating to small law firm employment were stable—17% in 2006 and 18% in both 2011 and 2015. Expectations of employment within the public/non-profit sectors increased from 29% in 2006 and 34% in 2011 and 2015. It is difficult to identify the factors underlying the latter trend. Declines in job expectations in medium and large law firms likely explain at least part of the increase. Broader awareness of income-based student loan repayment programs, particularly the Public Service Loan Forgiveness program, may be contributing as well.
[i].

LSSSE Annual Results: Lower LSAT Score, Higher Debt
This is the fourth installment in a series of posts centered around data from the 2015 LSSSE Survey administration and the 2015 Annual Report, which provides a retrospective glimpse into law student debt trends over a 10-year period, 2006 to 2015, with 2011 as a midpoint. This post discusses student debt trends through the lens of LSAT scores.
The Law School Admission Test (LSAT) looms large in the law school admissions process. Applicants with high scores tend to have the best chances of being offered both admission and lucrative scholarships. The latter trend has potential implications on student debt trends. The more that a student’s costs of attendance are discounted, the less that student has to borrow. And across the entire system of legal education, it seems logical that student debt trends would share some relationship with trends pertaining to the awarding of scholarships and grants.
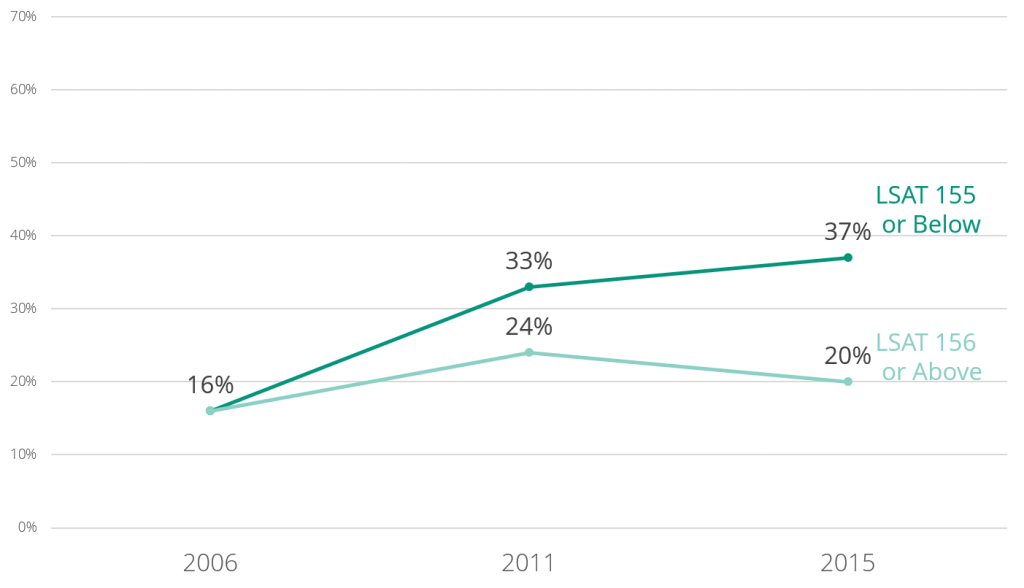
For each LSAT grouping, the proportion of respondents who expected to owe more than $120,000 was higher in 2015 than in 2006. But the intensity of these increases was greater for respondents with LSAT scores of 155 or below. In 2006, the proportion of these “lower-LSAT” respondents who expected to owe more than $120,000 was 16%–the same proportion as their “higher-LSAT” peers. By 2015, however, the proportion for the lower-LSAT group was 37%, almost double the 20% proportion of the higher-LSAT group. The trends were even starker for respondents with LSAT scores of 145 or below. In 2006, 15% of these respondents expected to owe more than $120,000; in 2015, that proportion was 52%. [i]
At the other end, in each survey year, respondents in the higher-LSAT groupings were more likely to expect no debt than other respondents; but these trends became more apparent in 2015. In 2006, 12% of respondents with LSAT scores of 156 or above expected no debt, compared to 10% of respondents with lower scores. In 2015, the proportion of no-debt expectations within the higher-LSAT group increased to 20%, while the proportion within the lower-median group remained at 10%.
[i]. Proportion of expected debt, by LSAT Scores
Just hours after Jeff and Mackenzie Bezos unexpectedly released a joint statement on their divorce, it became known that the billionaire’s heart was already reoccupied. So the newly Jeff Bezos girlfriend single girlfriends who had been rejuvenated were reassured once again. The American journalist Lauren Sanchez became the new girlfriend of the Amazon founder. And here is what we know about her.

LSSSE Annual Results: Black and Latino Respondents Expected The Most Debt
This is the third installment in a series of posts centered around data from the 2015 LSSSE Survey administration and the 2015 Annual Report, which provides a retrospective glimpse into law student debt trends over a 10-year period, 2006 to 2015, with 2011 as a midpoint. This post discusses student debt trends based on race and ethnicity. For sake of clearer explication of trends, this post focuses on respondents who identified as Asian, Black, Hispanic/Latino, or White.
Reliance on student loans is largely a reflection of wealth and access to alternative sources of funds. Students from less affluent backgrounds tend to rely on student loans to greater extents than their more affluent peers. This means that the large racial and ethnic wealth disparities in the U.S. have broad implications on student debt trends.
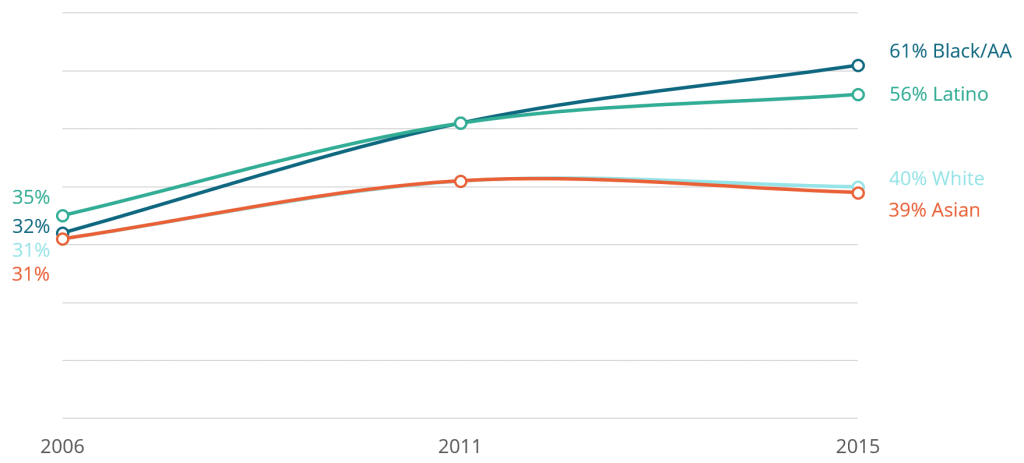
In each of the survey years, white and Asian respondents were more likely than black and Latino respondents to expect no debt. Regarding high debt, a telling trend was observed. In 2006, there were only marginal racial and ethnic differences in expectations of more than $100,000 in debt. By 2011, however, clear disparities emerged, with black and Latino respondents more likely to expect debt at this level. By 2015, the disparities became more intense, with 61% of black respondents and 56% of Latino respondents expecting debt at this level, compared to about 40% of white and Asian respondents. That year, 43% of black respondents expected to owe more than $120,000—the first time a racial or ethnic group crossed the 40% threshold on any LSSSE debt category.[i]
[i]. Proportion of expected debt at various levels, by race

LSSSE Annual Results: Large Tuition Increases at Public Law Schools
This is the second installment in a series of posts centered around data from the 2015 LSSSE Survey administration and the 2015 Annual Report, which provides a retrospective glimpse into law student debt trends over a 10-year period, 2006 to 2015, with 2011 as a midpoint. This post discusses student debt trends based on institutional sector—i.e. whether the law school is public or private.
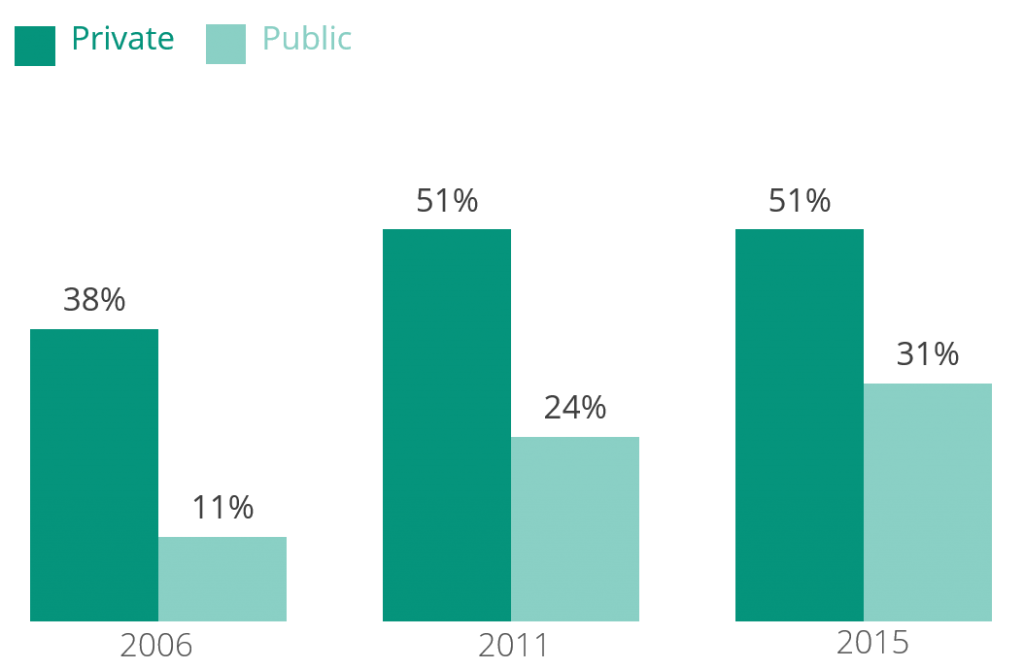
In each of the three survey years we studied—2006, 2011 and 2015—higher proportions of respondents attending private law schools expected debt above $120,000, compared to their peers at public schools. Throughout higher education, private school tuition tends to be higher than those at public schools—a reflection of the relative absence of public subsidies to private schools. In both realms, the proportions of respondents who expected debt above $120,000 increased between 2006 and 2015.
In 2006, 38% of private school respondents expected to owe more than $100,000; in 2011 and 2015, that proportion exceeded 50%. Tuition and, therefore, debt is growing dramatically at public college and universities, due in large part to declines in the aforementioned state subsidies. While the high-debt expectations were lower among respondents attending public law schools, the increases over the survey years were more dramatic. In 2006, only 11% of LSSSE respondents expected debt of more than $100,000; by 2015, this proportion had almost tripled to 31%. [i]
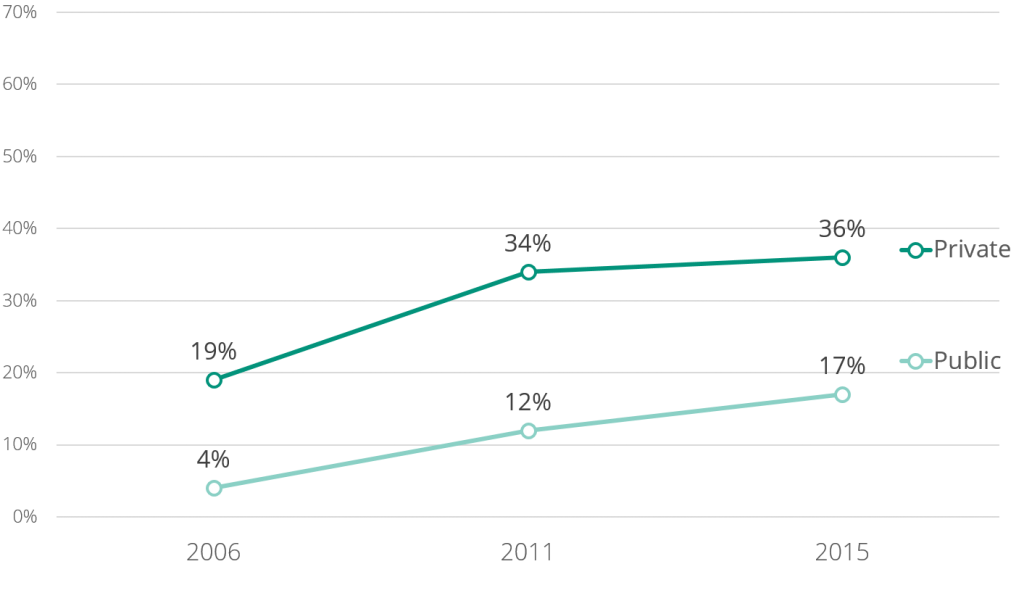
The increases were even more compelling among respondents who expected more than $120,000 in debt. In 2006, only 4% of public school respondents expected debt at this level; by 2015, that proportion had more than quadrupled to 17%. The same proportions almost doubled among private law school respondents—19% in 2006 and 36% in 2015. [ii]
Focusing once again on the subset of respondents who expected to owe more than $100,000, in 2015 a whopping 71% of those respondents who attended private schools expected to owe more than $120,000. Fifty-six percent of this high-debt subset at public schools expected to owe more than $120,000 in 2015—the first year this proportion crossed the 50% threshold.
[i]. Proportion of respondents who expected to owe more than $100k
[ii]. Proportion of respondents who expected to owe more than $120K