LSSSE 2016 Selected Results
This spring more than 35,000 law students at 72 law schools in the United States and Canada were asked to participate in the LSSSE survey. All JD or LLB students who attended the law school for at least one semester were invited to complete the web-based survey instrument. The average law school response rate in 2016 was 53%.
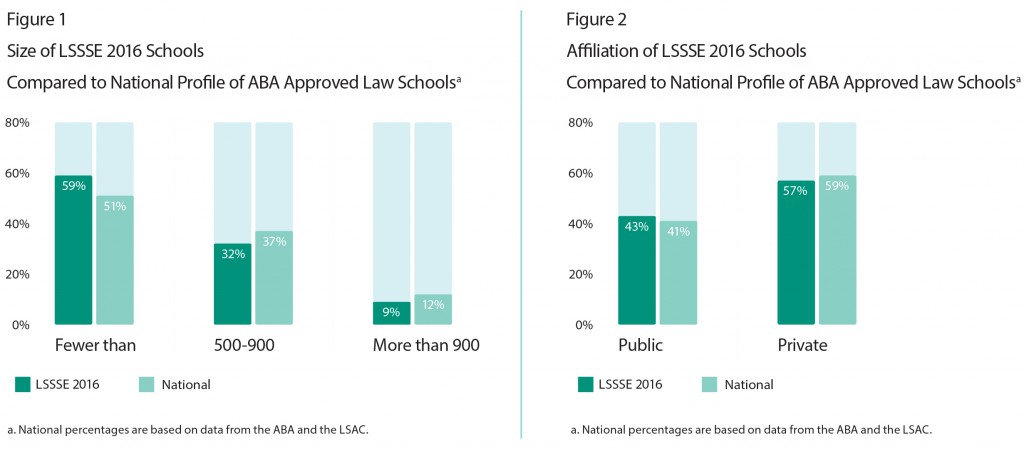
Figures 1 and 2 provide a comparison of LSSSE 2016 U.S. law schools to all ABA-approved law schools (“National”) with regard to the size of the student body and affiliation. The 2016 LSSSE cohort resembles that of the ABA-approved law schools in terms of size and affiliation.
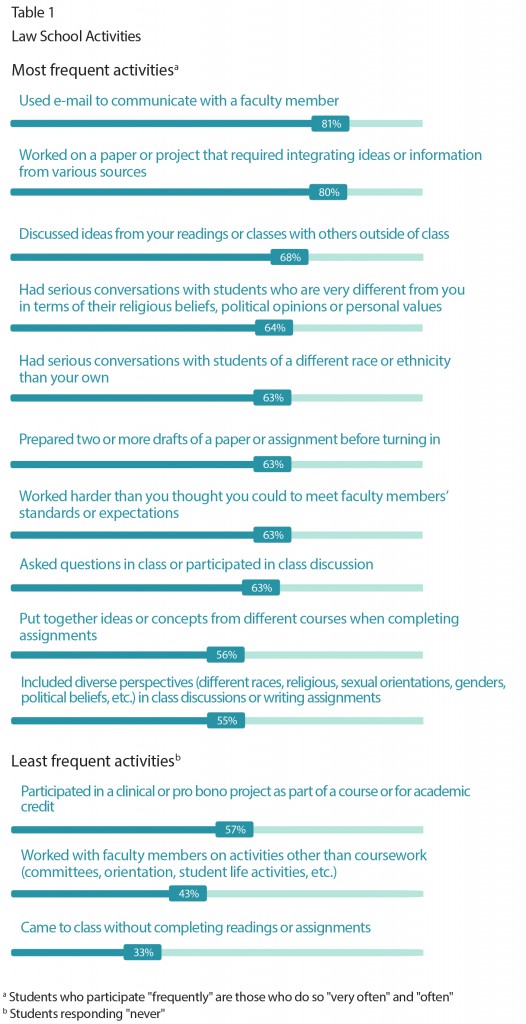
Law School Activities
The LSSSE survey focuses on activities in which students participate—both inside and outside the classroom—that influence their learning and personal and professional development.
Table 1 identifies the most and least frequent activities in which students participated. The “most frequent” activities are those in which more than half of respondents participated “often” or “very often.” The “least frequent” activities are those in which more than 25% of students responded “never,” meaning that at least a quarter of students never participated in that activity during this academic year.