New LSSSE Report Finds One in Five Law Students Lives with a Disability
Law students with disabilities show strong engagement and resilience but face persistent gaps in institutional support
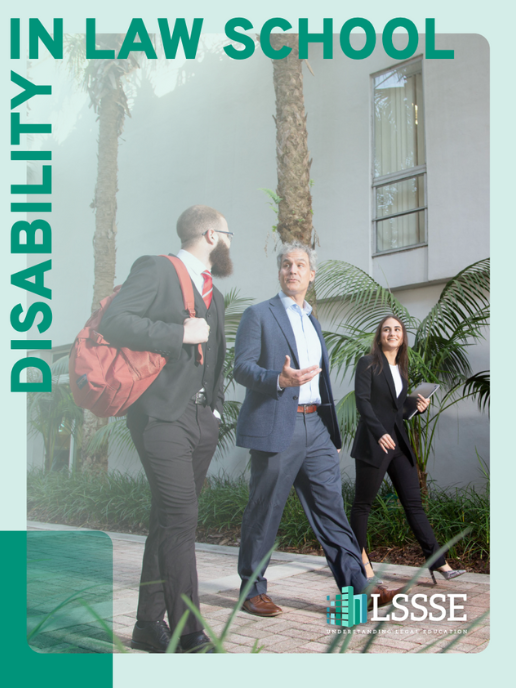
BLOOMINGTON, Ind.—Law School Survey of Student Engagement (LSSSE) has released its 2025 Annual Report, Disability in Law School, offering the first comprehensive look at disability among law students. The findings reveal that while law students with disabilities are among the most academically engaged in legal education, they receive less institutional support and report lower levels of belonging and satisfaction.
“Law students with disabilities do so much on their own—preparing for class, contributing to discussions, joining and leading student organizations and other activities at the highest levels,” said Meera E. Deo, Director of LSSSE. “But they are missing necessary institutional support. Law schools should meet them at least halfway, providing them with the structural tools they need to thrive.”
The Report shows students with disabilities comprise 20% of LSSSE respondents. According to data from the 2025 survey, disabled students invest considerable time and effort in their legal education but have meaningful disparities when compared to their non-disabled classmates. The Annual Report calls on law schools to strengthen accessibility and support systems that promote the success of all students.
Noteworthy findings from the 2025 Annual Report include:
Prevalence and Type of Disabilities
- Mental health and developmental disabilities are most common: 57% of disabled students report anxiety, 55% ADD/ADHD, and 41% depression.
- Among students with disabilities, 83% have at least one mental health or developmental condition; 37% have a chronic condition, learning disability, or other listed condition.
- 12% of disabled students report a physical disability, and 5% have a sensory disability, with many experiencing more than one type of condition.
Demographics of Disability
- Women (21%) are more likely than men (17%) to report a disability; two-thirds (67%) of non-binary students report having one.
- Disability rates vary by race: Multiracial (23%) students have the highest rate, while Asian American students (14%) have the lowest; roughly 1 in 5 White, Black, and Latinx students (19–20%) have a disability.
- Disability prevalence rises with age—15% among students under 22, increasing to 31% among those aged 31–40.
Academic Engagement
- 65% of disabled students frequently ask questions or contribute to discussions, compared to 57% of non-disabled students.
- Nearly one-third (32%) of disabled students participate in class “very often,” versus 24% of their peers.
- Disabled students spend about 1.5 hours more per week preparing for class (28.6 vs. 27.2 hours), reflecting heightened academic dedication.
Institutional Support
- While 88% of all students say their law school emphasizes academic effort, only 62% of disabled students feel their school provides strong academic support (vs. 70% of non-disabled students).
- 47% of disabled students report robust job search assistance, compared to 53% of non-disabled students.
- Only 27% of students with disabilities feel their school supports their social wellbeing and only 23% say their school helps them manage outside responsibilities like work and family.
Co-Curricular Activities
- Disabled students are more likely than others to participate in field placements or clinics (83% vs. 79%) and pro bono work (78% vs. 74%).
- Students with disabilities lead their non-disabled peers in engaging with faculty on research (39% vs. 34%) and leadership in student organizations (58% vs. 52%).
- Disabled students are less represented than others on law journals (42% vs. 50%) but participate equally in moot court (28%).
Sense of Belonging
- While 73% of disabled students feel comfortable being themselves at their law school, rates are much higher (88%) for non-disabled students.
- Only 60% of disabled students feel valued by their institution (vs. 74% of non-disabled students).
- 68% of disabled students feel like they are part of the law school community, compared to 81% of others.
Satisfaction
- Satisfaction gaps between disabled and non-disabled students are largest in personal counseling (58% disabled vs. 68% non-disabled) and career advising (59% disabled vs. 66% non-disabled).
- Disabled students are less satisfied than others with institutional job search support (56% vs. 63%) and academic advising (62% vs. 69%).
- Overall, 75% of disabled students rate their law school experience as “good” or “excellent,” compared to 84% of non-disabled students.