This is the first installment in a series based on data from the 2016 LSSSE survey administration and the LSSSE Report, Diversity Within Diversity: The Varied Experiences Of Asian And Asian American Law Students.
In 2016, LSSSE, for the first time, asked respondents identifying as Asian or Hispanic/Latino to also identify an ethnic subgroup. This report presents various disaggregated data for the Asian subgroups.
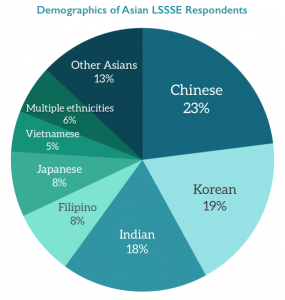
The data presented in this Report comes from the LSSSE Survey responses of more than 16,000 students at 67 U.S. law schools. A total of 1,147 LSSSE respondents identified as Asian, comprising 7% of the LSSSE pool – and about 1-in-7 of all Asian law students in the United States.
Chinese respondents were the largest Asian subgroup (23%), followed by Koreans (19%) and Indians (18%). There were six subgroups that comprised at least 5% of the pool of Asian respondents.
Comprising 81% of all Asian respondents, this report will center on these six groups. About 6% of respondents identified with multiple Asian subgroups or with an Asian subgroup and another race; their data is excluded from the subgroup analyses, as are data for respondents who identified with groups comprising less than 5% of the pool. The data presented in this report provide a glimpse into the experiences of these law students over the course of one school year.
Socioeconomic background
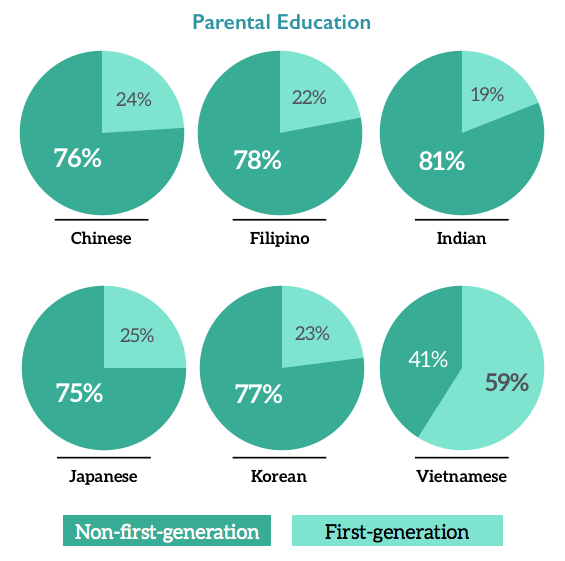
Socioeconomics loom large in the ascent to law school, and law students tend to be a relatively affluent group. The LSSSE Survey attempts to get a sense of the socioeconomic backgrounds of respondents by asking about the education levels of their parents. Researchers often use parental education as a proxy for socioeconomic status. The linkages between higher education and income dictate that students with college-educated parents tend to come from more affluent backgrounds. Respondents with at least one parent possessing a BA/BS or higher comprised more than 75% of each subgroup, with one glaring exception: Vietnamese respondents.
Only 41% of Vietnamese respondents had at least one parent with a BA/BS or higher. Put the other way, about 6-in-10 Vietnamese respondents were among the first-generation in their family to graduate from college. These trends align with the overall educational attainment figures cited earlier, and can be explained in large part by different immigration histories and patterns among groups.
Immigrant Status
Half of Chinese respondents reported being international students. This was the highest proportion by far; the second-highest being among Indian respondents (24%). The lowest proportion (1%) was among Filipino respondents.