LSSSE Annual Results 2016: Race, Ethnicity, and Economic Inequity (Part 2)
This is the second installment in a series of five posts based on data from the 2016 LSSSE survey administration and the 2016 Annual Report. The LSSSE 2016 Annual Report highlights inequities in scholarship policies and the associated consequences for student loan debt. In this post, we examine whether the financial costs of a legal education reinforce or mitigate larger societal inequities based on race and ethnicity.
Equity is important given the risks involved with attending law school. If scholarships are awarded to students with the most financial need, these students could attend law school with less financial stress and less reliance on student loans. The aid would, in turn, minimize risks among students for whom law school is already riskiest. Unfortunately, based on the LSSSE Survey data, law school scholarships flow most generously to students with the least financial need and least generously to those with the most need.
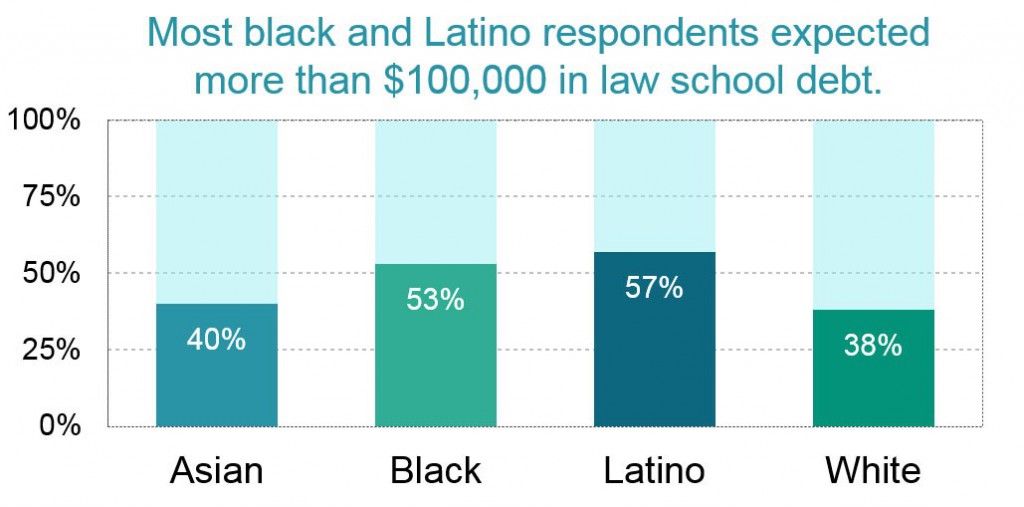
The income and wealth inequalities that plague our society foster vast disparities in student loan debt among people with similar levels of education. According to the Brookings Institution, “black college graduates owe $7,400 more [in student debt] on average than their white peers.” Four years after graduation, this gap balloons to $25,000, due to differences in interest accrual and graduate school borrowing. LSSSE data align with these findings. Fifty-three percent of black respondents and 57% of Latino respondents expected to owe more than $100,000 in law school debt upon graduation, compared to 38% of white and 40% of Asian respondents. As the Brookings data illustrate, higher interest accrual on higher debts will likely exacerbate these already yawning disparities over time.
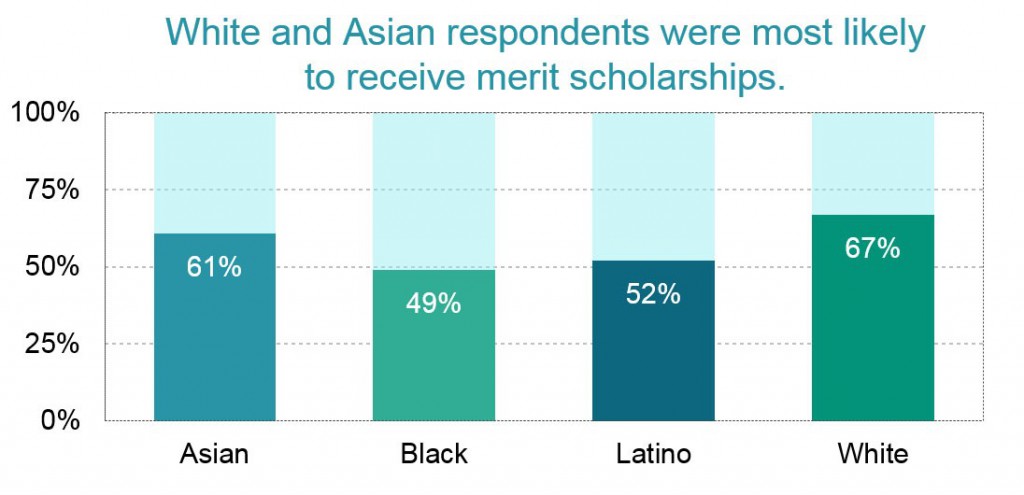
The close correspondence between LSAT scores and merit scholarships fostered racial and socioeconomic disparities. White and Asian respondents were most likely to have received a merit scholarship. Black and Latino respondents were least likely.
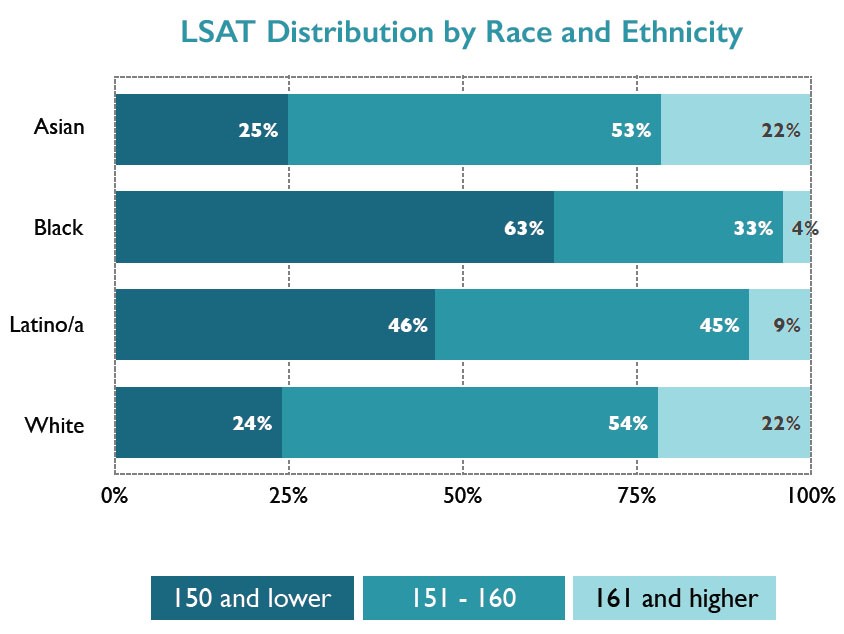
The underlying reason for this disparity is that LSAT scores among blacks and Latinos tend to be lower than those of whites and Asians. In the LSSSE sample, 63% of black respondents and 46% of Latino respondents had LSAT scores below the rough national median of 151. Only about a quarter of white and Asian respondents had scores below 151. At the other end of the distribution, where scholarship money flows most abundantly, 22% of white and Asian respondents scored above 160, while only 4% of black and 9% of Latino respondents scored at that level.
In our next post, we will highlight some differences in scholarship and debt patterns among students from different socioeconomic backgrounds and expand on why heavy reliance on LSAT scores to allocate scholarship funding may be deeply problematic for those who value equity in education.

LSSSE Annual Results 2016: Types of Scholarship Awards (Part 1)
This is the first installment in a series of five posts based on data from the 2016 LSSSE survey administration and the 2016 Annual Report. The LSSSE 2016 Annual Report highlights inequities in scholarship policies and the associated consequences for student loan debt. In this post, we summarize the overall prevalence of merit-based and need-based scholarships reported by LSSSE respondents.
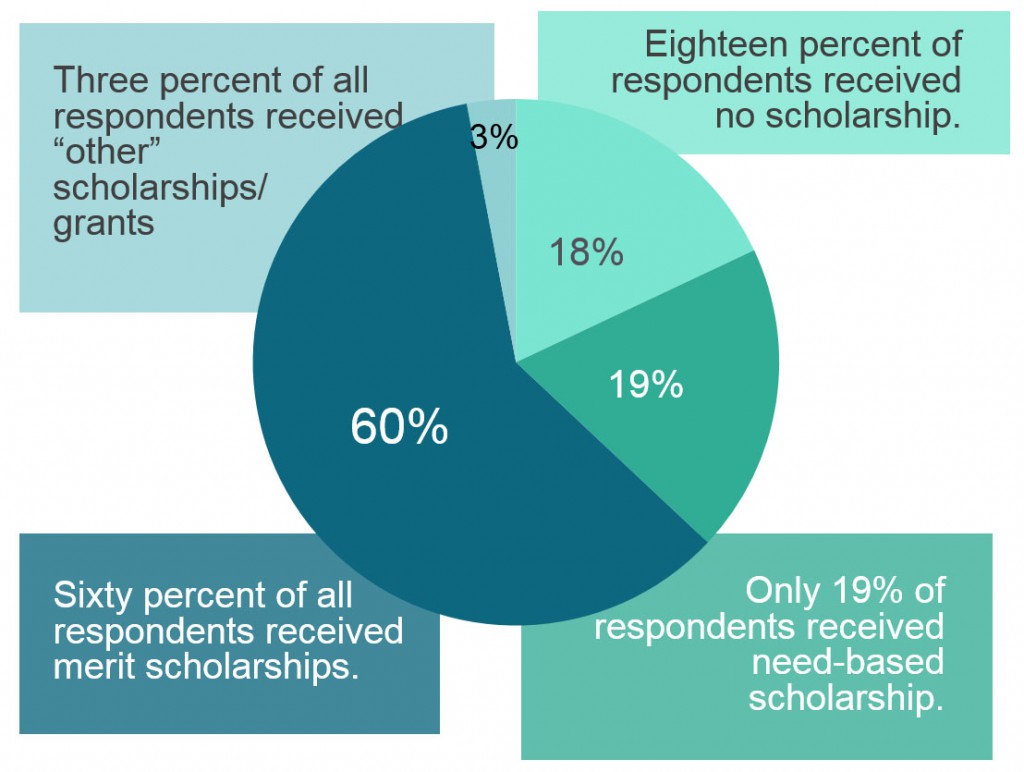
The cost of legal education is a topic of considerable interest. Discussions tend to revolve around ever-rising tuition sticker prices. The truth, however, is that relatively few students actually pay sticker price for their legal education. The downturn in law school applications and enrollments has prompted schools to rely more heavily on tuition discounts – mainly, scholarships – as a means of attracting students. Over 70% of the law students surveyed by LSSSE in 2016 reported having received scholarships for their studies – a proportion that would have been unimaginable a decade ago. By forcing schools to be more generous in awarding scholarships, the decreased demand for legal education has been a bright spot for many students.
Merit scholarship funding makes up the bulk of law school scholarship budgets. American Bar Association data show a vast expansion of merit scholarship funding between 2005 and 2010, and while more current data are limited, all indications are that this trend has continued and likely intensified since that time. Need-based funding, on the other hand, has remained essentially flat. Funding for so-called “need-plus” scholarships increased markedly. These awards are, in theory, need/merit hybrids. Nevertheless, indirect trends suggest these scholarships have little equitable impact, operating as merit scholarships by another name.
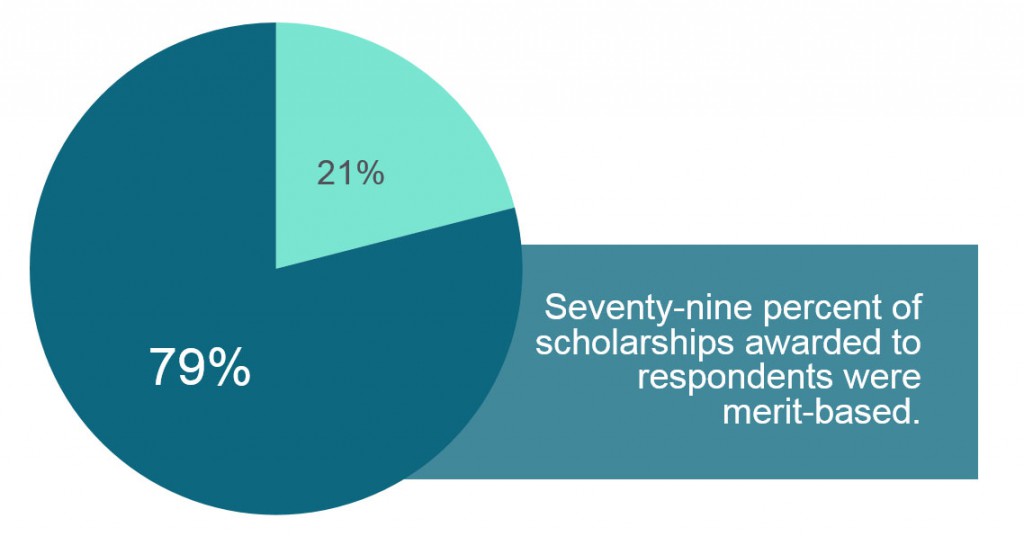
Among those respondents who reported receiving a scholarship, 79% of the scholarships were merit-based. Only 21% of the scholarships were need-based. Although the LSSSE data does not capture the dollar amounts of these scholarships, it is clear that law school scholarship policies heavily emphasize merit without regard for differences among students based on background or economic need.
Among those respondents who reported receiving a scholarship, 79% of the scholarships were merit-based. Only 21% of the scholarships were need-based. Although the LSSSE data does not capture the dollar amounts of these scholarships, it is clear that law school scholarship policies heavily emphasize merit without regard for differences among students based on background or economic need.
In our next two posts, we will discuss some general differences in student demographics between recipients of merit- and need-based scholarships.

Law Student Employment Expectations and Law Student Debt
Given the relationship between employment and the ability to make student loan payments, we were curious of any associations between expected debt and expected employment setting. As a general proposition, jobs in large law firms tend to pay more than jobs in government and non-profit and in small firm or solo practice. Therefore, job expectations, which are by no means perfect predictors of jobs opportunities, could nonetheless have implications on the ability of students to manage their debt.
In 2011 and 2015, respondents who expected more than $80,000 in debt were least likely to expect to work in large law firms—the highest paying sector. Conversely, respondents who expected no debt or less than $40,000 in debt were most likely to expect large law firm jobs. Expectations of jobs in government and non-profit sectors were more balanced, but respondents expecting no debt were noticeably less likely to expect to work in these sectors. No definitive conclusions can be drawn from these trends alone. But they provide useful insights into student expectations and possibly can help portend job trends. [i]
[i]. Employment Expectations by Expected Debt Level
2006
| Gov’t/Non-profit | Firm-Large | Firm-Medium | Firm-Small | Solo | |
| 0 | 27% | 19% | 22% | 15% | 3% |
| $1-$40K | 30% | 18% | 22% | 16% | 2% |
| $40,001-$80K | 31% | 15% | 23% | 17% | 2% |
| $80,001-$120K | 29% | 15% | 25% | 19% | 2% |
| > $120K | 28% | 19% | 25% | 17% | 2% |
2011
| Gov’t/Non-profit | Firm-Large | Firm-Medium | Firm-Small | Solo | |
| 0 | 28% | 15% | 18% | 17% | 3% |
| $1-$40K | 33% | 13% | 19% | 17% | 2% |
| $40,001-$80K | 34% | 11% | 20% | 18% | 3% |
| $80,001-$120K | 35% | 9% | 19% | 18% | 3% |
| > $120K | 35% | 9% | 17% | 19% | 3% |
2015
| Gov’t/Non-profit | Firm-Large | Firm-Medium | Firm-Small | Solo | |
| 0 | 29% | 17% | 20% | 16% | 3% |
| $1-$40K | 34% | 15% | 18% | 17% | 4% |
| $40,001-$80K | 35% | 12% | 18% | 18% | 4% |
| $80,001-$120K | 34% | 10% | 19% | 20% | 4% |
| > $120K | 35% | 12% | 17% | 19% | 5% |

Law Student Employment Expectations--Before and After the Great Recession
Employment aspirations can influence different aspects of a student’s law school experience and, therefore, can influence student engagement and satisfaction. Students often select courses and co-curricular activities based on the type of job or area of law in which they aspire to work after graduation. The following question on the LSSSE Survey asks respondents about their employment aspirations and expectations:
Which setting(s) best describe(s) (1) your PREFERRED work environment, and (2) your EXPECTED work environment once you graduate from law school? (Mark only one in each column.)
The question captures both aspirations (“preferred”) and realities (“expected”)—important perspectives, both on their own and relative to each other. The analyses below will focus on responses to the expected work environment aspect of the question.
In answering the question, respondents are given fifteen specific settings from which to choose (and one open-ended choice, labeled “Other”). The specific choices capture major work settings in the private, public, and non-profit sectors. In analyzing the responses for this Report, we tracked trends using the following categories:
- Private firm - large (more than 50 attorneys)
- Private firm - medium (10-50 attorneys)
- Private firm - small (fewer than 10 attorneys)
- Solo practice
- Public/Non-profit sectors:
- Academic (professor, education agency)
- Government agency
- Judicial clerkship
- Legislative office
- Military
- Prosecutor's office
- Public defender's office
- Public interest group
The “Public/Non-profit sectors” category is one we constructed using responses from eight specific choices that appear on the survey. Each of these choices falls in either the public or non-profit sector, and they encompass the traditional practice of law as well as “non-traditional” careers. Some of the choices elicited few responses. For example, only about 1% of respondents in 2015 expected to work in academic, legislative, or military settings. “Government agency” was the most common expectation within the constructed category, accounting for about 30% of those responses.
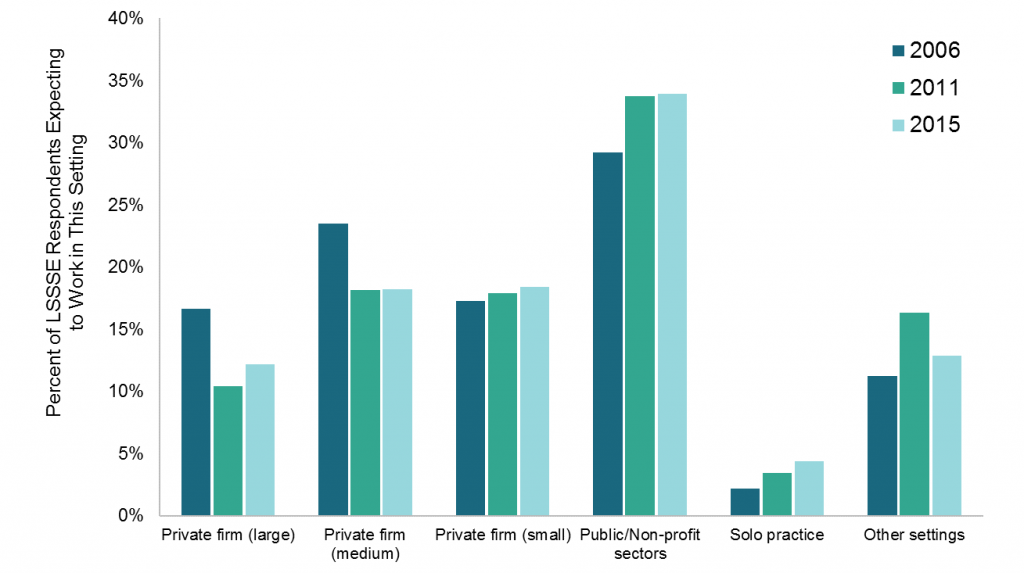
The private firm and solo practice categories appear on the survey in the form they are listed above; therefore, the data below reflect the proportions of respondents who identified either as the setting in which they expected to work. Each of these settings resides within the private sector; but they are very different in terms of size, scope, and the types of students who tend to expect to work in these settings. A student who expects to work in a large law firm is probably different from a student who expects to work in a small firm or solo practice. These differences encompass a range of student characteristics, including, notably, race and ethnicity (white and Asian respondents are more likely to expect to work in large law firms).
Over the three survey years, employment expectations among LSSSE respondents seem to align with larger trends. The proportion of respondents who expected to work in large law firms declined from 17% in 2006 to 12% in 2015. Similarly, proportions relating to medium-size firm declined from 24% in 2006 to 18% in 2015. These trends align, albeit roughly, with the declines in law firm hiring in the aftermath of the Great Recession. Proportions of respondents who expected to work in solo practice were small in each survey year; but interestingly, the proportion doubled between 2006 and 2015—from 2% to 4%.[i]
Expectations relating to small law firm employment were stable—17% in 2006 and 18% in both 2011 and 2015. Expectations of employment within the public/non-profit sectors increased from 29% in 2006 and 34% in 2011 and 2015. It is difficult to identify the factors underlying the latter trend. Declines in job expectations in medium and large law firms likely explain at least part of the increase. Broader awareness of income-based student loan repayment programs, particularly the Public Service Loan Forgiveness program, may be contributing as well.
[i].
A Tribute to Dan Bernstine

LSSSE 2016 Selected Results: Law School Activities
LSSSE 2016 Selected Results
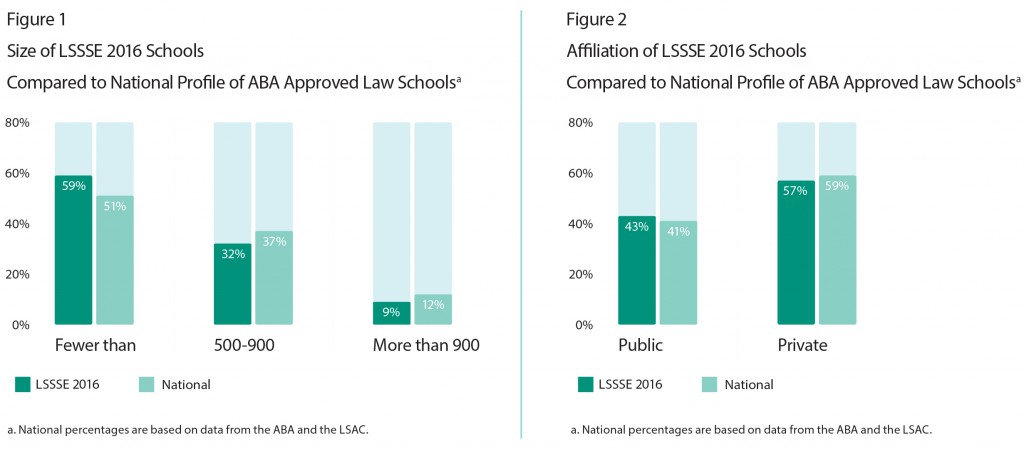
This spring more than 35,000 law students at 72 law schools in the United States and Canada were asked to participate in the LSSSE survey. All JD or LLB students who attended the law school for at least one semester were invited to complete the web-based survey instrument. The average law school response rate in 2016 was 53%.
Figures 1 and 2 provide a comparison of LSSSE 2016 U.S. law schools to all ABA-approved law schools (“National”) with regard to the size of the student body and affiliation. The 2016 LSSSE cohort resembles that of the ABA-approved law schools in terms of size and affiliation.
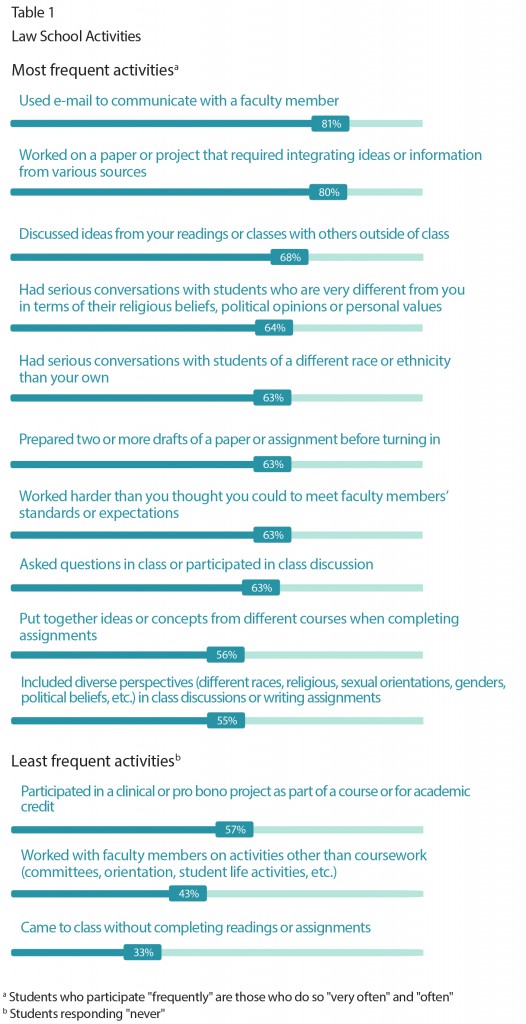
Law School Activities
The LSSSE survey focuses on activities in which students participate—both inside and outside the classroom—that influence their learning and personal and professional development.
Table 1 identifies the most and least frequent activities in which students participated. The “most frequent” activities are those in which more than half of respondents participated “often” or “very often.” The “least frequent” activities are those in which more than 25% of students responded “never,” meaning that at least a quarter of students never participated in that activity during this academic year.

Law Student Stress
The topic of law student stress has garnered increased attention in legal education. Given the prominence of this issue, LSSSE created a 9-question Law Student Stress Module that was appended to the core survey and administered to a subset of students at 13 law schools. The module gathered 3,716 responses that provide interesting insights into this under-researched but central aspect of the law student experience.
The first question in the module asked respondents:
During the current school year, how would you characterize your level of law school related stress or anxiety?
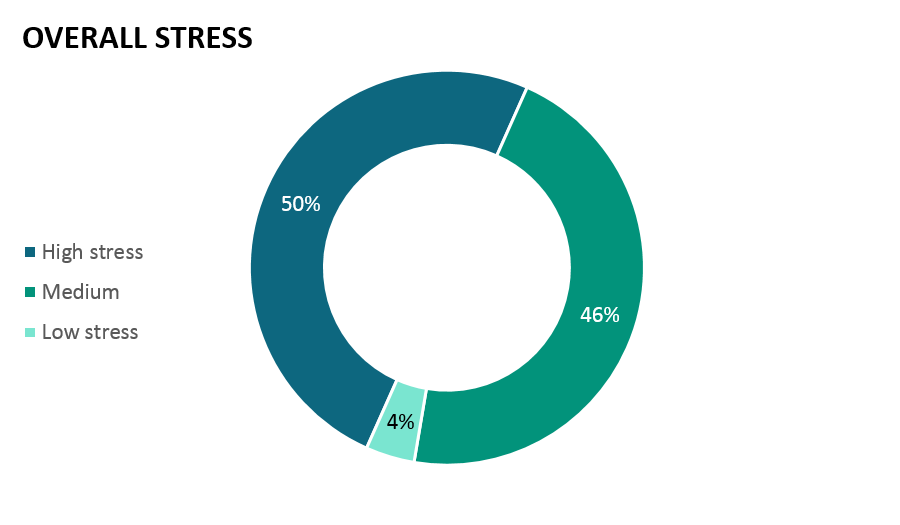
Respondents were given a 7-point scale to characterize the intensity of their stress or anxiety. The first point on the scale (1) signified no stress; the last point (7) signified “very high” stress. For purposes of the analyses below, we constructed the following three response groupings:
- High stress/anxiety: 6 or 7
- Medium stress/anxiety: 3 or 4 or 5
- Low (or no) stress/anxiety: 1 or 2
Half of respondents reported high stress or anxiety during the school year, 46% reported medium levels, and 4% reported low levels (Figure 1). This means that virtually every respondent reported appreciable law school related stress or anxiety. These proportions are not surprising given the nature of legal education, and it is important to note that stress and anxiety are not always associated with negative outcomes.
Figure 1.
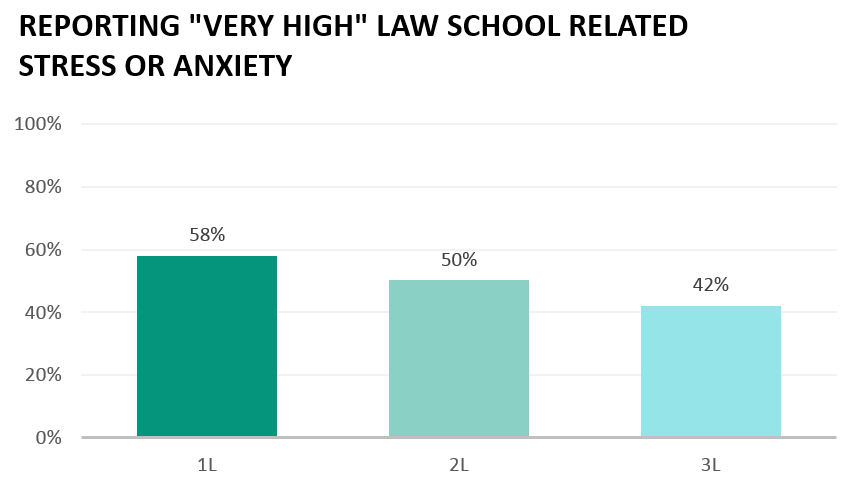
While nearly half of all law students indicated high levels of law school related stress, 3L students reported statistically significant lower levels of law school related stress than either 1Ls or 2Ls (Figure 2).
Figure 2.
The Law Student Stress Module identified six elements of the law school experience that are believed to be common stressors for students. Using the same 7-point scale, respondents were asked to indicate the extent to which each element indeed caused them stress or anxiety.
The elements are listed below, in order of the proportion of respondents who indicated high levels of stress or anxiety relating to each (Figure 3):
Figure 3.
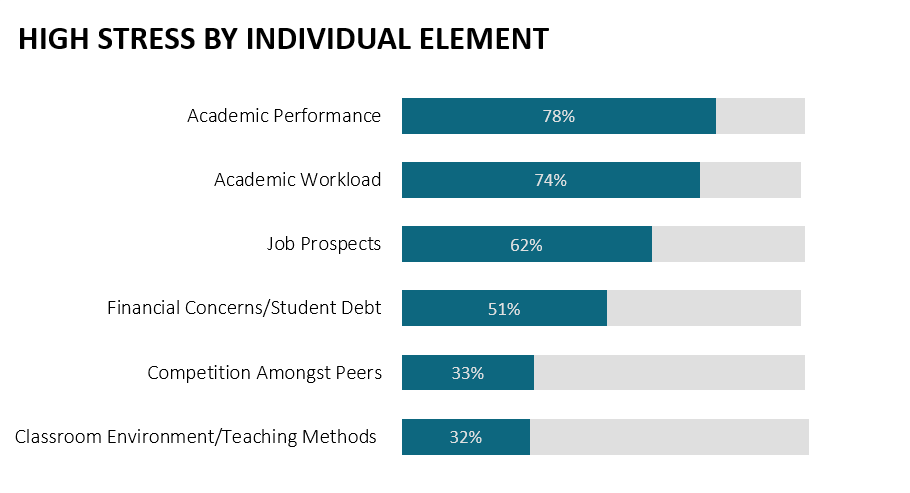
About three-quarters of respondents reported that concerns about academic performance and academic workload were sources of high stress and anxiety. More than half of respondents indicated that concerns about job prospects and finances (including student debt) were sources of high stress and anxiety. About a third of respondents indicated that competition with their peers and concerns relating to the classroom environment (including the teaching methods) were sources of high stress.
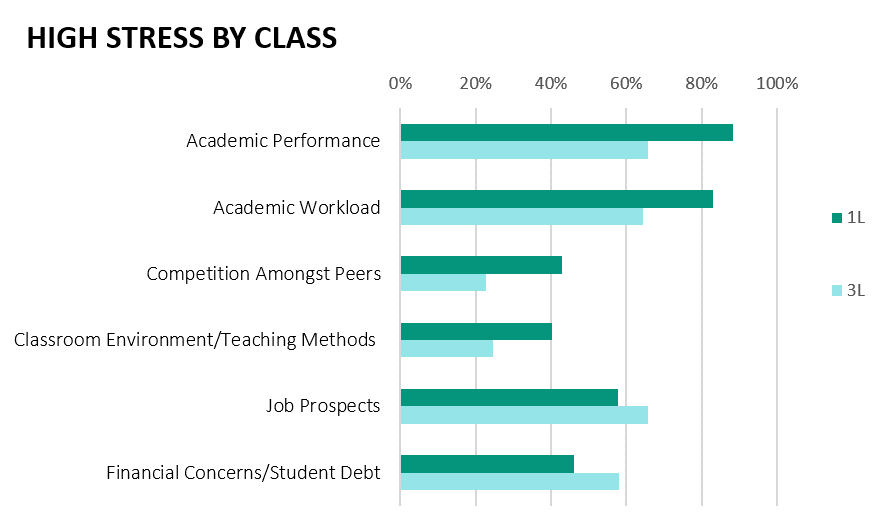
Stress related to academic performance was more prevalent for 1L and 2L students than 3L students. A similar pattern was shown for stress related to academic workload, competition amongst peers, and classroom environment/teaching methods where 1Ls reported the most stress, followed by 2L and 3L students. Conversely, 3L students reported being more stressed about financial concerns/student debt and job prospects than either 1L or 2L students (Figure 4).
Figure 4.
Stress in law school impacts student performance. About half (46.9%) indicated that stress or anxiety impacted their law school performance with only 19.5% indicating either “not at all” or “very little.” Only 8.2% of the respondents indicated that their law school “very much” emphasized ways to effectively manage stress or anxiety with the vast majority (69.7%) indicating either “very little” or “some.”
First-year students reported that stress or anxiety impacted their law school performance at higher rates than 3L students. However, 1L students also reported their law school emphasized ways to effectively manage stress greater than 2L or 3L students.

First Generation Law Students: Use of Time
First-generation students face a myriad of challenges in higher education. At the undergraduate level, they tend to apply to college with lower admissions indicators (e.g., grade point averages, standardized test scores) than other students, and once enrolled, they tend to persist and graduate at lower rates. The challenges faced by first-generation students have roots in academic, social, and financial realms.
The bulk of the research on first-generation students focuses on the undergraduate experience. However, very little research has been conducted on first-generation students who go on to attend law school. Therefore, the data presented in this section explores largely unexamined questions.
LSSSE 2014 data show that on a number of dimensions, the amount of time that first generation law students spent with peers and faculty outside of class was significantly less than non-first generation law students.
Co-curricular activities are critical components of the academic experience. These activities often supplement class discussions and aid in the development of new skills. They can also make students more attractive to potential employers. First-generation students reported lower rates of participation in some of the most prominent co-curricular activities, such as law journal, moot court, and faculty research assistantships. Eligibility for these activities is often determined by law school grades. Differences in time spent studying for class and working for pay could also contribute.
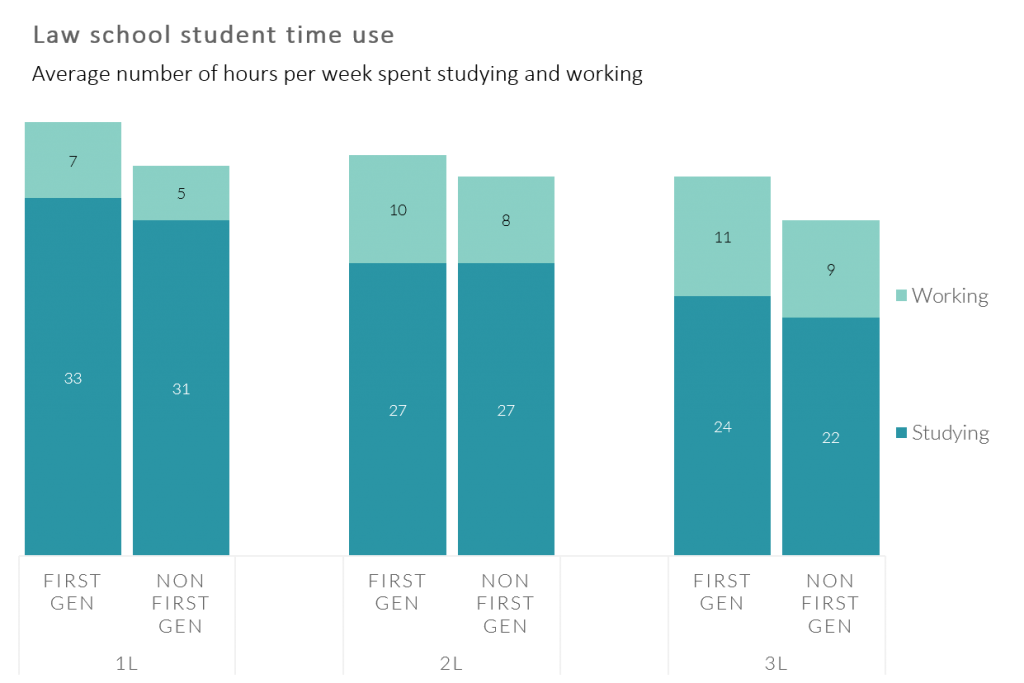
First-generation students reported spending about 8% more time studying for class and 25% more time working for pay, compared to other students. The disparities in time spent studying are greatest in the latter years of study. First-generation 3Ls reported spending 8.5% more time studying than other 3Ls.
Disparities in the amount of time spent working are most pronounced in the first year, when first-generation students report spending 40% more time. The actual hours spent do not seem particularly high for either group, but aggregated over the course of the school year, the additional time adds up considerably.

LSSSE Annual Results: Higher Debt, Lower Student Satisfaction (Part 2)
This is the sixth installment in a series of posts centered around data from the 2015 LSSSE Survey administration and the 2015 Annual Report, which provides a retrospective glimpse into law student debt trends over a 10-year period, 2006 to 2015, with 2011 as a midpoint. This post discusses student debt and the student satisfaction.
The LSSSE Survey is designed to measure the effects of legal education on law students. Student satisfaction is related to those effects; therefore, respondents are asked:
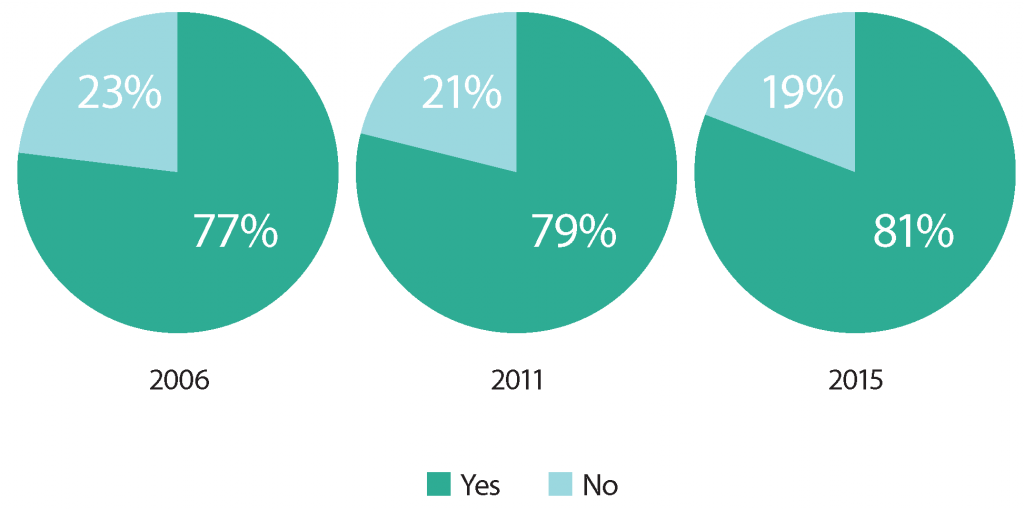
If you could start over again, would you go to the same law school you are now attending?
The purpose of this question is to, again, prompt respondents to consider and assess their law school experiences, but this time in the context of the opportunity costs. Respondents are given the following four answer choices:
- Definitely yes
- Probably yes
- Probably no
- Definitely no
In the analyses below, the favorable responses (Definitely yes and Probably yes) are combined, as are the unfavorable responses (Probably no and Definitely no).
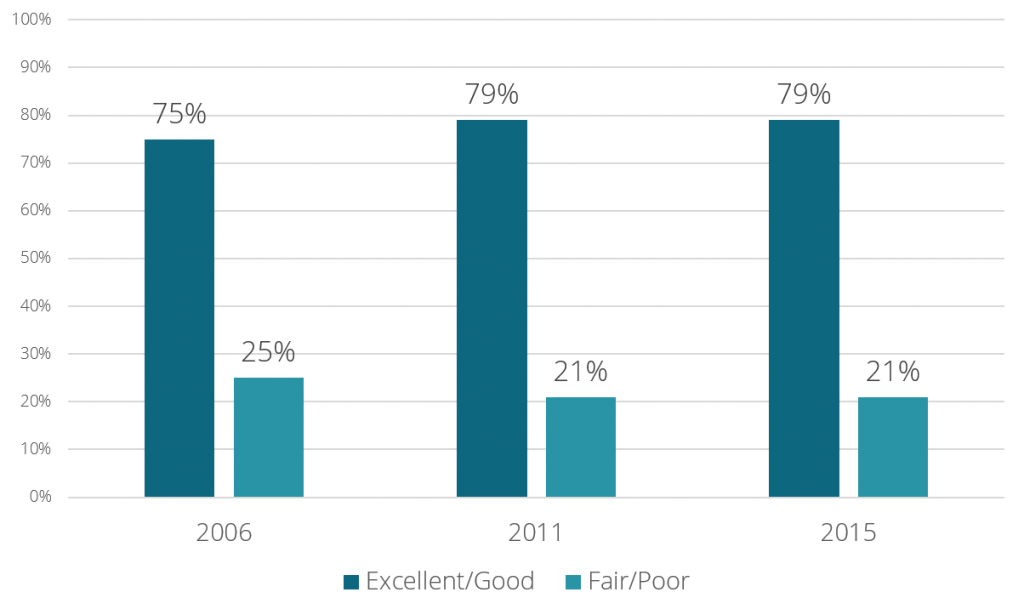
In each survey year, respondents who expected to owe more than $120,000 were noticeably less likely to respond favorably to the satisfaction questions. In 2006, 75% of these respondents had favorable views of their law school experiences, compared to the overall rate of 80%. Similar differences were observed in 2011 and 2015.
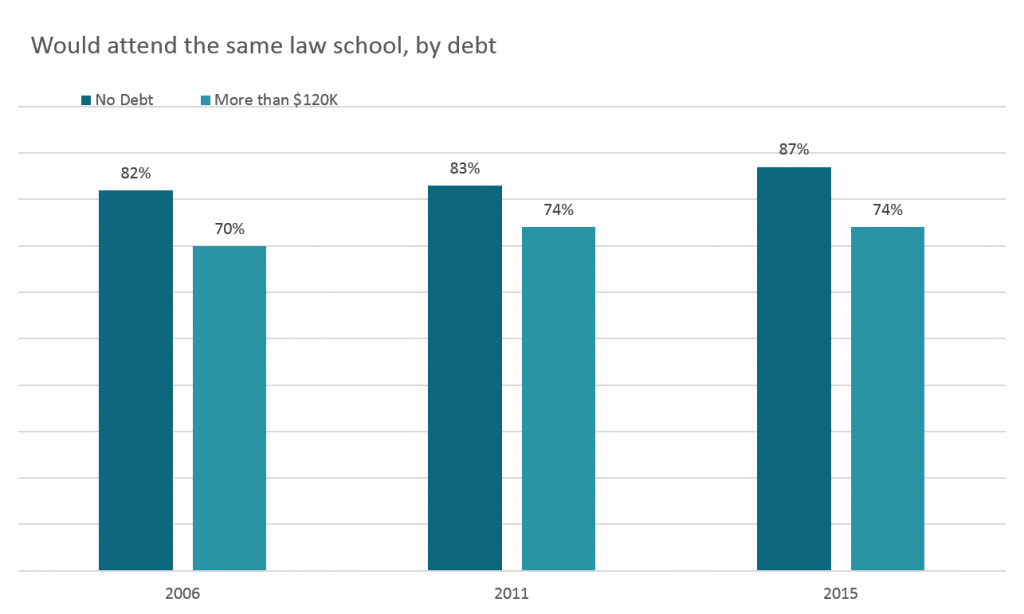
The effects of debt seemed even more apparent in the responses to the “same law school” question. With a few slight exceptions, in every survey year, respondents were less likely to state that they would attend the same law school as expected debt increased. At the level of more than $120,000 in expected the debt, 70% of respondents in 2006 said they would attend the same law school, compared to 82% of those who expected no debt. In 2011, the favorable response rate among these high-debt respondents was 74%, compared to 83% of those who expected no debt. And lastly, in 2015, 74% of these high-debt respondents stated they would attend the same school, compared to 87% of those expecting no debt. This 13-percentage point difference was the largest among the three survey years.

LSSSE Annual Results: Higher Debt, Lower Student Satisfaction (Part 1)
This is the fifth installment in a series of posts centered around data from the 2015 LSSSE Survey administration and the 2015 Annual Report, which provides a retrospective glimpse into law student debt trends over a 10-year period, 2006 to 2015, with 2011 as a midpoint. This post discusses student debt and the student experience.
The LSSSE Survey is designed to measure the effects of legal education on law students. Student satisfaction is related to those effects; therefore, respondents are asked:
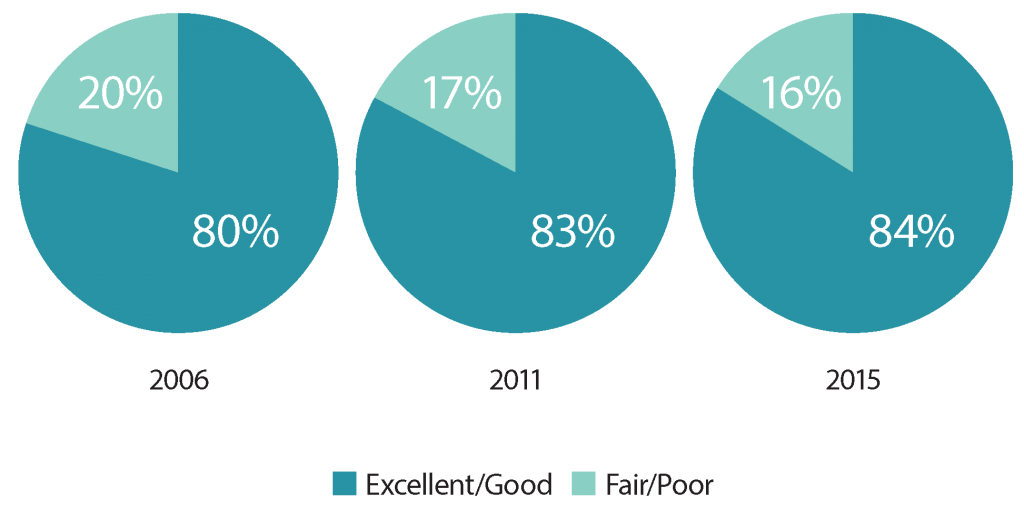
How would you evaluate your entire educational experience at your law school?
The purpose of this question is to prompt respondents to consider and assess their law school experiences. This is, in essence, a question regarding satisfaction, a perceptional concept. As such, respondents are given the following four answer choices:
- Excellent
- Good
- Fair
- Poor
In the analyses below, the favorable responses (Excellent and Good) are combined, as are the unfavorable responses (Fair and Poor).
As a general proposition, LSSSE respondents reported high levels of satisfaction with their law school experience in each of the survey years. In 2015, 84% of respondents rated their law school experiences “excellent” or “good.” [i] Eighty-one percent stated that they would definitely or probably attend their same law school again. [ii] Interestingly, these proportions were higher than in both 2011 and 2006. This is noteworthy, given the increased costs of legal education and the handwringing about whether the endeavor is worth those costs.
A possible theory for these higher expressions of satisfaction might be that those who have opted to attend law school in spite of the unflattering scrutiny of late are more likely to have an affinity for the endeavor that transcends some of the most common practical considerations. Put simply, current law students may be more apt to be satisfied with the experience compared to past cohorts. Another theory could be that law schools have adapted to changing student needs and demands in ways that have increased satisfaction. In any case, the trend was somewhat surprising to us.
But in each survey year, respondents who expected to owe more than $120,000 were noticeably less likely to respond favorably to the satisfaction questions. In 2006, 75% of these respondents had favorable views of their law school experiences, compared to the overall rate of 80%. Similar differences were observed in 2011 and 2015. [iii]
[i]. Overall Satisfaction with “Entire Law School Experience” response proportions
[ii]. Overall “Same Law School” response proportions
[iii]. Satisfaction with “Entire Law School Experience,” more than $120K