Student Debt is a raceXgender Issue
 Student Debt is a raceXgender Issue
Meera E Deo, JD, PhD
Professor of Law, Southwestern Law School
Director, Law School Survey of Student Engagement
William H Neukom Chair in Diversity & Law, American Bar Foundation
Previous LSSSE publications have highlighted how the escalating costs of law school attendance have changed the landscape of legal education. Our 2020 Retrospective Report (which analyzed fifteen years of data) revealed that while in 2004, only 18% of LSSSE participants expected to owe over $100,000, by 2019 that number had skyrocketed to 39%. In 2015, LSSSE published an Annual Report stating that “the large racial and ethnic wealth disparities in the U.S. have broad implications on student debt trends,” with students of color carrying greater debt burdens than white classmates. More recently, in a publication entitled The Cost of Women’s Success, we found that women are more likely than men to borrow at the highest levels to earn a law degree—with 19% of women owing over $160,000 and 7.9% owing over $200,000 (compared to 14% and 5.5% of men, respectively).
Given the increasing costs of legal education overall, as well as ongoing gender disparities and racial/ethnic disparities, it should be no surprise that there are also marked raceXgender disparities. My previous research has introduced the concept of raceXgender bias, explaining “how the combination of these two particular identity characteristics create not just additive but compound effects in the personal and professional lives of women of color.” Applying that intersectional framework to the context of student debt, it becomes clear that we must think of increasing student loans as a raceXgender issue.
Not only do women as a whole carry greater debt burdens than men, but these gender disparities remain constant within every racial/ethnic group. In other words, women of color shoulder a disproportionate share of the debt burden in legal education. A full 16% of Latinas and 14% of Black women expect to graduate with more than $200,000 in student loans, compared to 12% of Latino men, 7.3% of Black men, and smaller percentages of those from other racial/ethnic groups. No Native American respondents expect to owe over $200,000 to complete their education; however, consistent with gender disparities in other racial/ethnic groups, a full 15% of Native American women carry over $160,000 in student loans, compared to just 7.1% of Native American men.
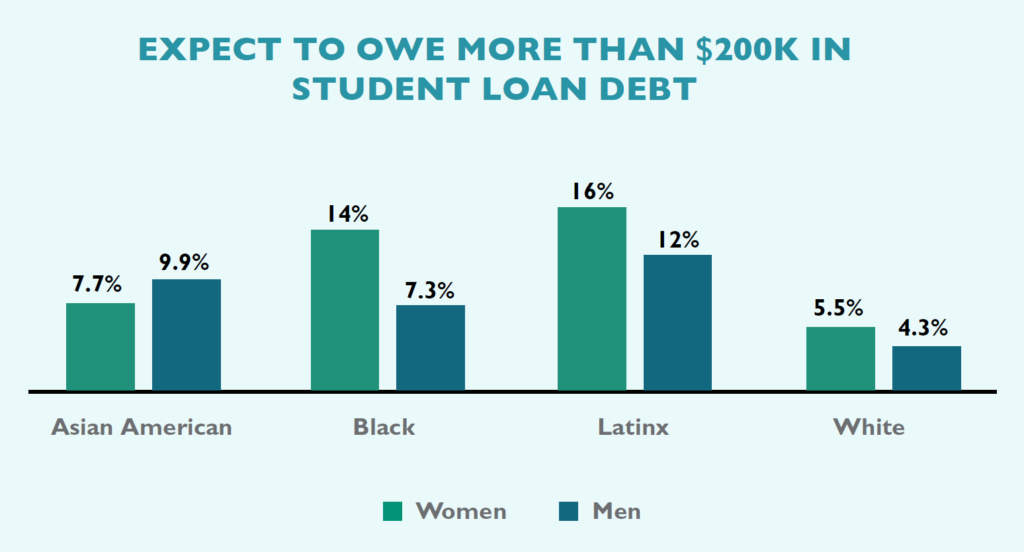
Legal education must address student loan disparities—not only as a racial justice issue, not only as a critical women’s issue, but also as an issue of raceXgender bias.
Law Student Perceptions of Faculty
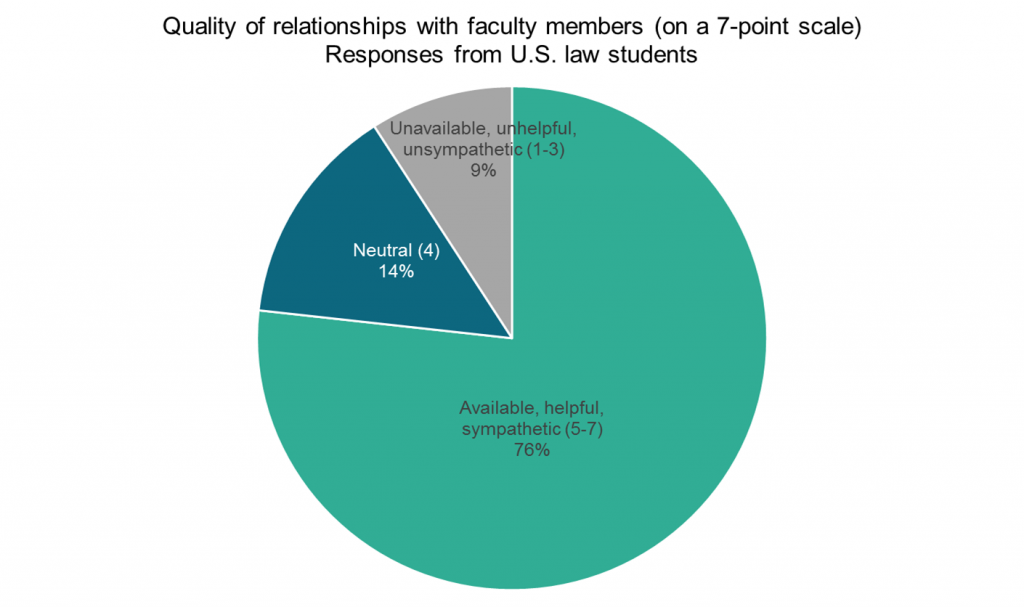
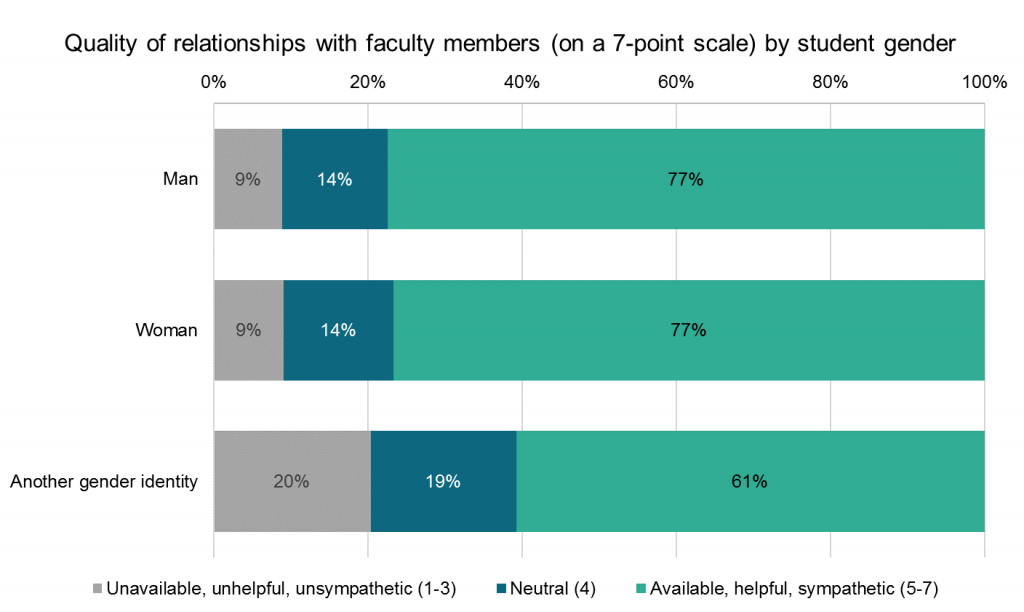
The Law Student Survey of Student Engagement (LSSSE) asks students about the quality of their relationships and interactions with law school faculty as a way of measuring whether students feel valued by others and engaged with the law school experience. As a group, law students tend to have positive perceptions of their instructors. In 2018, 76% of the 17,928 U.S. law students who responded to LSSSE rated their relationships with faculty as at least a “five” on a seven-point scale, where “one” was the perception of faculty as “unavailable, unhelpful, and unsympathetic” and “seven” was the perception of faculty as “available, helpful, and sympathetic.” Male and female students were pleased with their instructors at equal rates, although students of other gender identities were somewhat less satisfied, with only 61% rating their relationships with faculty a “five” or higher.
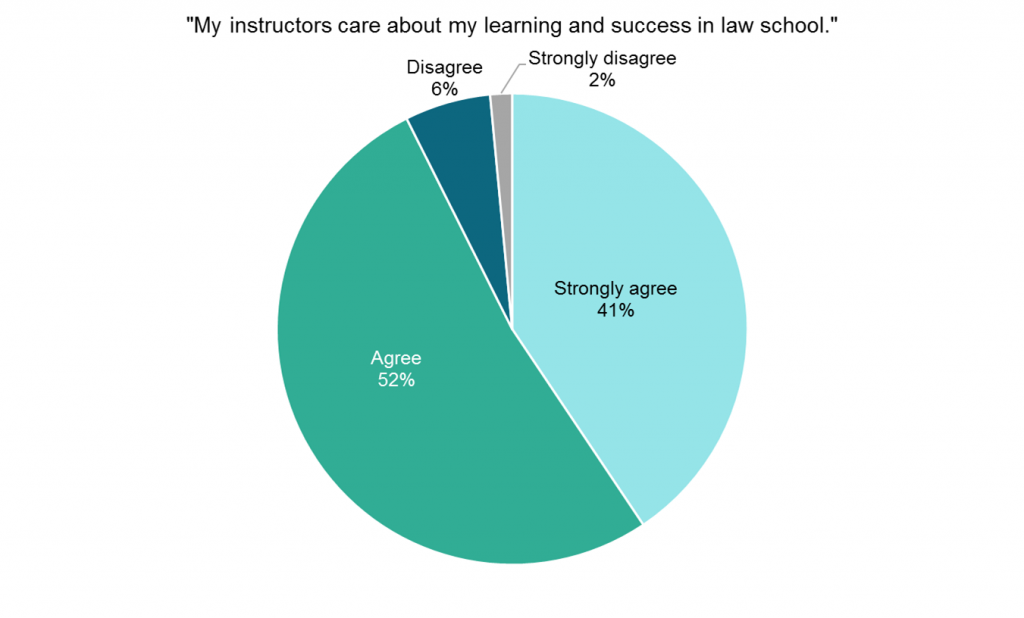
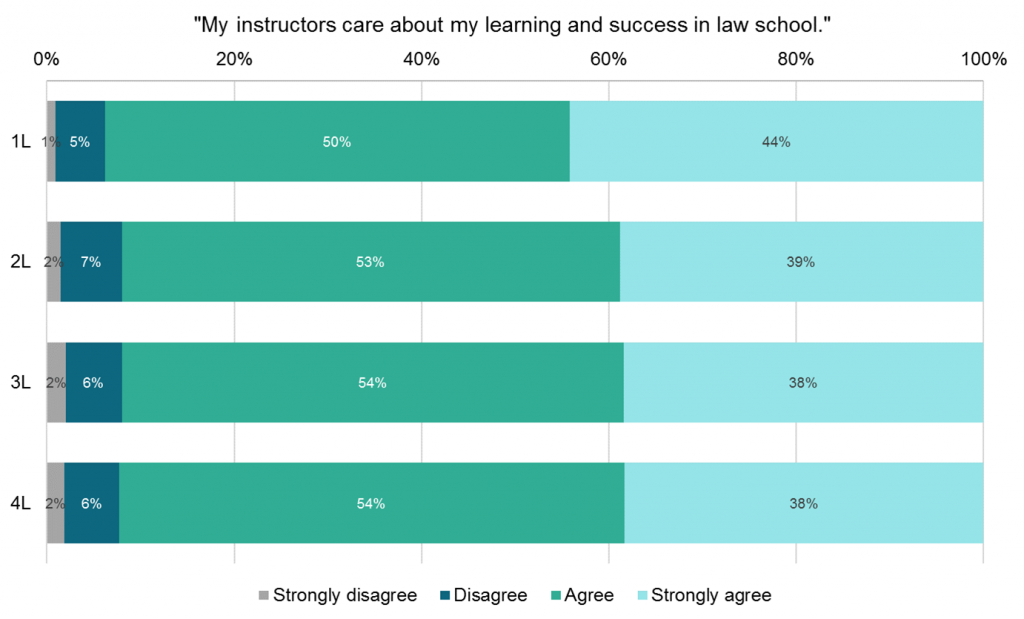
In 2018, a subset of 7,718 LSSSE respondents received the popular Learning Experiences and Professionalism (LEAP) module, which dives more deeply into students’ perceptions of both the law school community and their own readiness for legal practice. The vast majority of law school students (93%) agree or strongly agree that their instructors “care about my learning and success in law school.” Students in their first year of law school are most likely to strongly agree with this statement (44%), but overall there is not an appreciable drop in students’ sense that their instructors care about their law school experience across class years. Only 6-9% of students in any year of law school disagree or strongly disagree that their instructors care about them.
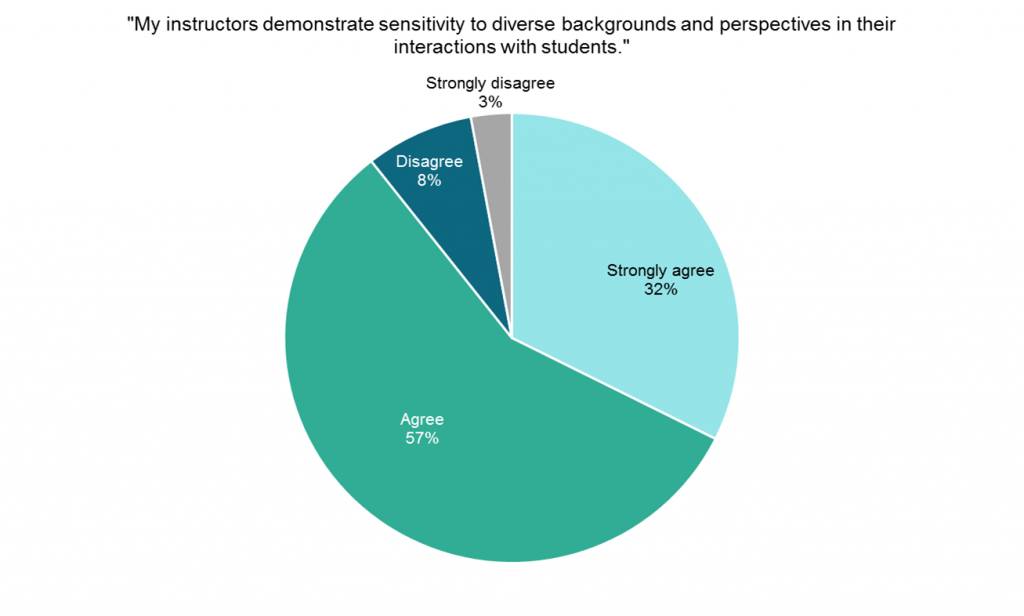
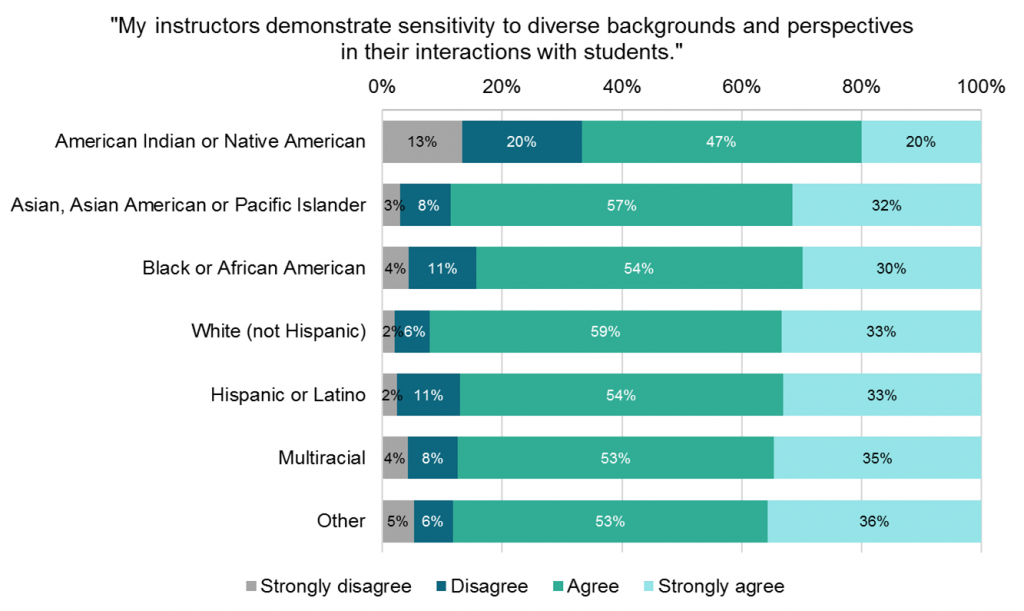
The LEAP module also asks whether student believe that their “instructors demonstrate sensitivity to diverse backgrounds and perspectives in their interactions with students." Among U.S. law students surveyed in 2018, 89% of students agree or strongly agree with this statement. There is some variation among students of different racial groups: 92% of white students agree or strongly agree that their instructors are sensitive to issues of diversity while only 67% of American Indian or Native American students share this viewpoint. This suggests that disparities still exist, particularly in how students of color perceive faculty attitudes toward diversity and how students from varying backgrounds are treated in the classroom.
A Tribute to Dan Bernstine
LSSSE 2016 Selected Results: Law School Activities
LSSSE 2016 Selected Results
This spring more than 35,000 law students at 72 law schools in the United States and Canada were asked to participate in the LSSSE survey. All JD or LLB students who attended the law school for at least one semester were invited to complete the web-based survey instrument. The average law school response rate in 2016 was 53%.
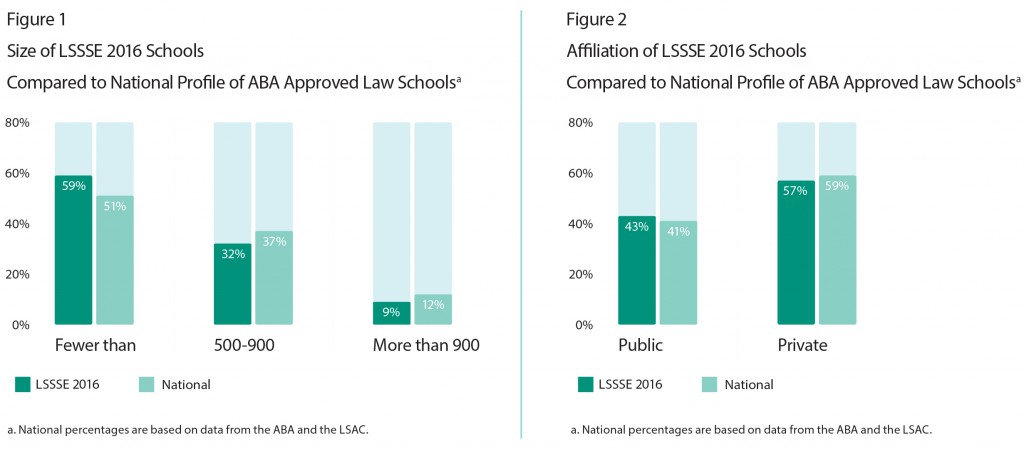
Figures 1 and 2 provide a comparison of LSSSE 2016 U.S. law schools to all ABA-approved law schools (“National”) with regard to the size of the student body and affiliation. The 2016 LSSSE cohort resembles that of the ABA-approved law schools in terms of size and affiliation.
Law School Activities
The LSSSE survey focuses on activities in which students participate—both inside and outside the classroom—that influence their learning and personal and professional development.
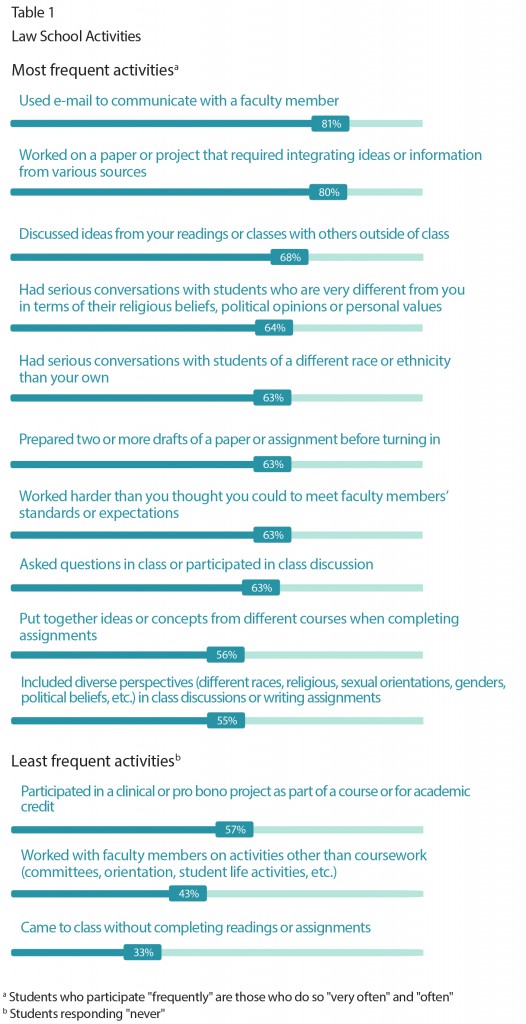
Table 1 identifies the most and least frequent activities in which students participated. The “most frequent” activities are those in which more than half of respondents participated “often” or “very often.” The “least frequent” activities are those in which more than 25% of students responded “never,” meaning that at least a quarter of students never participated in that activity during this academic year.
