Guest Post: Understanding the Nuances: Diversity Among Asian American Pacific Islanders
 Understanding the Nuances: Diversity Among Asian American Pacific Islanders
Vinay Harpalani
Henry Weihofen Professor & Associate Professor of Law
University of New Mexico School of Law
Asian American Pacific Islander (AAPI) Heritage Month recognizes the collective contributions of all AAPIs, but it is also an opportunity to move beyond the collective and highlight the nuanced differences between various AAPI groups. Lumping together all of these groups, without appreciation for their unique histories, experiences, and challenges, can obscure important differences, which in turn reinforces stereotypes. For example, although the “model minority” stereotype depicts AAPIs as high academic achievers from relatively privileged socioeconomic backgrounds, this is only accurate for a subset of the AAPI population. Higher education institutions in particular should highlight the vast diversity among AAPIs, as these institutions place a special value on understanding diversity and are also places where the model minority stereotype is propagated. Yet, when reporting applicant and enrollment data and other metrics, higher education institutions often simply classify their students as AAPI or even just “Asian.” And “Asian” as a singular label is particularly problematic, because it not only obscures differences between AAPI groups, but also conflates the different experiences of new immigrants and international students with those of second- and later generations of Asian Americans. Failure to distinguish these groups exacerbates another stereotype of AAPIs: that we are “perpetual foreigners”—always associated with their ancestral nations rather than with the U.S. Higher education institutions should thus disaggregate their data on AAPI students and be more nuanced in their assessments.
But therein lies the challenging part. There is no consensus on how to classify various AAPI groups or on which groups should be included together. Sometimes, people from different geographic areas of Asia are separated into smaller regional groups. East Asian Americans trace their ancestry to China, Korea, Japan, Mongolia, or Taiwan, while Southeast Asian Americans are descended from Thailand, Vietnam, Laos, Cambodia, Myanmar, Malaysia, Singapore, the Philippines, Indonesia, Brunei, or Timor Leste. South Asian (“Desi”) Americans trace their roots to India, Pakistan, Bangladesh, Sri Lanka, Nepal, Bhutan, Afghanistan, or the Maldives Islands. Pacific Islanders are descended from Micronesia, Melanesia, and Polynesia—three major island groups in the Pacific Ocean—and are sometimes classified separately from Asian Americans altogether. And although South Asian Americans are formally classified with as Asian Americans, many people do not think of them as such. AAPI student organizations on college campuses illustrate this well, as they can emphasize national, ethnic, or collective identities. In addition to AAPI, other terms include “Asian American”, “Asian Pacific American” (APA), “Asian/Pacific Islander” (API), Asian Pacific Islander Desi American (APIDA), and “Asian American Native Hawaiian Pacific Islander” (AANHPI).
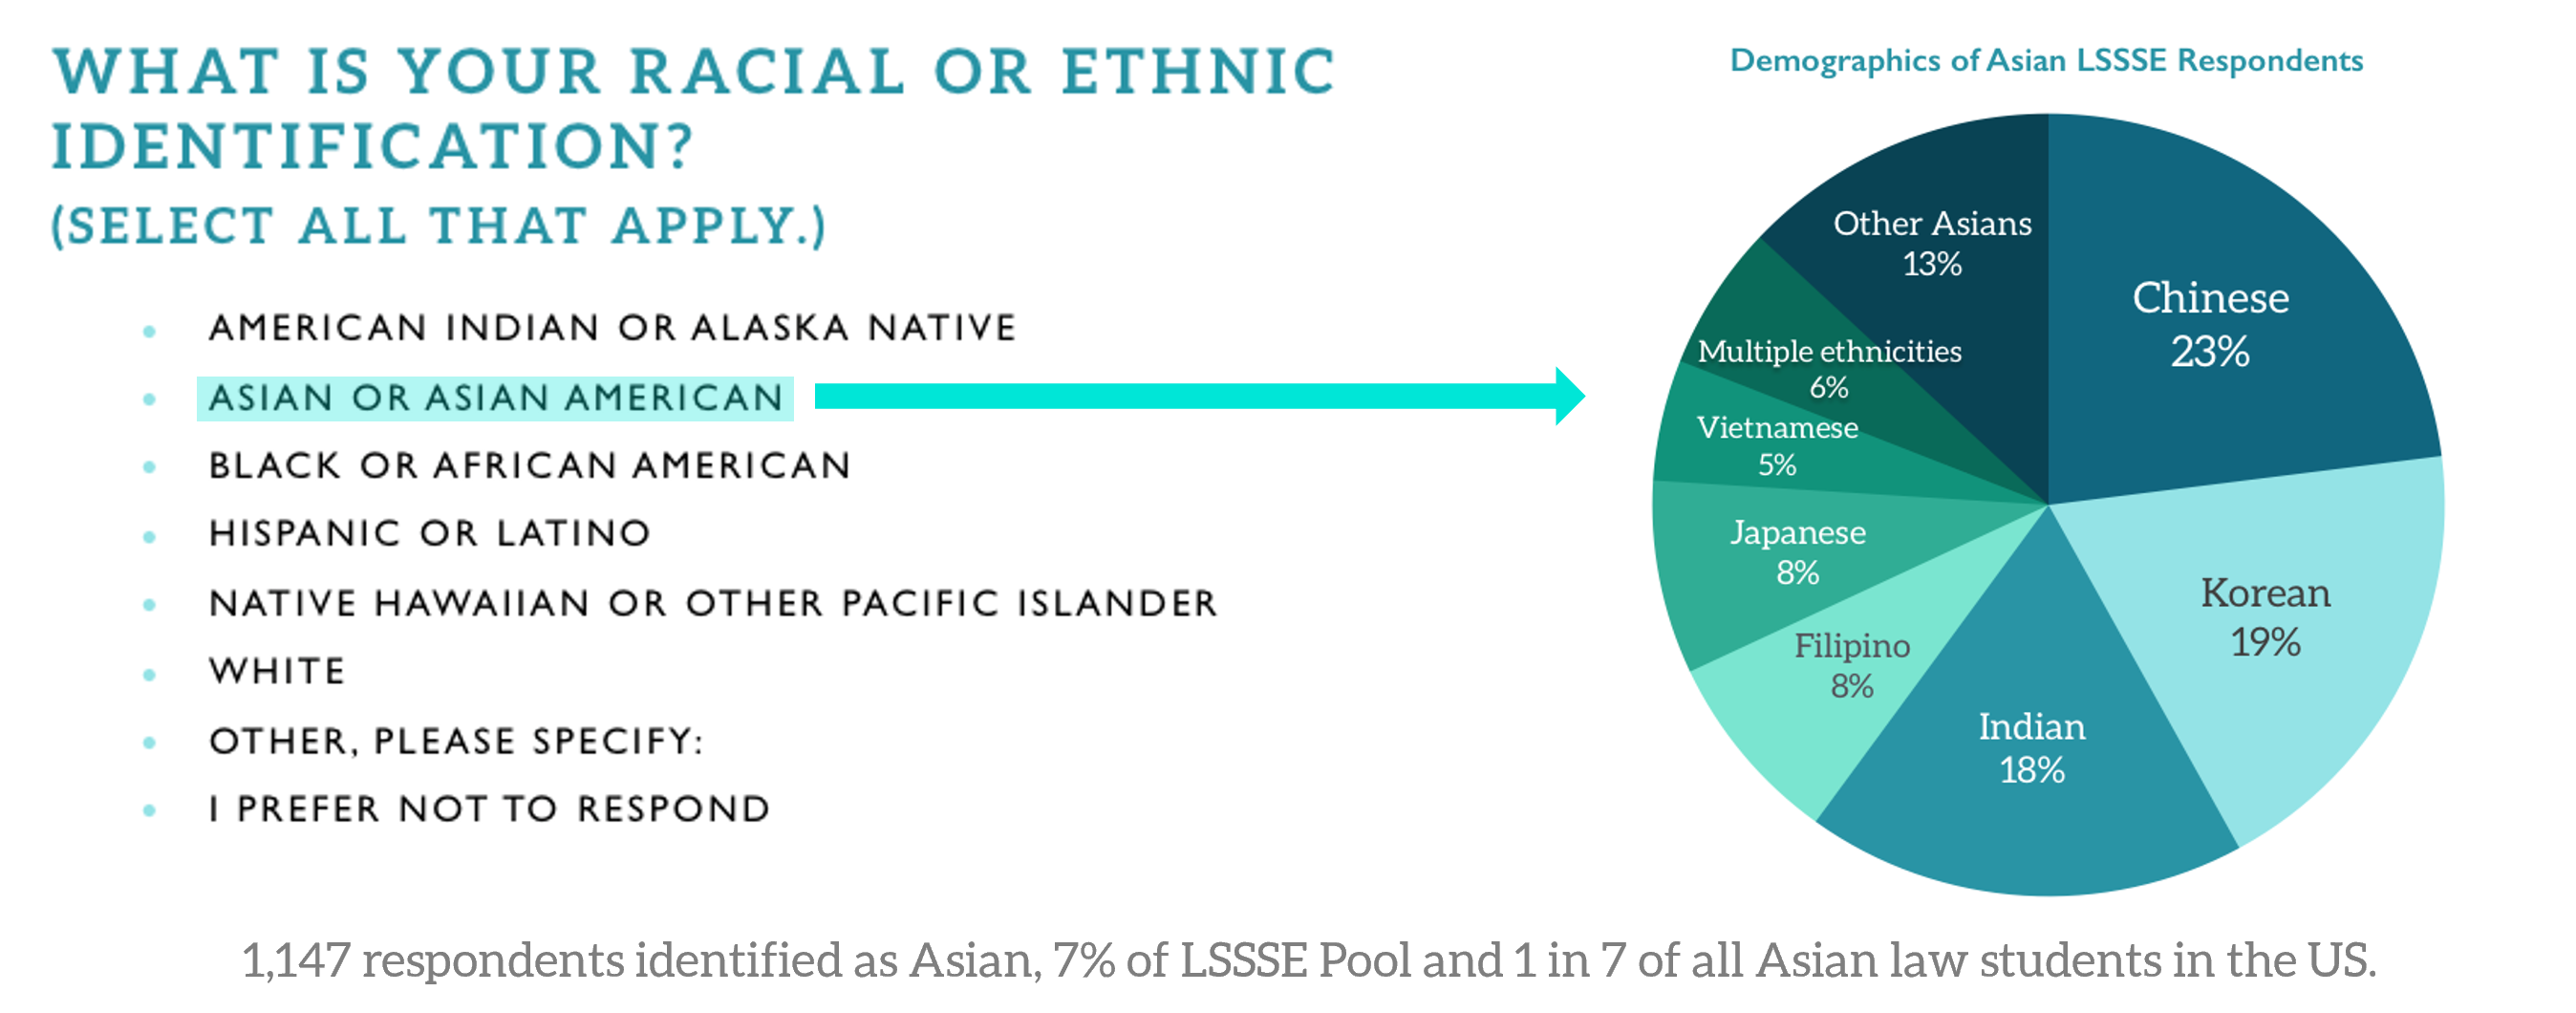
While the broad regional groupings may sometimes be appropriate, grouping by ethnicity or nation of ancestry may better capture the nuances—especially for relatively recent immigrants who left their homelands under particular circumstances, or for international students from particular countries. The Law School Survey of Student Engagement (LSSSE) collects data on diversity among AAPI law students, including differences between domestic and international students. Among its many metrics, LSSSE has disaggregated data on AAPI groups by their nation of ancestry. In its 2016 survey, LSSSE asked AAPI respondents about their ethnicity, and it analyzed this data in its 2017 report on AAPI law students. Overall, 1,147 respondents identified as AAPI: 7% of the total LSSSE pool. Six subgroups comprised at least 5% of the AAPI pool: Chinese (23%); Korean (19%); Asian Indian (18%); Japanese (8%); Filipino (8%); and Vietnamese (5%).
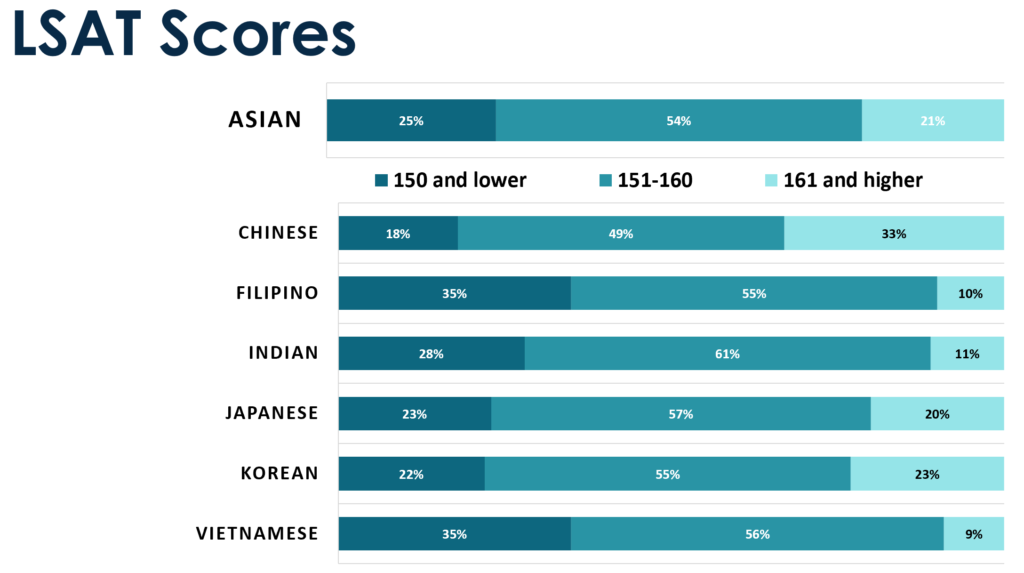
LSSSE’s analysis showed significant differences between these groups. For example, while 81% of Asian Indian American students in the sample had at least one parent with a bachelor’s degree, only 41% of Vietnamese American students did. And although AAPIs generally are stereotyped as high-achieving students, there were also differences in LSAT performance: 33% of Chinese American students in the sample scored 161 (83rd percentile) or higher, whereas only 9% of Vietnamese American students did. These differences may well be related to the immigration histories of these groups. Many Asian Indian and Chinese immigrants to the U.S. came via the occupational preferences of the Immigration Act of 1965, which favored those from educated, professional backgrounds. Conversely, many Vietnamese immigrants came as refugees after the Vietnam War and did not have the same resources. LSSSE’s data also indicate that compared to other AAPI groups, Vietnamese American students were more likely to be working in non-law related jobs, working more than 8 hours per week, and more likely to be providing care to others in their household while they were in law school.
The differences between international and domestic students can also be significant. Students born and/or raised in the U.S. are often socialized very differently than those born and raised in their ancestral nations, and these two groups often have different backgrounds, outlooks, and experiences. Rather than grouping together all students descended of a particular ethnicity, it is informative to distinguish between international and domestic students for each ethnicity. This may be challenging in some circumstances, given the small samples for some ethnicities. In LSSSE’s 2016 survey, 50% of students of Chinese descent were international students, while only 1% of Filipino students were, and proportions of other AAPI subgroups identifying as international students varied widely: 24% Korean; 14% Asian Indian; 8% Vietnamese; and 7% Japanese. Depending on the questions being explored, it may be prudent to focus only on domestic students for some analyses and only on international students for others, and it may be necessary to combine the two for some purposes.
When analyzing the demographics and the academic and social experiences of AAPI students, higher education institutions should follow LSSSE’s lead and disaggregate different groups, and also distinguish between international and domestic students. There is no single, ideal way to classify all of the groups: that will depend on the question and analysis at hand. But paying attention to the nuances will help to dispel the stereotypes that AAPIs are “model minorities” and “perpetual foreigners”—stereotypes that lump different AAPI groups together. And while we can and should celebrate the heritage and contributions of AAPIs as a whole, understanding the nuanced differences between groups is what will truly address the challenges faced by various AAPI communities.

Law Student Leisure Time, 2004-2020
Law students need time to rest and recharge. Amidst questions about how much time law students spend working, preparing for class, commuting, and participating in extracurricular activities, LSSSE also asks about time spent on leisure activities such as reading, relaxing and socializing, and exercising. Here, we look at trends in leisure activities from 2004 to 2020.
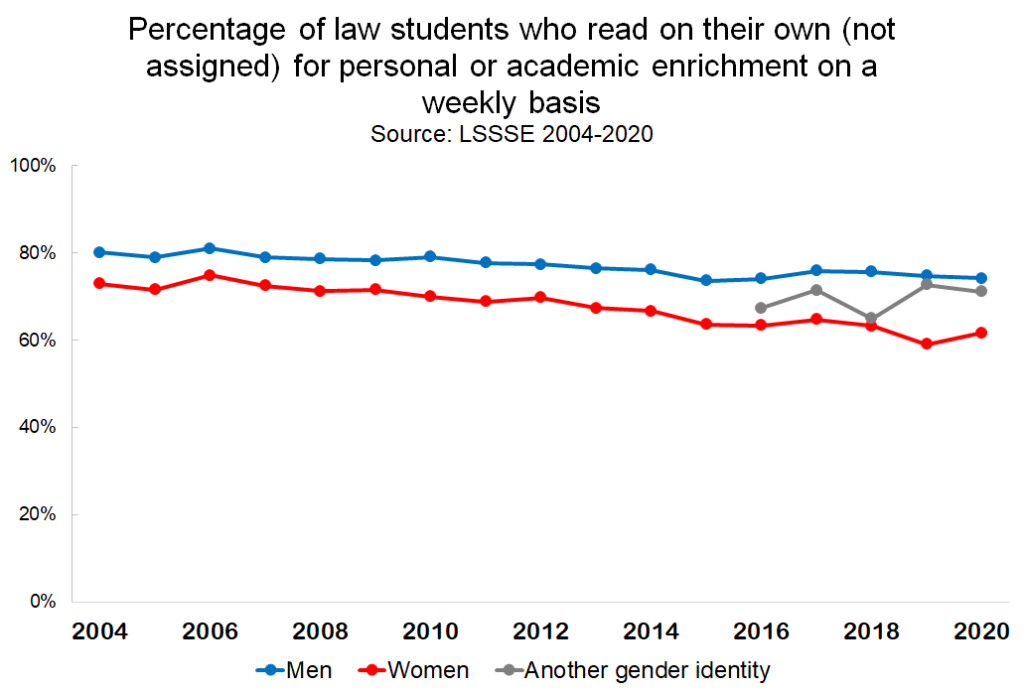
Most law students read on their own for personal or academic enrichment for at least one hour per week. However, the percentage of students who spend time on non-assigned reading has decreased gradually over the last decade and a half. Across every year studied, more men than women spend time reading for personal enrichment, and the gap has widened in the last few years. In 2004, 80% of men and 73% of women read on their own for at least an hour per week. In 2020, those numbers were 74% of men and only 62% of women.
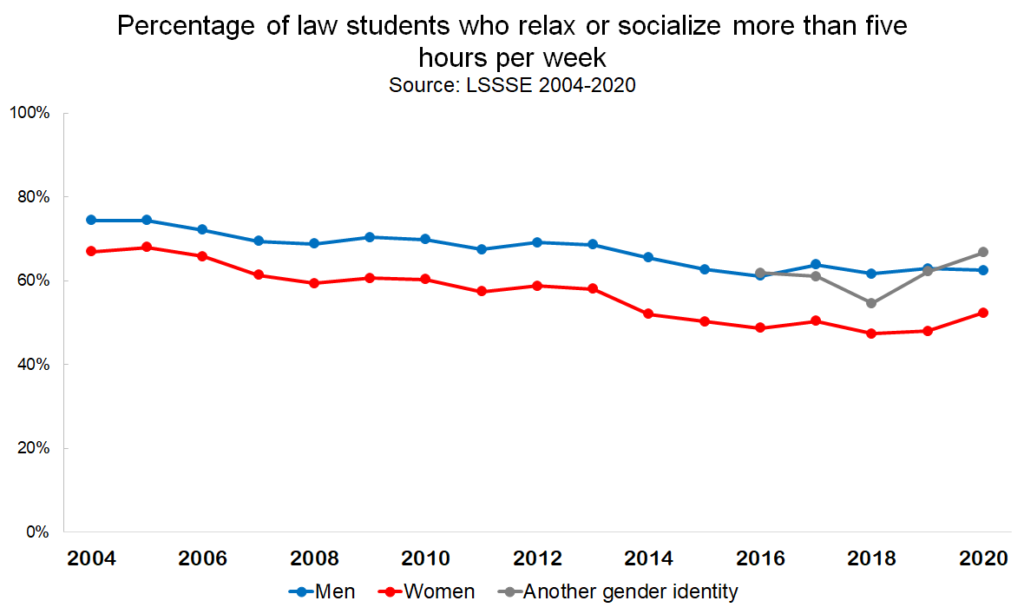
These trends toward a) decreasing time spent on leisure and b) more men than women engaging in leisure activities also hold true for time spent relaxing and socializing. The percentage of law students who relax or socialize for more than five hours per week (which is about an hour per day) has decreased from 71% in 2004 to 56% in 2020. Female law students are less likely to have time to relax. About half of female law students (48%) spent fewer than five hours per week relaxing and socializing in 2020, compared to only 37% of their male counterparts.
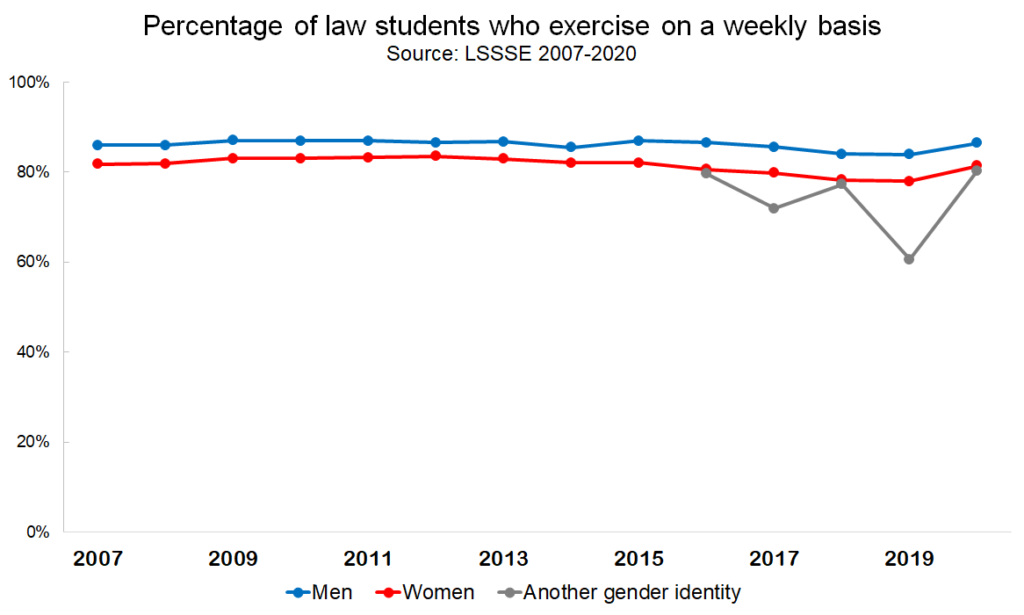
Fortunately, law students continue to make time for physical activity. Slightly more than eighty percent of law students exercise on at least a weekly basis, a number that has remained fairly constant since 2007, when the question was first added to the survey. Again, men are more likely than women to make time for exercise, although the disparity is not as great as it is for relaxing/socializing and for reading. This may suggest that when law students of all genders need a break from the sedentary work of reading and studying, they turn to physical activity to blow off some steam.