
Guest Post: What LSSSE Data Can Teach Us About Developing Our Law Students for Influence and Impact as Leaders
 Leah Teague
Chair, AALS Section for Leadership
Associate Dean and Professor, Baylor Law School
Leah_Teague@baylor.edu
https://traininglawyersasleaders.org/
In legal education we brag about the leadership positions our graduates hold. We tell our current students they too will be leaders someday. We expect that of them. But what are law schools doing to prepare students for those roles? You might be surprised to know that we do very little in law school to intentionally develop students’ leadership acumen and skills.
One might argue that all of legal education is training for leadership. Lawyers routinely use skills developed in law schools (such as critical thinking, legal analysis and advocacy) to help others. Attorneys also serve others by strategizing, persuading, and ultimately commanding the room, whether it be the boardroom, courtroom, or public arena. These are all foundational leadership skills. So why aren’t we being more intentional about preparing our students for the leadership roles we know they will someday assume?
Perhaps more importantly, why aren’t we teaching our students about the critical leadership roles played by lawyers throughout history and the urgent need for us to continue to do so? With precious little time spent in law school on the role of lawyers in society and increasing emphasis on law as a business and lawyers as legal technicians and specialists, fewer students leave law school with an understanding of our role as protectors of the rule of law, seekers of justice, wise counselors to individuals and businesses, and effective community leaders. While understandable, considering the economic and other competing pressures on lawyers’ time today, but how ironic – and concerning – considering that the majority of law school applicants still state in their personal statements their desire to go to law school to do good – to right wrongs, stand up for those without voice or power, or to make a difference in society.
Lawyers are small in numbers. We are less than one-half of one percent of the population in America. Yet, we are still mighty in impact and influence. But that might not continue. Some are concerned that our influence is already waning. For example, in the mid-19th century, almost 80% of members of U.S. Congress were lawyers. By the 1960s this dropped to under 60%. Currently, it is about 40%. Does having fewer leaders trained and experienced in strategic planning, advocacy, negotiation and civil discourse make a difference? Don’t we need more decision-makers at all levels who are trained in the law and who understand our obligation to society as guardians of democracy?
The question for us as legal educators is how do we better prepare our students for these important roles? To address this important issue, a new Section for Leadership was approved by the American Association of Law Schools. Our section reached out to Meera Deo and Chad Christensen at LSSSE to look at what we can learn from data already being collected by LSSSE. Chad shared his thoughts and findings during a webinar on November 5, 2019.
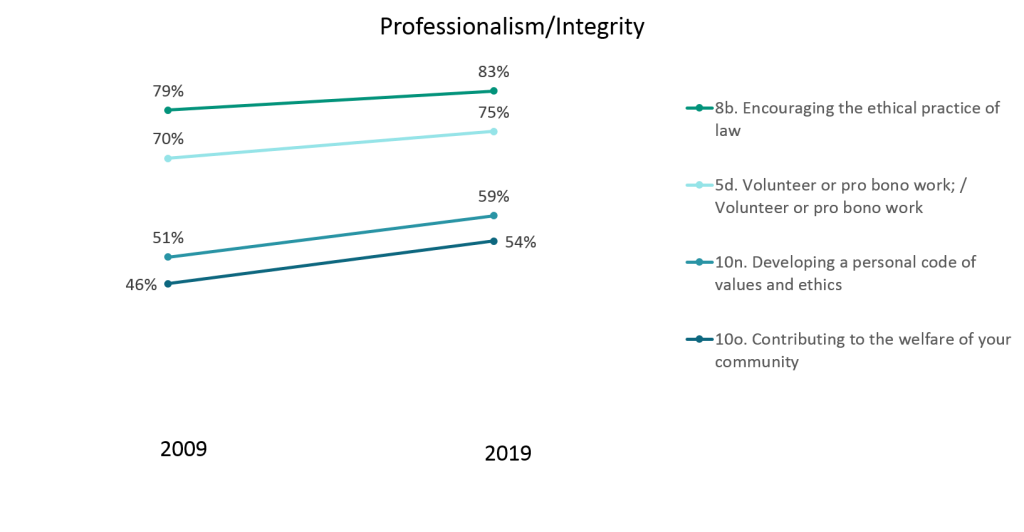
Chad began with an overview of work being done at the Holloran Center and others to look at professional competencies touted by a series of reports (such as MacCrate and Carnegie), desired by legal employers, and now mandated by ABA Standards 302(c) and (d). Many of these professional competencies are attributes of leadership and are included in the annual LSSSE instrument, including teamwork and collaboration, professionalism and integrity, self-directedness and cultural competencies. Chad shared the specific LSSSE questions related to these attributes and discussed the findings related to those questions from 2009 to 2019. The good news is that Chad’s charts showed improvement over time in almost all of those questions. (You can view the specifics of the LSSSE questions and the results related to these leadership attributes by downloading the Webinar Slides.)
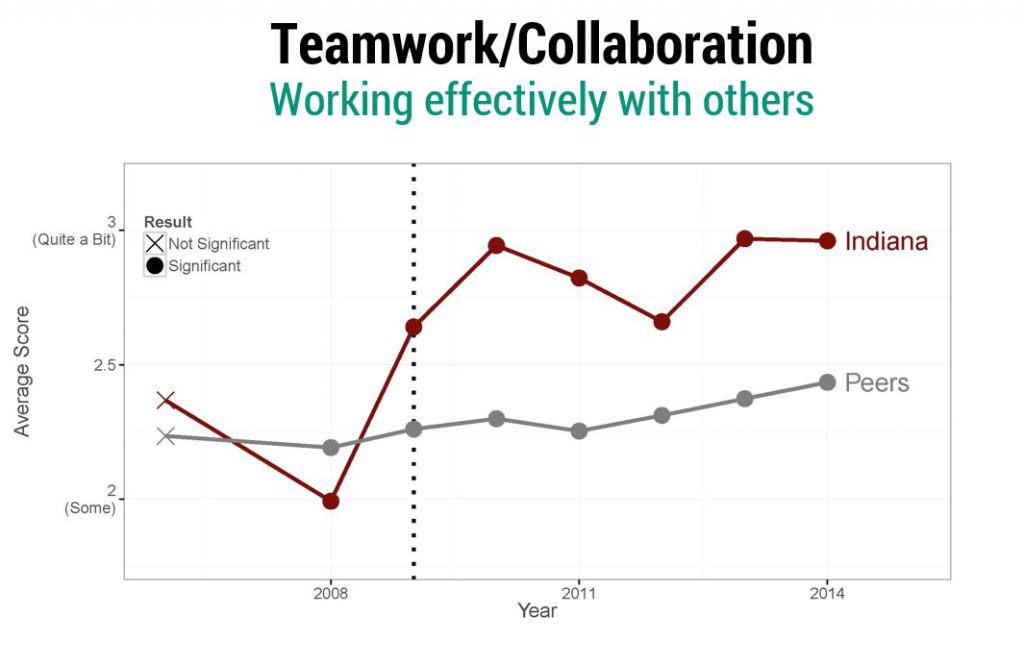
Even more exciting was the example he shared of LSSSE in action. In 2008, Indiana University (IU) 1Ls reported a significantly lower level of teamwork/collaboration than 1Ls at its peer schools. After introducing a first-year, legal professions course in 2009 that emphasized a goal-oriented, collaborative approach to legal work, IU experienced a significant improvement in that category.
 We believe the work at a growing number of law schools to introduce leadership development into their programming and curriculum not only will benefit students but also our profession and society. With that said, we are still figuring out how to be most effective and where to focus our efforts. We agree that the goal is to teach our students about the critical role lawyers play in society and our obligation as lawyers to serve, and then to better prepare them for the many opportunities they will have to serve. We want to help our students develop skills and traits that not only will enable them to be more effective in their professional roles but also will better equip them to make a meaningful difference in the lives of the individuals and organizations they serve. We also know that when they do so they will experience the kind of meaningful fulfillment that leads to satisfaction, contentment and happiness. Don’t we all want that for our students? For ourselves?
Our thanks to our co-sponsors for the webinar, LSSSE, AALS Section for Empirical Studies of Legal Education and the Legal Profession, and AALS Section on Law and the Social Sciences. We were excited to find more kindred spirits in our work! Our special thanks to Chad for his personal and vested interest in leadership development for lawyers. We look forward to further collaborations!
We invite all who are interested in introducing or expanding leadership development for law students at your school to join us. Feel free to contact me for more information at Leah_Teague@baylor.edu.
Guest Post: Getting to Excellent
 Evan Parker, PhD
Founder
Parker Analytics, LLC
Law school administrators operate in an environment that Dean Camille A. Nelson calls “relentlessly competitive” (See Nelson, “Towards Data-Driven Deaning,” LSSSE, August 22, 2019.) With students taking on sizable debt and an increasingly uncertain legal job market, it’s more important than ever that school administrators and faculty find ways to maximize the value of the law school experience.
What should they do to maximize the student experience? Conveniently, we can ask the students. More precisely, we can study students’ views of their law school experience as captured by the Law School Survey of Student Engagement (LSSSE). One question on the survey asks, “How would you evaluate your entire educational experience at your law school?” LSSSE participants respond with one of four options: Excellent, Good, Fair, or Poor. Using a statistical model, we can identify what factors most strongly differentiate students who say their experience in law school was “Excellent.”
As a rich professional survey with extensive coverage of student issues, LSSSE lets us examine a number of possible drivers of student satisfaction with law school, and highlight those factors that seem to matter the most. I view this as evidence into what students want—and thus, what administrators looking to maximize value should work hard to deliver.
In the analysis to follow, the factors that most strongly predict an “Excellent” response—the top “value differentiators”—are within reach of every law school administrator, albeit addressing these factors requires hard work. In broad terms, this student-driven data indicates that schools must do three things well:
- Build and sustain relationships among students, faculty and professional staff;
- Provide first-rate advising, career counseling and personal support; and
- Develop a broad curriculum that instills work-related knowledge.
Analyzing the Law School Experience
In this analysis, we’ll consider pooled LSSSE data over the 2009 to 2019 period. Figure 1 reports the four responses to the “entire experience” question, illustrating the distribution in percentage terms. Number of students per response is listed in parentheses.
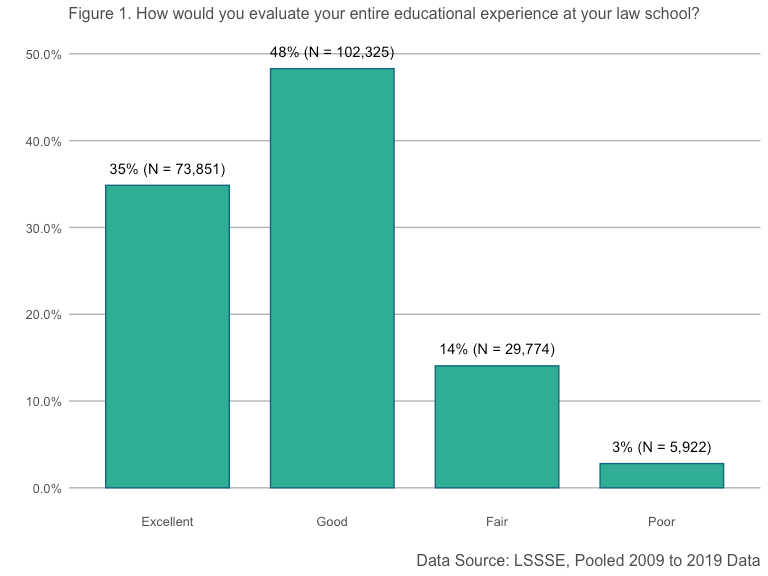
Over the past decade, about one-third of LSSSE participants said that their entire law school experience was “Excellent” (35%). A near-majority of students viewed their law school experience as “Good” (48%), and the remainder were less positive (Fair = 14%, Poor = 3%).
We can use a statistical model to identify factors that are most strongly associated with an excellent law school experience. With more than 60,000 complete survey responses (i.e., 60,000 surveys have complete data), it’s straightforward to perform an exploratory analysis—one that includes all possible inputs into the model using the standard battery of LSSSE questions, 2009 to 2019—82 questions in total.[1] In a sample this large, the fact the model returns information about “statistical significance” is not so meaningful, since most of the factors will reach a level of significance. What is meaningful in the model, however, is its ability to produce “appropriate comparisons” between types of students—comparisons which isolate the importance of specific LSSSE factors by revealing the expected differences in students’ perceived law school experiences. For the purpose of this post, we’ll compare student responses that are typical (at the mean) versus responses that are very favorable (+2 standard deviations above the mean), and all else equal.
Figure 2 reports the top 10 positive predictors of the law school experience response. Reported values are the model-based differences between a typical baseline response (mean) and a very favorable (mean +2 s.d.) Scanning across the items, the three general themes involve (1) interpersonal relationships, (2) perceptions of support, and (3) features of the law school curriculum.
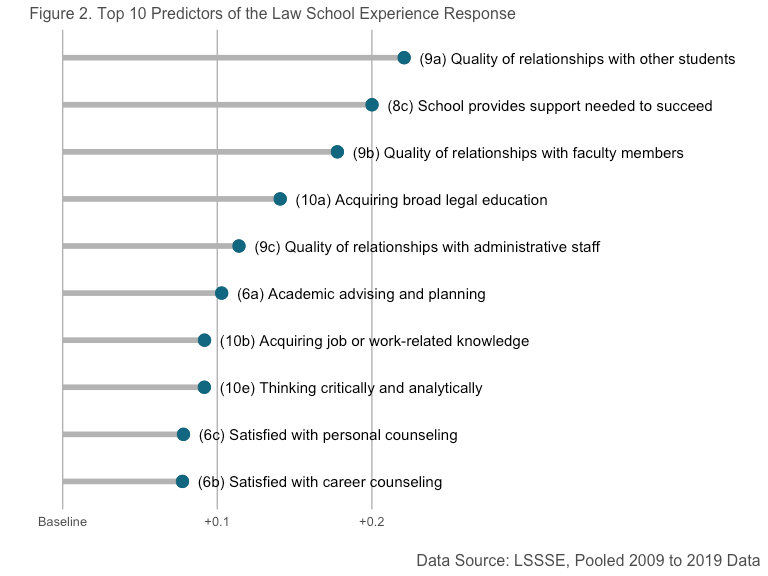
Quality of Relationships. The strongest positive differentiator is question (9a), the quality of relationships with other students. On this item, LSSSE asks students whether their relationships with other students are unfriendly or friendly using a 1 to 7 scale. So, at schools where students report above average friendliness among their peers, they are also more likely to view their law school experience as excellent. The same is true for relationships with faculty (9b) and administrative staff (9c), who are evaluated in terms of their availability and helpfulness, respectively.
Counseling and Support. A second set of factors that are strongly positively related pertain to students’ perceptions of support. This is the case in general per the importance of (8c), about the school’s ability to provide necessary support to succeed (1 = Very Little, 4 = Very Much). It’s also the case with academic advising (6a), personal counseling (6c), and career counseling (6b). Perhaps not surprisingly, the quality of a school’s advising and support functions matters a great deal to students.
Law School Curriculum. A final set of factors pertain to the nature of the curriculum. Students who most strongly believed they had acquired a broad legal education (10a) along with job or work-related knowledge (10b), and were taught to think critically and analytically (10b), were those who were most likely to give their law school an overall rating of “Excellent.”
What Students Want
With this short analysis, we see the value in leveraging the student perspective to focus the efforts of law school decision-makers. Students want to attend a school where relationships with other students, faculty and staff are both possible and enjoyable. For Deans, this might mean giving more weight to social functions and community-building activities than they have in the past. Students also want a sense their school is supportive, and working toward their success by providing resources to aid in both academic and personal decisions. They find greatest value when the law school curriculum equips them with skills they will need in practice. At the end of the day, “the ask” seems reasonable on its face.
___
[1] The model is a linear mixed effects regression that accounts for law school class year, survey year, and unique law school effects. More sophisticated models are certainly possible (e.g., an ordinal response model), yet in my exploration I’ve found that the conclusions shared here end up the same regardless.
Guest Post: A Glimpse Beyond the Numbers
 Louis M. Rocconi, Ph.D.
Assistant Professor, Educational Psychology and Counseling
The University of Tennessee, Knoxville
As a former LSSSE research analyst (2011-2016), I am excited to write a guest blog post for a project that means so much to me. In this blog post, I will discuss a recently published article in which my colleagues and I used LSSSE data to examine diverse interactions in law school. The full article is available in the Journal of Diversity in Higher Education. [1]
A concerted effort has been devoted to diversifying law schools. However, the focus has been almost exclusively on increasing the structural diversity of the student body (i.e., having representative numbers of a diverse population) rather than increasing the frequency and quality of interactions among students from diverse backgrounds. Research shows that meaningful interactions among students from diverse backgrounds foster many educational and psychological benefits such as reductions in prejudice, appreciation for others’ perspectives, improved critical thinking and self-confidence, greater connection to the institution, greater civic engagement, and enhancement of leadership skills. [2] Understanding how the student experience may foster diverse interactions in legal education will help law schools meet the needs of an increasingly diverse student population and society.
The concept of student engagement provides a useful
framework to explore how students’ activities and perceptions shape students’
contact with diverse others. Using data from the 2014 and 2015 administration
of LSSSE, we set out to investigate the types of activities and experiences in
law school that relate with more frequent diverse interactions. Diverse
interactions were operationalized using three items on LSSSE that asked
students how often they:
(1) had serious conversations with students of a
different race or ethnicity;
(2) had serious conversations with students who are
different from them in terms of their religious beliefs, political opinion, or
personal values; and
(3) included diverse perspectives (different races,
religions, sexual orientations, genders, political beliefs, etc.) in class
discussions or writing assignments.
We examined a number of student characteristics (e.g.,
gender, race-ethnicity, age, enrollment status), activities in law school
(e.g., interaction with faculty, higher-order learning, internship, pro bono
work, law journal, moot court, student organization), perceptions of the law
school environment and relationships with other students, as well as
characteristics of the law school (e.g., structural diversity, selectivity, public/private,
enrollment size).
Our findings (Table 1) were encouraging for law schools. Increased diverse interactions were not only related to structural diversity but to programmatic factors that law schools can influence such as creating a supportive law school environment or encouraging student-faculty interactions. Bringing about diverse interactions requires intentional and well-designed effort on the part of the institution. Fostering these various opportunities is one way in which law schools can encourage diverse interactions.

One of the strongest relationships involves
student-faculty interactions. Students who reported more frequent interactions
with faculty also reported greater diverse interactions. Law schools can exert
some influence over certain aspects of student-faculty interaction by implementing
policies that encourage student and faculty involvement both in and out of the
classroom (e.g., mentoring programs). Our findings also illustrate that diverse
interactions were related with students’ perceptions of a supportive law school
environment. Faculty and administrators can assist in creating a supportive
environment by providing students the academic and personal support they need
to be successful. We also found that creating opportunities for students to
interact with faculty and peers in collaborative ways, particularly pro bono
service and through student organizations, were related with increased diverse
interactions.
On the other hand, we found a negative relationship between participating in the law journal and diverse interactions. The lack of diversity among law journal staff could be one reason for this finding in addition to the competitive and insulated nature of law journals. This notion is consistent with the idea that competitive environments can discourage intergroup contact and minimize the benefits of diverse interactions.[3]
More research is needed to better understand the
particular ways in which interactions among diverse groups operate in law
school. Are law students who interact more frequently with a diverse set of
peers better able to apply what they have learned in class? Are these students
better prepared to work with a diverse set of clientele? Understanding diverse
interactions will help law schools meet the needs of an increasingly diverse
student body and better prepare students to meet the needs of the diverse array
of clients these future lawyers will represent.
Finally, I would like to acknowledge my co-authors without whom this research would not have been possible: Aaron Taylor, Heather Haeger, John Zilvinskis, and Chad Christensen.
_______
[1] Rocconi, L.M., Taylor, A.N., Haeger, H., Zilvinskis, J.D., & Christensen, C.R. (2019). Beyond the numbers: An examination of diverse interaction in law school. Journal of Diversity in Higher Education, 12(1), 27-37. http://dx.doi.org/10.1037/dhe0000080
[2] see for example: Bowman, N. A. (2011). Promoting participation in a diverse democracy: A meta-analysis of college diversity experiences and civic engagement. Review of Educational Research, 81, 29–68. Nelson Laird, T. F. (2005). College students’ experiences with diversity and their effects on academic self-confidence, social agency, and disposition toward critical thinking. Research in Higher Education, 46, 365– 387. Parker, E. T., III, & Pascarella, E. T. (2013). Effects of diversity experiences on socially responsible leadership over four years of college. Journal of Diversity in Higher Education, 6, 219–230. Pascarella, E. T., Martin, G. L., Hanson, J. M., Trolian, T. L., Gillig, B., & Blaich, C. (2014). Effects of diversity experiences on critical thinking skills over 4 years of college. Journal of College Student Development,55, 86–92.
[3] Pettigrew, T. F., Christ, O., Wagner, U., & Stellmacher, J. (2007). Direct and indirect intergroup contact effects on prejudice: A normative interpretation. International Journal of Intercultural Relations, 31, 411–425. Pettigrew, T. F., Tropp, L. R., Wagner, U., & Christ, O. (2011). Recent advances in intergroup contact theory. International Journal of Intercultural Relations, 35, 271–280.

LSSSE Announces New Board Members (9/28/2018)
The Law School Survey of Student Engagement Announces New Board Members
The Law School Survey of Student Engagement (LSSSE) is proud to announce that Ajay K. Mehrotra, Executive Director of the American Bar Foundation (ABF) and Professor of Law at Northwestern University’s Pritzker School of Law, and Camille A. Nelson, Dean of American University Washington School of Law, and Kellye Y. Testy, President and Chief Executive Officer of the Law School Admission Council (LSAC), have joined the LSSSE National Advisory Board.
“We are delighted to welcome Ajay, Camille, and Kellye to LSSSE’s National Advisory Board, “ said, Meera E. Deo, Director of LSSSE. “The role of the Board is to help shape the strategic direction for LSSSE using an approach that applies effective educational practices to law school improvement. Their insights into the world of legal education, both its history and the modern law school environment, will provide an important perspective to our work and to the future of the project.” Bryant Garth, Chair of the LSSSE National Advisory Board and Vice Dean and Distinguished Professor of Law at UC Irvine School of Law agreed, noting: “LSSSE has become one of the leading organizations in legal education. It is central both to research agendas and to improving legal education. The expertise and perspective that these stellar legal educators bring will be invaluable for LSSSE’s future.”
 Ajay Mehrotra was appointed director of the ABF in 2015. Prior to his appointment, he was Associate Dean for Research, Professor of Law, and the Louis F. Niezer Faculty Fellow at Indiana University’s Maurer School of Law. From 2007-2011, he was Co-director of the Indiana University Center for Law, Society & Culture, where he was a university-wide leader on interdisciplinary approaches to the study of law. He was also an adjunct professor of history at Indiana University and an Affiliated Faculty member of the Lin & Vincent Ostrom Workshop on Political Theory & Policy Analysis. Mehrotra's scholarship and teaching explores legal history and tax law, with a focus on law and political economy in historical and comparative perspective.
“It's a great honor and pleasure to be on the LSSSE Board. The unique and insightful data gathered by LSSSE has been invaluable not only to researchers and law schools, but to everyone concerned about the legal profession. I look forward to working with the other Board members and the LSSSE research team in furthering the organization’s mission,” said Mehrotra.
 Kellye Testy joined LSAC in July 2017 after serving as the 14th dean and first woman to lead the University of Washington School of Law. A prolific scholar, outstanding teacher, and experienced administrator, Testy is known throughout academic and legal communities for her dedication to the rule of law and commitment to justice and equality. Named the nation's second most influential leader in legal education in 2017 by the National Jurist, Dean Testy served as the president of the American Association of Law Schools (AALS) in 2016, with the presidential theme "Why Law Matters," focusing on how the law plays a critical role in setting the foundation for justice and human prosperity.
“Law students hold the future of justice in their hands and minds, and it is the responsibility of everyone in the legal education community to work together to help them succeed,” remarked Testy. “I support the efforts of LSSSE to understand the needs of law students and improve their law school experience, and I am honored and delighted to join the LSSSE National Advisory Board.”
 Camille Nelson has long been an outstanding member of the law community. Prior to joining American University as Dean of the Washington College of Law, she was a litigator at a large Canadian law firm, clerk for the Supreme Court of Canada, Professor of Law at Hofstra Law School, Dean's Scholar in Residence and Visiting Professor at Washington University School of Law, and Dean of Suffolk University Law School. A widely published scholar and dynamic speaker, Nelson is an expert on the intersection of critical race theory and cultural studies. She serves on the Executive Committee of the Association of American Law Schools, the Governing Council for the American Bar Association Center for Innovation, and the Advisory Board of the Institute for the Advancement of the American Legal System.
“It is an immense honor to join the Advisory of Board of LSSSE,” said Nelson. “I am particularly impressed with LSSSE as a student-centered and focused provider of innovative research support and services which have attracted national and international recognition. I look forward to supporting their mission of helping law schools proactively assess, and thereby support, the experiences of their students."
Media Contact
Chad Christensen
812.856.5823
chachris@indiana.edu

Diversity Within Diversity: The Student Experience (Part 3)
This final installment based on the Report, Diversity Within Diversity: The Varied Experiences Of Asian And Asian American Law Students, highlights findings related to the law student experience.
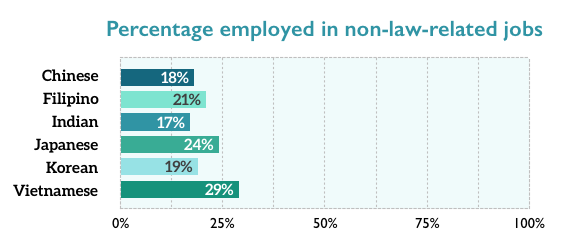
LSSSE asks respondents about how they spend their time, in the context of their studies and beyond. Employment can be a very useful part of the law school experience if it has relevance to the practice or study of law. Some employment, however, is motivated by necessity, and not necessarily a desire to foster one’s professional development. LSSSE respondents are asked to stipulate whether employment is law related or non-law-related.
Among the six subgroups, Vietnamese respondents were most likely to report being employed, with the disproportions being particularly apparent in non-law-related jobs. They were also most likely to report working eight or more hours per week in either setting. The relatively high proportions of employment, particularly in non-law-related jobs, raises questions about the role of financial pressures among Vietnamese law students.
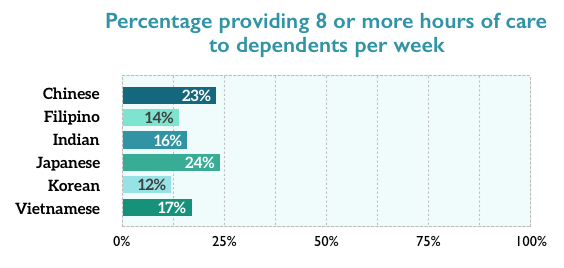
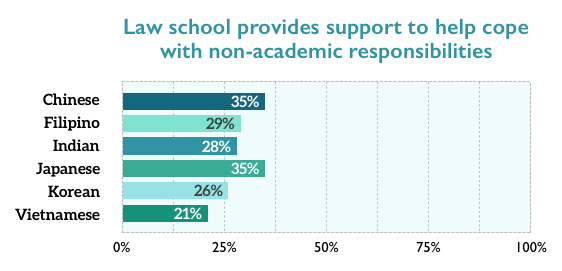
Vietnamese respondents were also most likely to report spending time providing care to dependents residing in the same household, with Vietnamese and Japanese respondents reporting the largest time commitment. Vietnamese respondents were least likely to report feeling as if their law school helped them cope with their nonacademic responsibilities.
Asian respondents overwhelmingly reported favorable relationships within their law school, but Vietnamese respondents were noticeably more likely to state that other students were “unfriendly and unsupportive.” Korean respondents had the least favorable perceptions of their professors, with less than half harboring the most intensely positive feelings.
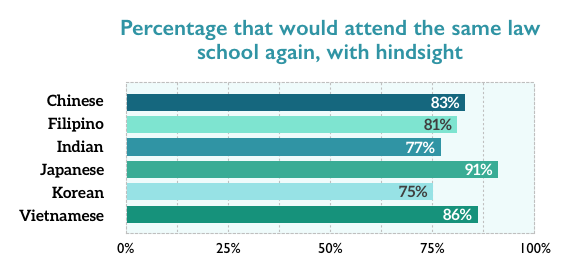
Vietnamese respondents were least likely to report feeling as if they were acquiring a broad legal education, with one-in-5 expressing an unfavorable perception. In that vein, almost one-quarter rated their law school experiences fair or poor, again the highest proportion. Interestingly, given these perceptions, 86% of Vietnamese respondents stated that they would probably or definitely attend the same law school again, if given the benefit of hindsight. Only Japanese respondents had a higher proportion expressing this ostensibly favorable assessment. On the other hand, Korean respondents were least likely to state that they would attend the same law school again, with 1-in-4 stating expressing regret.
Conclusion
The experiences of Asian subgroups within the LSSSE pool varied, belying the prevailing assumptions about the Asian monolith. Their backgrounds, informed in large part by immigration patterns, differed markedly. There were vast disparities in expected law school debt. There were differences in how they spent their time, and how they perceived the law school experience. In the end, the distinctive aspects of each group manifested. As law schools work to ensure that their programs benefit all students, the experiences of subgroups within our broad classifications (racial/ethnic and others) should also be considered.
(Photo courtesy of Southwestern Law School)

Diversity Within Diversity: Scholarships and Student Loan Debt (Part 2)
This second installment based on the Report, Diversity Within Diversity: The Varied Experiences Of Asian And Asian American Law Students, highlights findings related to scholarships and student loan debt.
Scholarships
Given the outsized role that the LSAT plays in determining who goes to law school, where they go, and how much they pay, the trends suggest that Filipino and Vietnamese applicants are much less likely to gain admission and less likely to receive lucrative scholarships, even if they receive an admission offer. As explained in the LSSSE report, Law School Scholarship Policies: Engines of Inequity, the overall trends routinely highlight a strong link between LSAT score and receipt of so-called merit scholarships.
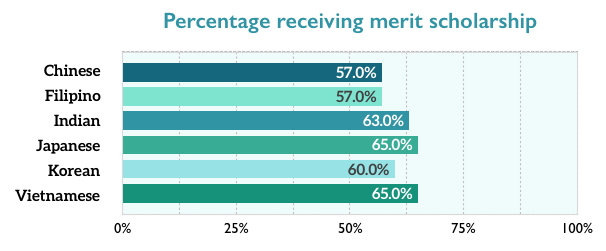
But those linkages were not observed as strongly among the Asian subgroups. Sixty-five percent (65%) of Vietnamese respondents reported receiving merit scholarships, the highest proportion, along with Japanese respondents. LSAT score differences suggest that Chinese respondents would have received these scholarships in the highest proportions; but their rate of 57% was tied with Filipino respondents.
International students are sometimes ineligible to receive merit scholarships awarded by law schools. But immigrant status does not explain why receipt of merit scholarships (from all sources) among Chinese respondents seemed depressed. Chinese immigrants were only slightly less likely to report having received a merit scholarship of some type than Chinese Americans – 55% vs. 56%. For many reasons, the LSAT score should not be the primary determinant of who gets a merit scholarship; but it commonly is. Therefore, the trends among Asian respondents are somewhat of a riddle.
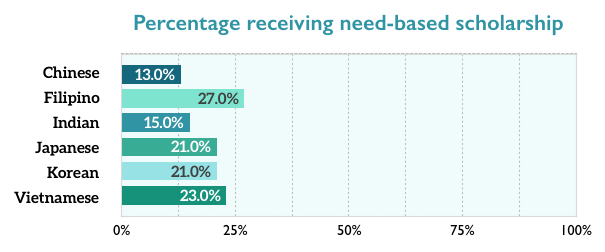
The need-based scholarship awarding trends took a more predictable track, with Filipino respondents (27%) mostly likely to have received this aid, followed by Vietnamese respondents (23%). Chinese respondents (13%) were least likely to report receiving this aid, a possible artifact of the high proportion of international students.
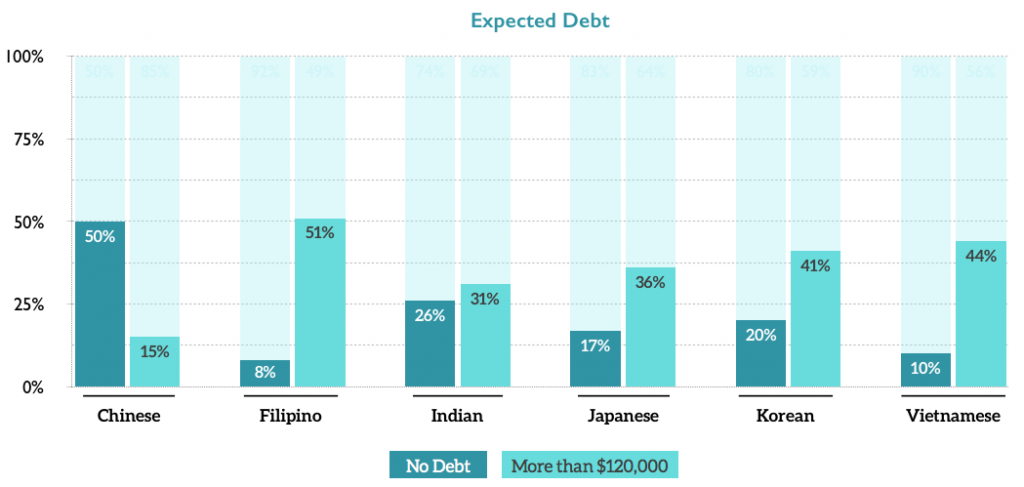
Student Loan Debt
The LSSSE Survey asks respondents to estimate the amount of debt they expect to incur from law school. Half of Chinese respondents expected no law school debt – the highest proportion. Once again, this trend can be explained by the high proportion of international students among the Chinese subgroup. International students do not qualify for U.S. government student loans and, therefore, are much less likely to report expecting student loan debt.
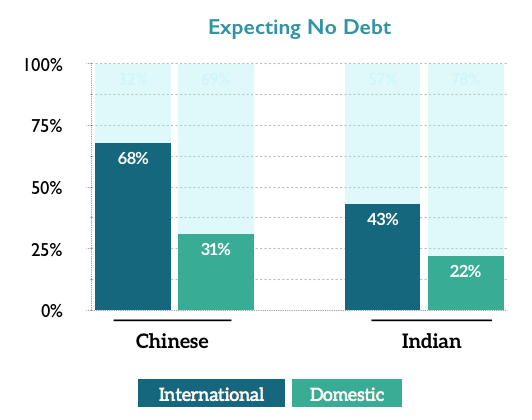
Among Chinese and Indian respondents, international students were more than twice as likely to expect no student loan debt than domestic students. Less than 10% of Filipino and Vietnamese respondents expected to leave law school debt-free. Half of Filipinos expected to owe more than $120,000, compared to 15% of Chinese respondents.
And at the highest end of the spectrum, Filipinos were about seven times as likely to expect more than $200,000 in law school debt than Chinese respondents, 14% to 2%.

Diversity Within Diversity: The Varied Experiences Of Asian And Asian American Law Students (Part 1)
This is the first installment in a series based on data from the 2016 LSSSE survey administration and the LSSSE Report, Diversity Within Diversity: The Varied Experiences Of Asian And Asian American Law Students.
In 2016, LSSSE, for the first time, asked respondents identifying as Asian or Hispanic/Latino to also identify an ethnic subgroup. This report presents various disaggregated data for the Asian subgroups.
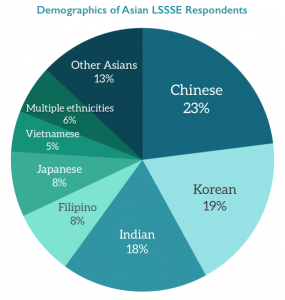
The data presented in this Report comes from the LSSSE Survey responses of more than 16,000 students at 67 U.S. law schools. A total of 1,147 LSSSE respondents identified as Asian, comprising 7% of the LSSSE pool – and about 1-in-7 of all Asian law students in the United States.
Chinese respondents were the largest Asian subgroup (23%), followed by Koreans (19%) and Indians (18%). There were six subgroups that comprised at least 5% of the pool of Asian respondents.
Comprising 81% of all Asian respondents, this report will center on these six groups. About 6% of respondents identified with multiple Asian subgroups or with an Asian subgroup and another race; their data is excluded from the subgroup analyses, as are data for respondents who identified with groups comprising less than 5% of the pool. The data presented in this report provide a glimpse into the experiences of these law students over the course of one school year.
Socioeconomic background
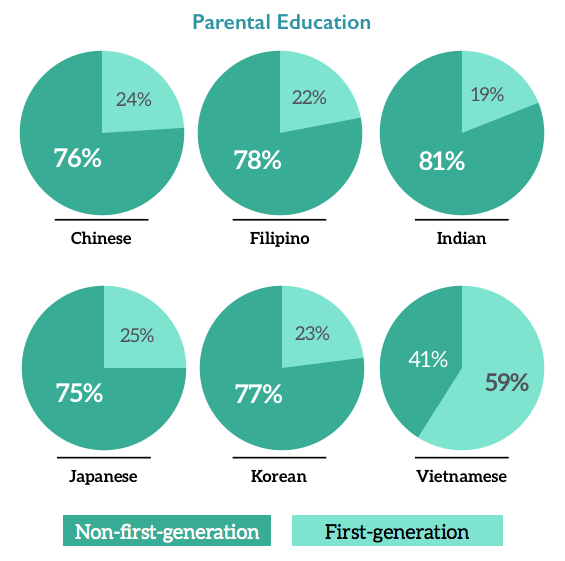
Socioeconomics loom large in the ascent to law school, and law students tend to be a relatively affluent group. The LSSSE Survey attempts to get a sense of the socioeconomic backgrounds of respondents by asking about the education levels of their parents. Researchers often use parental education as a proxy for socioeconomic status. The linkages between higher education and income dictate that students with college-educated parents tend to come from more affluent backgrounds. Respondents with at least one parent possessing a BA/BS or higher comprised more than 75% of each subgroup, with one glaring exception: Vietnamese respondents.
Only 41% of Vietnamese respondents had at least one parent with a BA/BS or higher. Put the other way, about 6-in-10 Vietnamese respondents were among the first-generation in their family to graduate from college. These trends align with the overall educational attainment figures cited earlier, and can be explained in large part by different immigration histories and patterns among groups.
Immigrant Status
Half of Chinese respondents reported being international students. This was the highest proportion by far; the second-highest being among Indian respondents (24%). The lowest proportion (1%) was among Filipino respondents.
LSSSE Annual Results 2016: Socioeconomic Background and Economic Inequity (Part 3)
This is the third installment in a series of five posts based on data from the 2016 LSSSE survey administration and the 2016 Annual Report. The LSSSE 2016 Annual Report highlights inequities in scholarship policies and the associated consequences for student loan debt.
Equity is often assumed to be the same as equality, but they are different. Equity accounts for differences in ways that equality does not. In fact, the insensitivity of equality-based frameworks can exacerbate inequity through a dichotomous compounding of privilege and disadvantage. Merit scholarship programs provide a classic example of this phenomenon. Merit scholarships tend to be awarded through equality frameworks, in which similar criteria are applied to all applicants. These criteria most often revolve around standardized test scores and other factors that track closely to non-merit indicators, such as socioeconomic status. In the end, wealth and privilege become proxies for merit, a conflation that results in financial windfalls and further advantages for applicants least in need of such assistance.
We used parental education as a proxy for a respondent’s socioeconomic background in order to compare debt and scholarship trends. Framing socioeconomic background based on parental education is common in the research literature and is rooted in the fact that children of college-educated parents are more likely than other children to come from relatively affluent backgrounds. We classified our respondents into three parental education groupings:
FG-HS: “first-generation” respondents for whom neither parent has more than a high school diploma
FG-SC: “first-generation” respondents for whom at least one parent has some college experience, but no bachelor’s degree
N-FG: “non-first-generation” respondents for whom at least one parent has a bachelor’s degree or higher
The debt burden is highest among respondents for whom neither parent has more than a high school diploma. Almost half of these “first-generation” respondents (FG-HS) expected to owe more than $100,000, compared to 34% to non-first-generation (N-FG) respondents.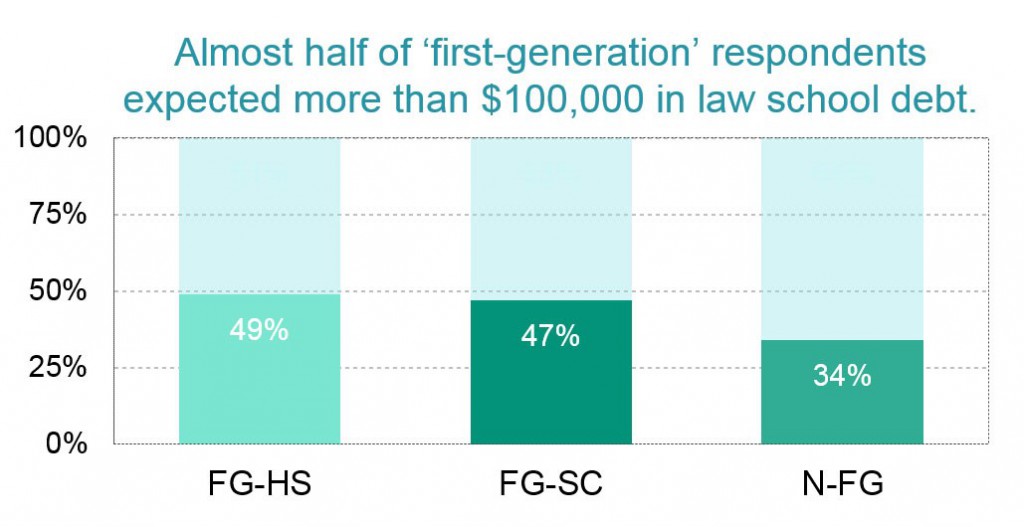
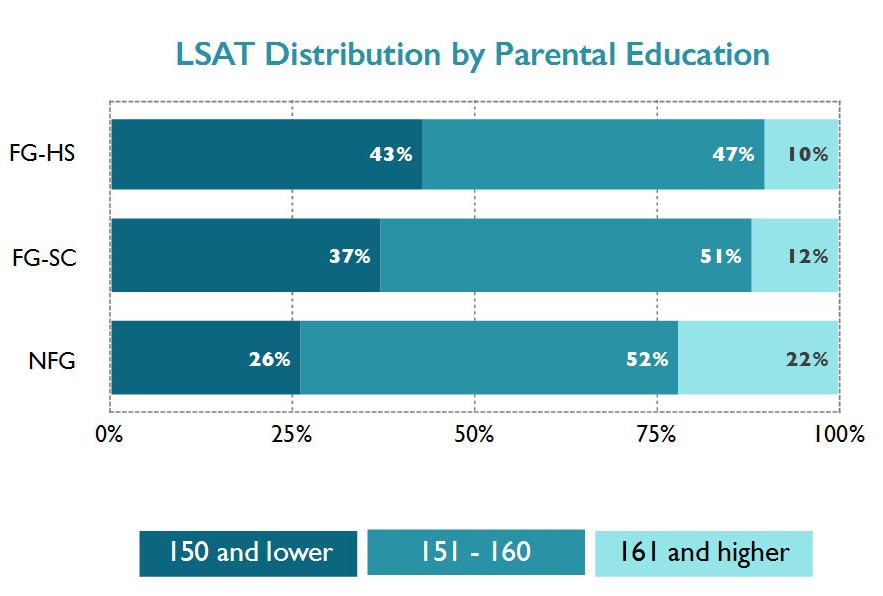
In our sample, N-FG respondents – presumably the most privileged group – were most likely to have received a merit scholarship; FG-HS respondents – the least privileged – were least likely. Like the disparities in scholarship awards among participants with different racial and ethnic backgrounds (see previous post), the disparities among students with differing parental education levels align with LSAT score trends. Forty-three percent of FG-HS respondents had LSAT scores below 151, compared to about a quarter of N-FG respondents. At the other end, 22% of N-FG respondents scored at 160 or higher, compared to just 10% of FG-HS respondents
The question is often posed: Why shouldn’t the LSAT be a primary criterion for determining who gains admission to law school and who receives scholarships? The most basic answer to this question is that the LSAT is designed to be a predictor of first-year law school performance and, in fact, explains roughly 38% of the variance in first-year law school grades. But the LSAT is even less reliable in predicting longer-term outcomes, such as bar exam performance and career success. Despite these limitations, the LSAT remains a central factor in most admissions and scholarship awarding decisions. It is an unfortunate and uncomfortable truth that a large number of admissions and merit scholarship decisions are rooted in a fundamental misuse of the LSAT. The heavy reliance on LSAT scores to award scholarship money exacerbates disadvantages based on privilege by distributing resources inequitably. Equity requires that we encourage the success of all our students by appreciating their differences and meeting their needs to the extent possible.
In our next post in this series, we will show some interesting associations between the type of scholarship students receive and their expected student loan debt levels.

LSSSE Annual Results 2016: Race, Ethnicity, and Economic Inequity (Part 2)
This is the second installment in a series of five posts based on data from the 2016 LSSSE survey administration and the 2016 Annual Report. The LSSSE 2016 Annual Report highlights inequities in scholarship policies and the associated consequences for student loan debt. In this post, we examine whether the financial costs of a legal education reinforce or mitigate larger societal inequities based on race and ethnicity.
Equity is important given the risks involved with attending law school. If scholarships are awarded to students with the most financial need, these students could attend law school with less financial stress and less reliance on student loans. The aid would, in turn, minimize risks among students for whom law school is already riskiest. Unfortunately, based on the LSSSE Survey data, law school scholarships flow most generously to students with the least financial need and least generously to those with the most need.
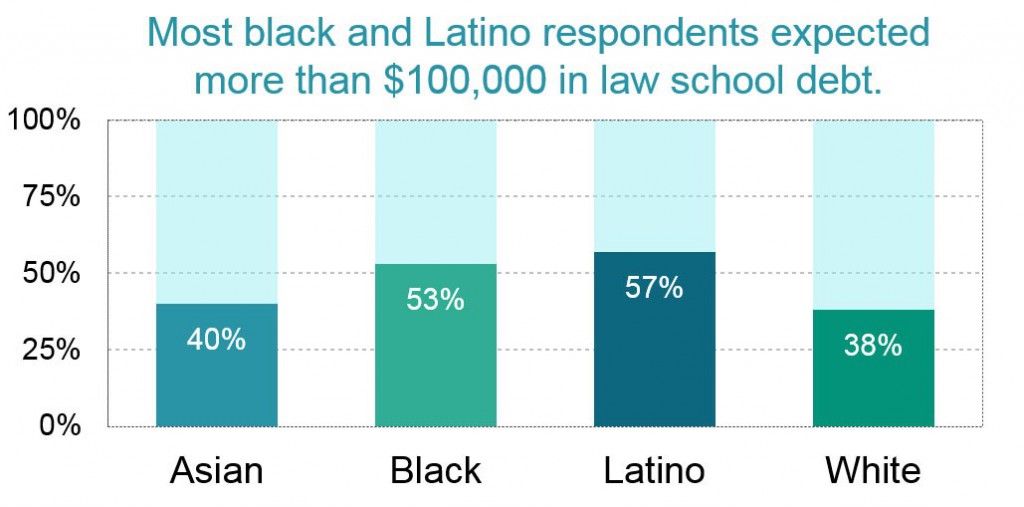
The income and wealth inequalities that plague our society foster vast disparities in student loan debt among people with similar levels of education. According to the Brookings Institution, “black college graduates owe $7,400 more [in student debt] on average than their white peers.” Four years after graduation, this gap balloons to $25,000, due to differences in interest accrual and graduate school borrowing. LSSSE data align with these findings. Fifty-three percent of black respondents and 57% of Latino respondents expected to owe more than $100,000 in law school debt upon graduation, compared to 38% of white and 40% of Asian respondents. As the Brookings data illustrate, higher interest accrual on higher debts will likely exacerbate these already yawning disparities over time.
The close correspondence between LSAT scores and merit scholarships fostered racial and socioeconomic disparities. White and Asian respondents were most likely to have received a merit scholarship. Black and Latino respondents were least likely.
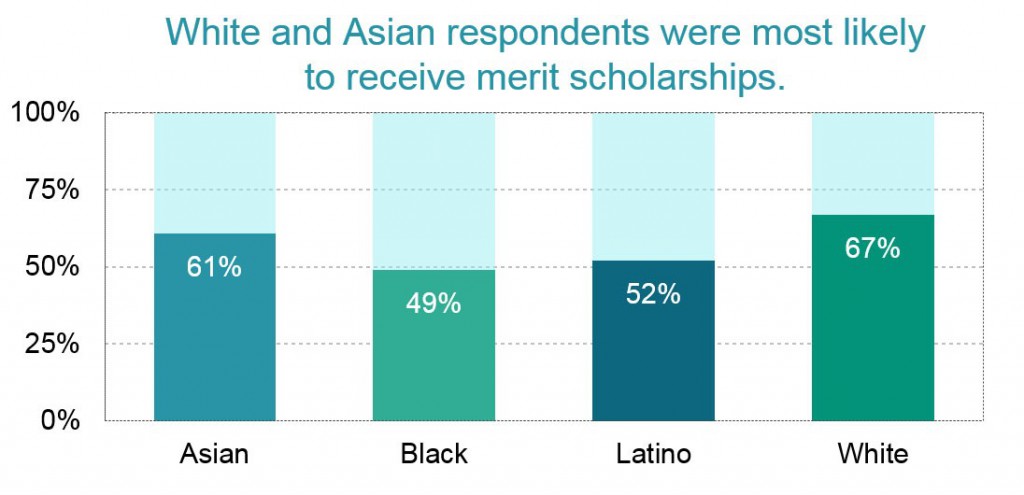
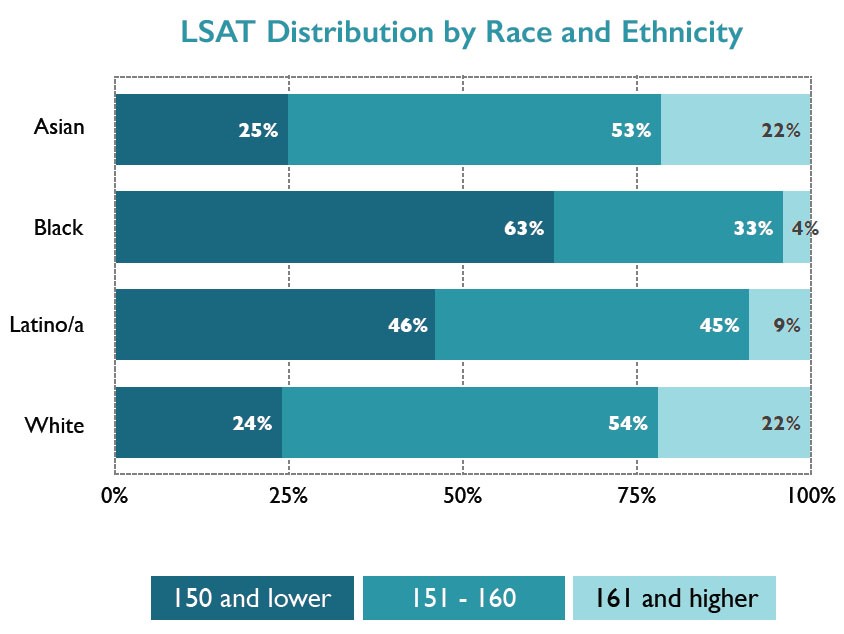
The underlying reason for this disparity is that LSAT scores among blacks and Latinos tend to be lower than those of whites and Asians. In the LSSSE sample, 63% of black respondents and 46% of Latino respondents had LSAT scores below the rough national median of 151. Only about a quarter of white and Asian respondents had scores below 151. At the other end of the distribution, where scholarship money flows most abundantly, 22% of white and Asian respondents scored above 160, while only 4% of black and 9% of Latino respondents scored at that level.
In our next post, we will highlight some differences in scholarship and debt patterns among students from different socioeconomic backgrounds and expand on why heavy reliance on LSAT scores to allocate scholarship funding may be deeply problematic for those who value equity in education.

LSSSE Annual Results 2016: Types of Scholarship Awards (Part 1)
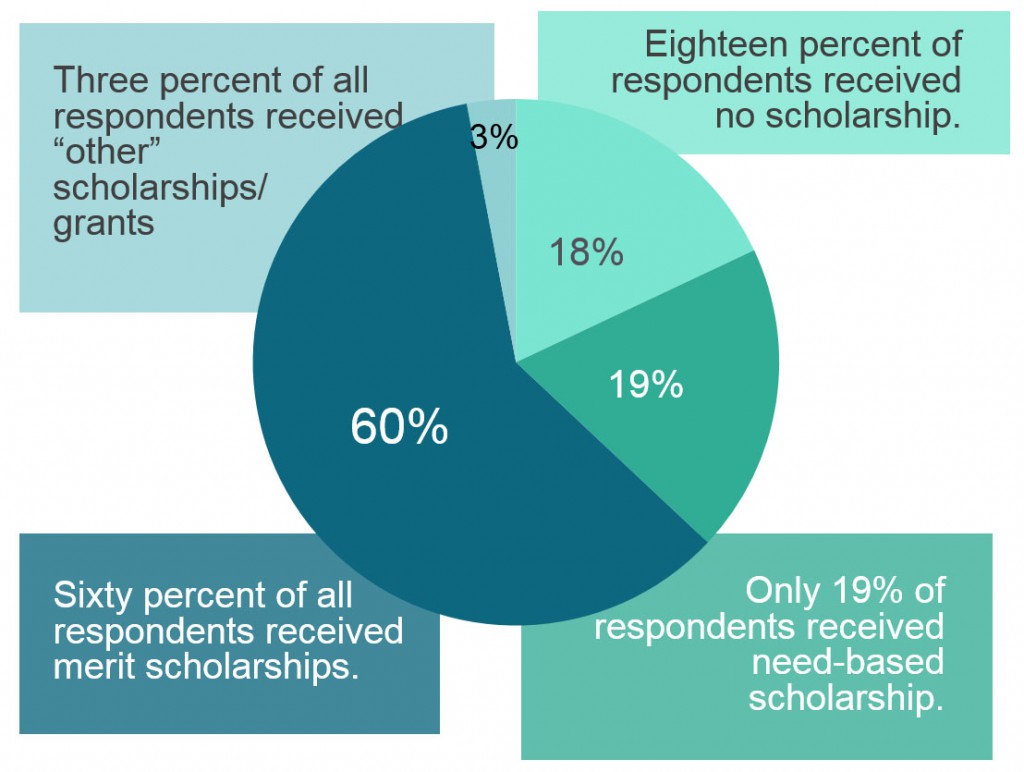
This is the first installment in a series of five posts based on data from the 2016 LSSSE survey administration and the 2016 Annual Report. The LSSSE 2016 Annual Report highlights inequities in scholarship policies and the associated consequences for student loan debt. In this post, we summarize the overall prevalence of merit-based and need-based scholarships reported by LSSSE respondents.
The cost of legal education is a topic of considerable interest. Discussions tend to revolve around ever-rising tuition sticker prices. The truth, however, is that relatively few students actually pay sticker price for their legal education. The downturn in law school applications and enrollments has prompted schools to rely more heavily on tuition discounts – mainly, scholarships – as a means of attracting students. Over 70% of the law students surveyed by LSSSE in 2016 reported having received scholarships for their studies – a proportion that would have been unimaginable a decade ago. By forcing schools to be more generous in awarding scholarships, the decreased demand for legal education has been a bright spot for many students.
Merit scholarship funding makes up the bulk of law school scholarship budgets. American Bar Association data show a vast expansion of merit scholarship funding between 2005 and 2010, and while more current data are limited, all indications are that this trend has continued and likely intensified since that time. Need-based funding, on the other hand, has remained essentially flat. Funding for so-called “need-plus” scholarships increased markedly. These awards are, in theory, need/merit hybrids. Nevertheless, indirect trends suggest these scholarships have little equitable impact, operating as merit scholarships by another name.
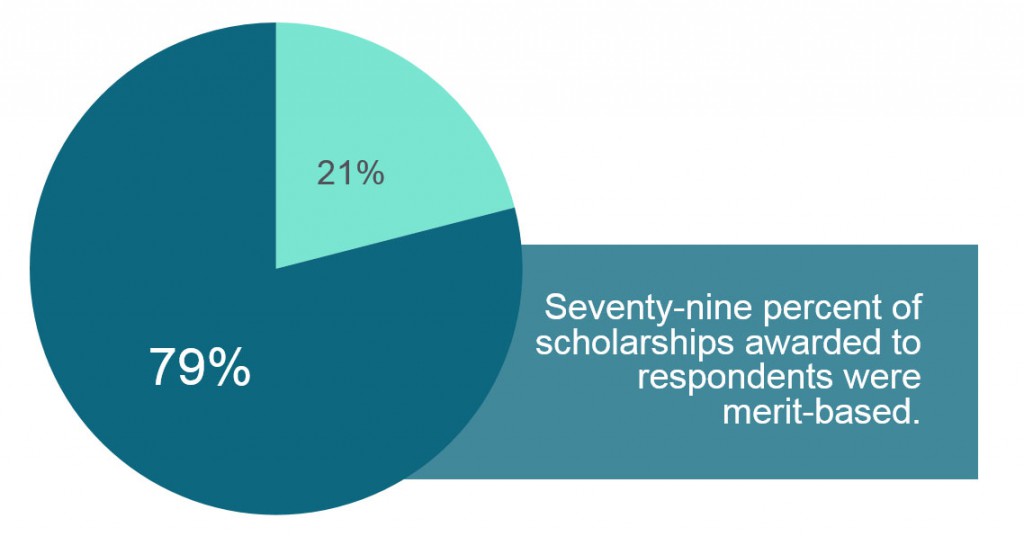
Among those respondents who reported receiving a scholarship, 79% of the scholarships were merit-based. Only 21% of the scholarships were need-based. Although the LSSSE data does not capture the dollar amounts of these scholarships, it is clear that law school scholarship policies heavily emphasize merit without regard for differences among students based on background or economic need.
Among those respondents who reported receiving a scholarship, 79% of the scholarships were merit-based. Only 21% of the scholarships were need-based. Although the LSSSE data does not capture the dollar amounts of these scholarships, it is clear that law school scholarship policies heavily emphasize merit without regard for differences among students based on background or economic need.
In our next two posts, we will discuss some general differences in student demographics between recipients of merit- and need-based scholarships.