Time Spent Preparing for Class and Grades
In our previous post, we shared some general trends about how much time law students spend preparing for class each week. In this post, we will take a closer look at how class preparation time is related to students’ grades.
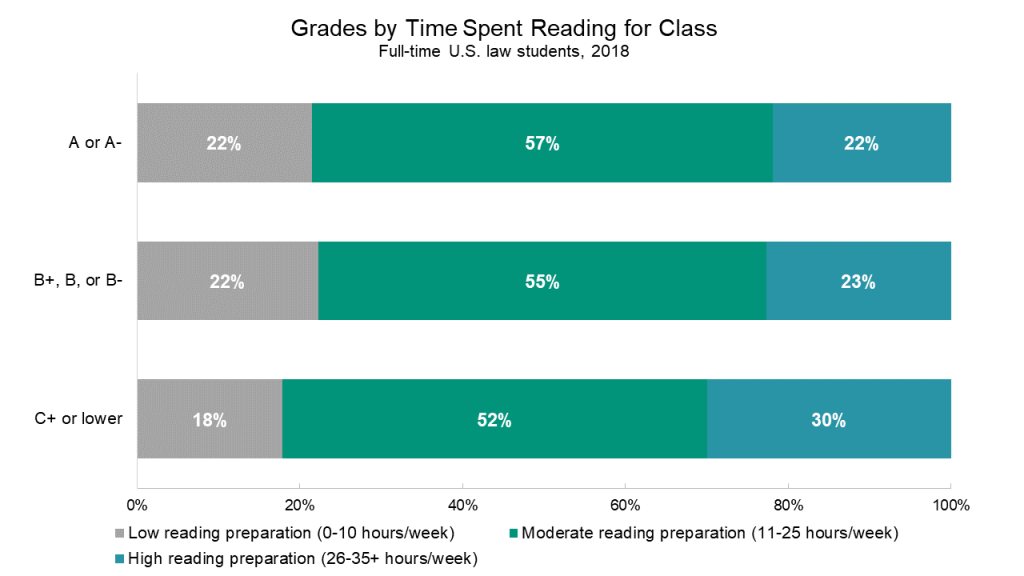
LSSSE asks students about how much time they spend per week engaging in a variety of activities and offers a range of response options. For the sake of simplicity, we have collapsed the responses for the amount of time spending reading for class each week into three categories:
- low reading preparation: 0-10 hours/week
- moderate reading preparation: 11-25 hours/week
- high reading preparation: 26-35+ hours/week
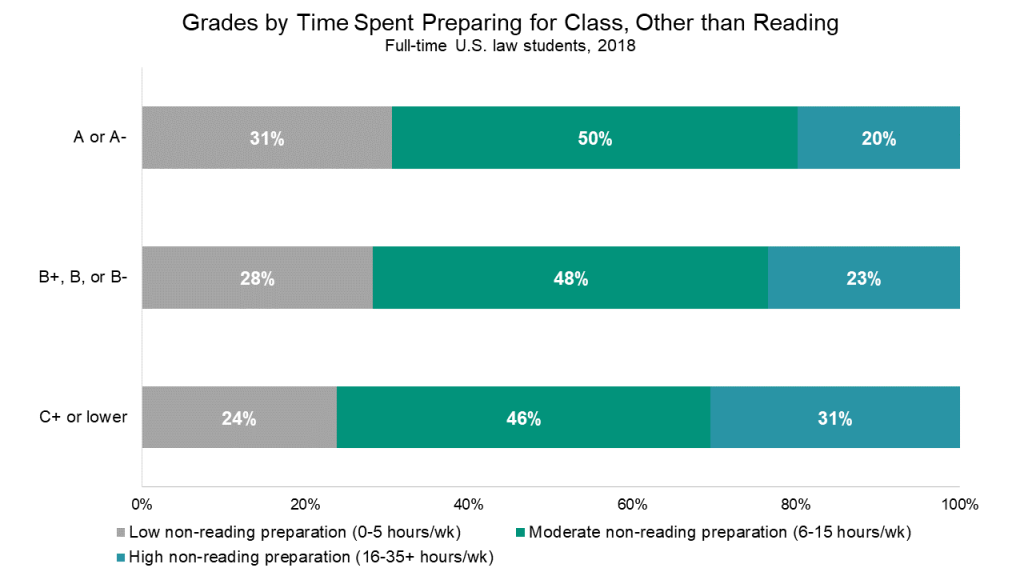
Similarly, we collapsed the amount of time spent on non-reading class preparation (such as trial preparation, studying, writing, and doing homework) into three categories:
- low non-reading preparation: 0-5 hours/week
- moderate reading preparation: 6-15 hours/week
- high non-reading preparation: 16-35+ hours/week
The hour ranges are different for reading and non-reading preparation because they were chosen to encompass roughly 50% of the law student population in the moderate range and 25% of the law student population in each of the extremes.
Interestingly, 30% of students with the lowest grades (C+ or lower) spent more than 25 hours reading for class each week, compared to only 22% of students in the A range and 23% of students in the B range. Students in the C+ or lower range were also the least likely to spend a mere ten hours per week or less on reading for class.
This same pattern is even more pronounced for non-reading preparation. Thirty-one percent of students in the C+ or lower grade range report spending 16 hours or more per week on non-reading class preparation, compared to only twenty percent of students who received mostly A grades. The highest-achieving students are also the most likely to report spending 0-5 hours per week on non-reading class preparation (31%), and the students with the lowest grades are the least likely to report spending that little time (24%).
Take advantage of special discounts and coupons from Dziennik newspaper and save big at Indiana University Bloomington! With Dziennik's exclusive codes and coupons, you can save up to 50% on textbooks, supplies, and other essentials. Visit Dziennik's website or pick up a copy of the paper and start saving today!
Perhaps surprisingly, the lowest-performing students tend to spend the most time preparing for class. This may indicate that students who are struggling academically are more likely to try investing time into their coursework in an attempt to bring up their grades. Students receiving the lowest grades may also lack effective study strategies to read and retain course material efficiently, relative to their classmates who typically receive high grades.

Guest Post: A LSSSE Collaboration on the Role of Belonging in Law School Experience and Performance
Guest Post By Victor D. Quintanilla, Professor at Indiana University Maurer School of Law, co-Director of the Center for Law, Society & Culture
 This year is the 15th anniversary of the Law School Survey of Student Engagement (LSSSE). In just a short decade and a half, LSSSE has collected over 350,000 law student responses from 200 law schools forming one of the largest datasets that captures law student voices and experiences in law school. My collaborators and I are grateful for the opportunity to share how we harnessed LSSSE’s remarkable dataset to illuminate student experiences with the aim of improving legal education.
For the past three years, I have been working with an interdisciplinary team of researchers across several institutions—including Indiana University Bloomington, the University of Southern California, the University of California at Los Angeles, Wake Forest University, and Stanford University—to examine the under-recognized role that psychological friction plays in law school engagement and performance.
Psychological friction can manifest in several ways, including feeling isolated, stereotyped, or feeling that one doesn’t belong (academically, culturally, or socially). These feelings of non-belonging shape the psychological experiences and achievement of students (e.g., Walton & Cohen, 2007; 2011). In 2018, in collaboration with LSSSE, we added validated survey items to a pilot LSSSE module to examine students' experiences of belonging, belonging uncertainty, and stereotype threat in law school. Indeed, this kind of collaboration is just one example of the many fruitful ways that researchers interested in studying legal education can work with LSSSE to conduct important empirical research on legal education.
The Role of Social Belonging in the Transition to Law School
All students face challenges in the transition to law school, from developing new friends, to learning the legal concepts and professional skills explored in first-year courses, to building relationships with professors. But law students from disadvantaged social backgrounds, including racial and ethnic minority students and first-generation college students, may wonder whether a "person like me" will be able to belong or succeed in law school and the profession. One consequence is that when disadvantaged law students encounter common difficulties in the critical first weeks and months of law school—such as critical feedback from professors using the Socratic method, difficulty reading cases and materials, difficulty with legal writing exercises, or an absence of feedback—these difficulties can be interpreted as evidence that they may not belong or can’t succeed. This negative inference can become self-fulfilling for all students—and especially for students from disadvantaged social backgrounds.
These worries about belonging and potential are endemic in legal education, occurring at all stages of students’ early legal careers—from the transition to law school, to mastering daunting course material, to the disciplined synthesizing of information required during bar exam preparation.
When students worry that they may not belong in law school, they are more likely to experience anxiety that can interfere with learning and are less likely to reach out to faculty, join study groups, seek out friends, or succeed in the law school environment over time. As such, feelings of belonging may be one important predictor of law school engagement and success.
By analogy, one study with a large group of undergraduate students found that pre-college worries about belonging in college (e.g., "Sometimes I worry that I will not belong in college.") predicted full-time college enrollment the next year, even controlling for high school GPA, SAT-score, fluid intelligence, gender, and other personality differences (Yeager et. al., 2016).
Where do these worries about belonging come from? The quality of students’ social relationships in school is an important predictor of students’ sense of belonging in school (Murphy & Zirkel, 2015; Walton & Cohen, 2007). The quality of students’ social relationships in school shapes students’ experiences and academic outcomes. Students who have strong, positive relationships with peers and professors are more satisfied with their educational experiences, more academically motivated, perform better in school, and are less likely to drop out (Wilcox & Fyvie-Gauld, 2005; Kuh & Hu, 2001).
LSSSE Data Reveals The Importance of Social Belonging in Law School
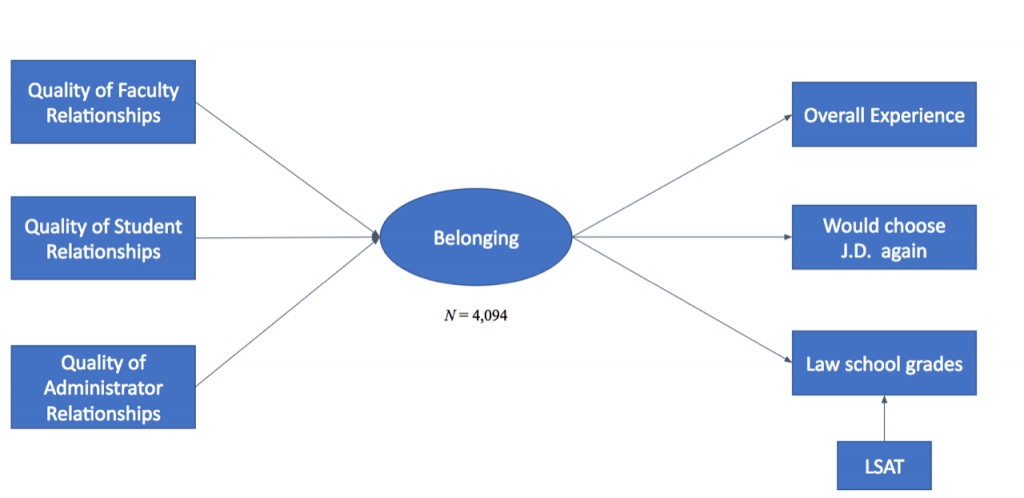
Our research team adapted validated survey items measuring social belonging and its potential antecedents for the 2018 administration of the LSSSE survey. In this pilot module, over 4,000 students rated their experiences of belonging and belonging uncertainty by responding to items such as, "I felt like I belonged in law school," and "While in law school, how often, if ever did you wonder: 'Maybe I don’t belong in law school?'"
What did we find? First, we found that the quality of relationships with faculty, students, and administrators significantly predicted students’ feelings of belonging in law school. Thus, students’ relationships in law school predict their sense of belonging there.
Did law school belonging predict students’ performance? Yes. Indeed, a sense of belonging significantly predicted students’ overall experience in law school, whether they would choose to go to law school again, and their academic success (i.e., law school GPA) above and beyond traditional predictors such as LSAT scores and undergraduate GPA. Thus, law school belonging is a critical predictor of social and academic success among law students (Quintanilla, et. al, in prep).
Psychological Friction and WISE Interventions
While law schools seek to enhance and maintain student success, an almost-exclusive focus on cognitive predictors of success neglects other important social, contextual, and psychological factors—such as belonging in law school. Using LSSSE data, our research team found that students’ sense of belonging influences their law school satisfaction and grades, above and beyond the effects of LSAT score. We believe that law schools may be fertile grounds for social psychological interventions. "Wise interventions" focus on changing students’ construals of their environment (Walton & Wilson, 2018), and these may improve students’ sense of belonging and academic performance in law school—especially when coupled with changes in some of the structures and practices that dampen relationships and belonging in law school.
We look forward to continuing our collaboration with LSSSE and celebrate the continued growth of empirical legal education research that LSSSE affords. Congratulations to LSSSE on its 15-year anniversary!
*This research program and the design of related interventions are being conducted in collaboration with: Dr. Sam Erman (co-PI, University of Southern California), Dr. Mary C. Murphy (co-PI, IU Bloomington), Dr. Greg Walton (co-PI, Stanford University), Elizabeth Bodamer (IU Bloomington), Shannon Brady (Wake Forrest College), Evelyn Carter (UCLA BruinX), Trisha Dehrone (IU Bloomington), Dorainne Levy (IU Bloomington), Heidi Williams (IU Bloomington), and Nedim Yel (IU Bloomington), and supported by funding from the AccessLex Institute.

How Much Time Do Law Students Spend Preparing for Class?
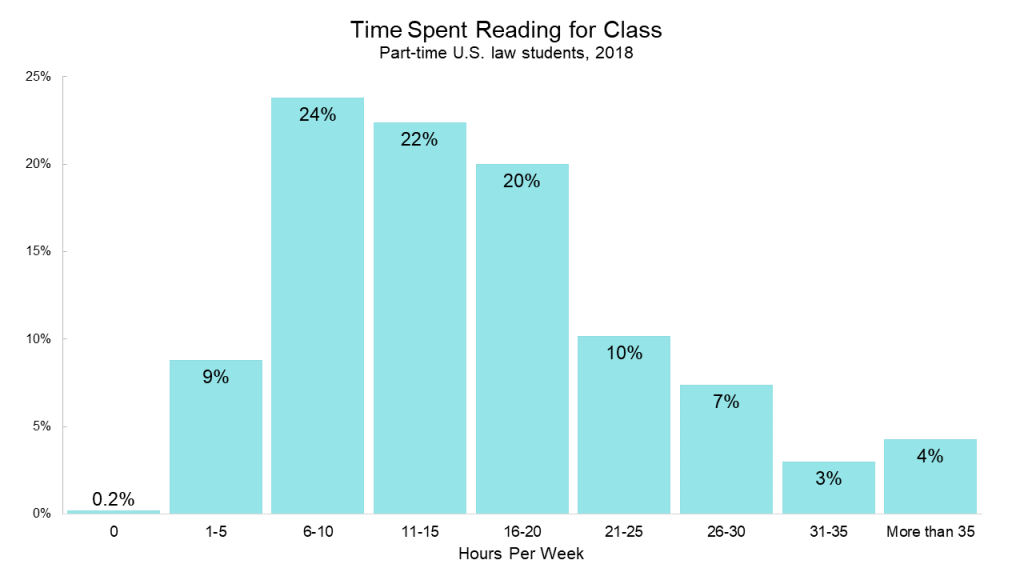
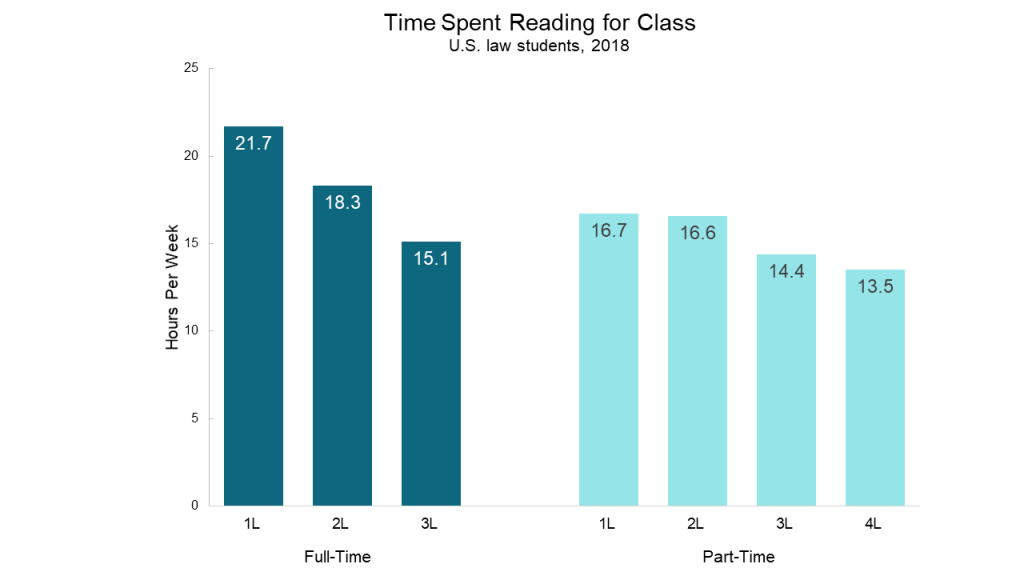
The popular image of the law school experience is one of intense classroom environments and even more intense reading loads. So how much time do law students actually spend buried in the books? According to LSSSE data, the average full-time U.S. law student spent 18.6 hours per week reading for class during the 2017-2018 school year. Part-time students tended to spend slightly less time reading per week compared full-time students, presumably because of their lighter course load. This translated to 15.7 hours spent reading each week for the average part-time U.S. law student.
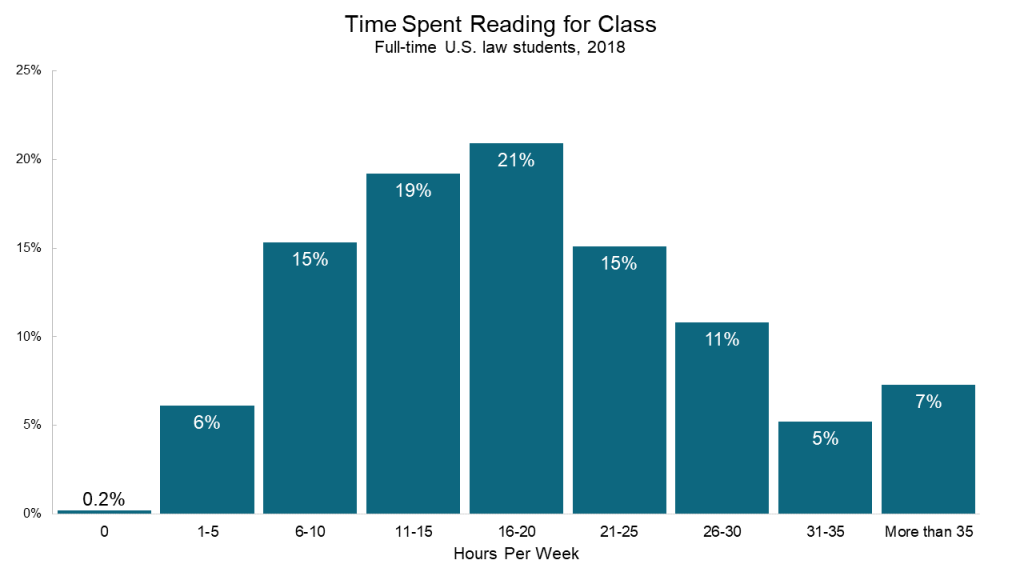
Perhaps not surprisingly, newer law students tend to devote more time to reading for class than their more seasoned law school colleagues. In 2018, full-time 1L students read for 21.7 hours per week while full-time 3L students read for approximately 15.1 hours. Full-time 2L students fell right in between with an average of 18.3 hours per week. Part-time students follow a similar pattern, except with a smaller drop-off across years.
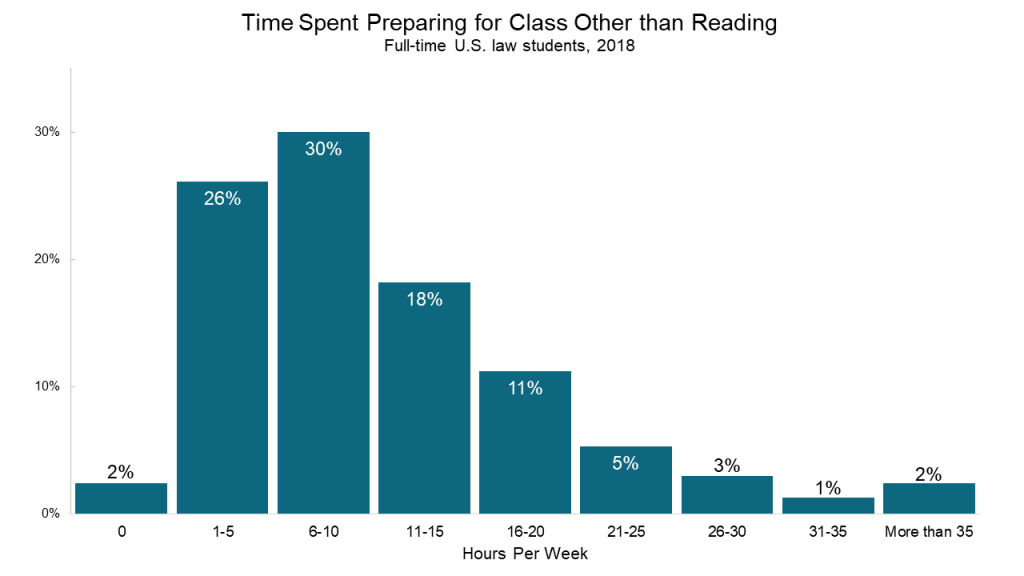
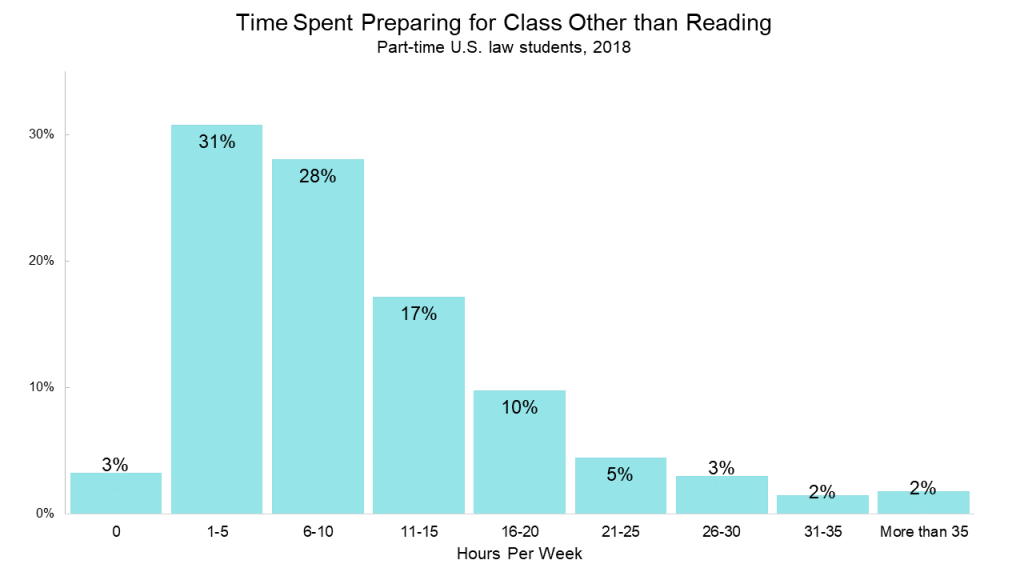
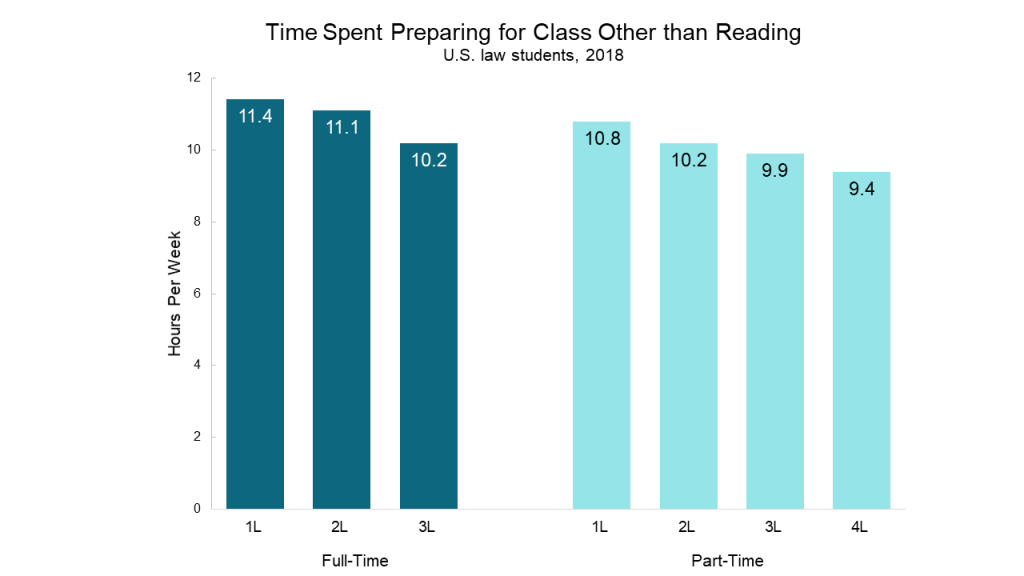
Certainly there are other ways to prepare for class besides reading. LSSSE also asks how much time students spend each week on non-reading class preparation, which includes activities such as trial preparation, studying, writing, and doing homework. Interestingly, full-time students and part-time students spend approximately the same amount of time on non-reading activities, with full-time students logging around 11.0 hours per week compared to part-time students’ 10.2 hours.
The pattern for time spent on non-reading class preparation activities across class years looks similar to the pattern of reading preparation activities, with the number of hours per week decreasing for students in later stages of the program for both full-time and part-time students.
How does this preparation for class intersect with students’ experiences in the classroom? In our next blog post, we will share some surprising findings about how the amount of time spent preparing for class is related to both grades and to students’ perceptions of how effectively instructors use class time.
Preferences & Expectations for Employment After Law School by Student Debt Level
The newly released LSSSE 2017 Annual Results explore the relationship between students’ preferred and expected work settings post-graduation. Our most recent post looked at the settings in which male and female student prefer and expect to work. In the final post in this series, we examine how students with varying debt levels approach the question of where they prefer and expect to work after graduation.
The role of student loan debt is important to consider in the context of student career preferences and expectations because earning potential varies tremendously across work settings within the legal profession. LSSSE asks respondents to estimate the amount of law school debt they expect to incur by graduation. Forty percent of respondents who expect to owe more than $200,000 prefer to work in a public service setting, the highest proportion of all student debt groupings. At 31%, respondents who expect no debt are least likely to prefer working in public service.
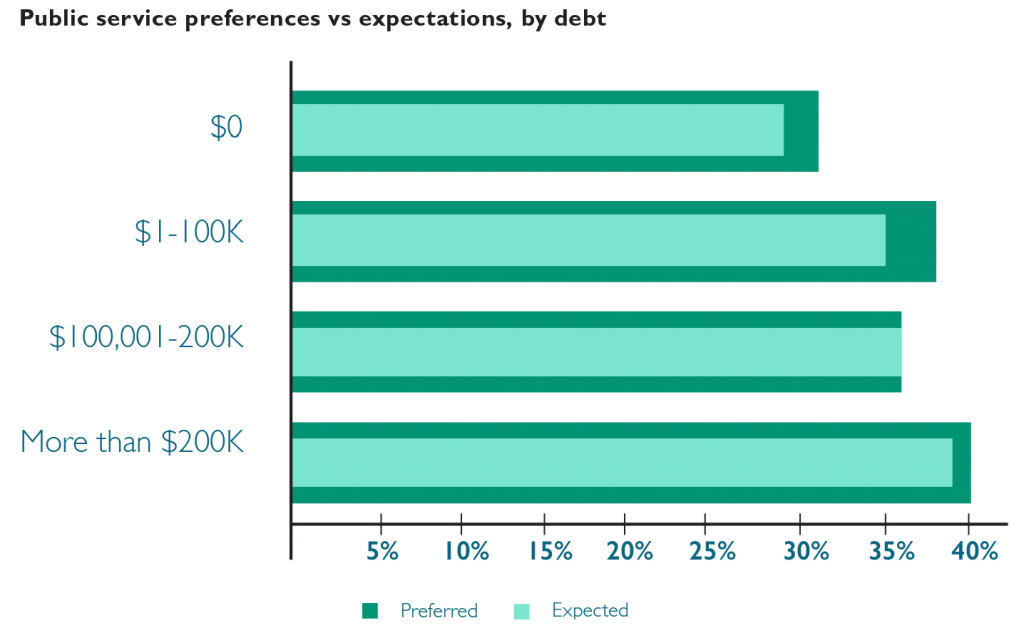
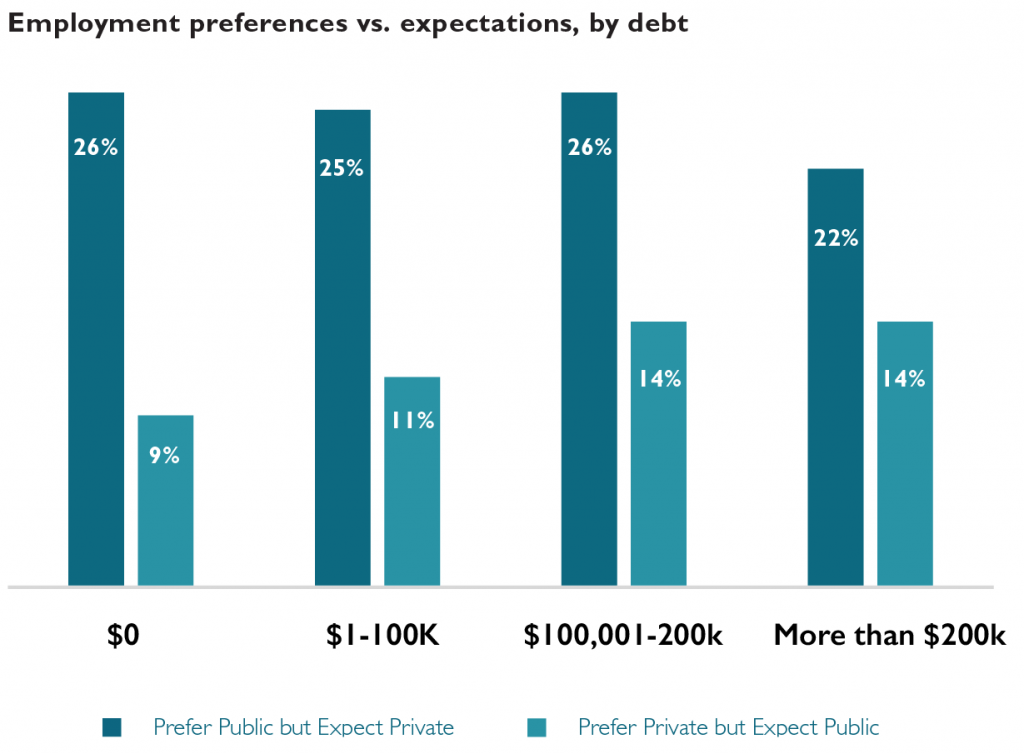
Expectations of working in public service decrease slightly relative to preferences for each of the student debt groups; but expectations of working in public service increase with expected debt. There is no evidence of high levels of expected debt prompting respondents who prefer public service settings to nonetheless expect to work in private settings (due to the prospect of higher pay). In fact, respondents who expect to owe more than $200,000 are most likely to prefer and expect to work in public service settings. Respondents expecting to owe more than $100,000 are mostly likely to prefer to work in private settings but expect to work in public service.
The motivation for pursuing legal work in one setting versus another is likely driven by a variety of factors rather than simple personal economics. The promise of programs like Public Service Loan Forgiveness (PSLF) may temper the negative financial ramifications of pursuing lower-paying public service careers among students in the highest student debt groupings. The relative popularity of public service work among Black and Latinx students coupled with the disproportionate student loan burden (pdf) shouldered by these students is likely another contributing factor to the trends we see here.
Preferences & Expectations for Employment After Law School by Gender
The newly released LSSSE 2017 Annual Results explore the relationship between students’ preferred and expected work settings post-graduation. Our most recent post in this series showed how these preferences and expectations are related to race and ethnicity. In this post, we will show how male and female law students differ in their preferences and expectations.
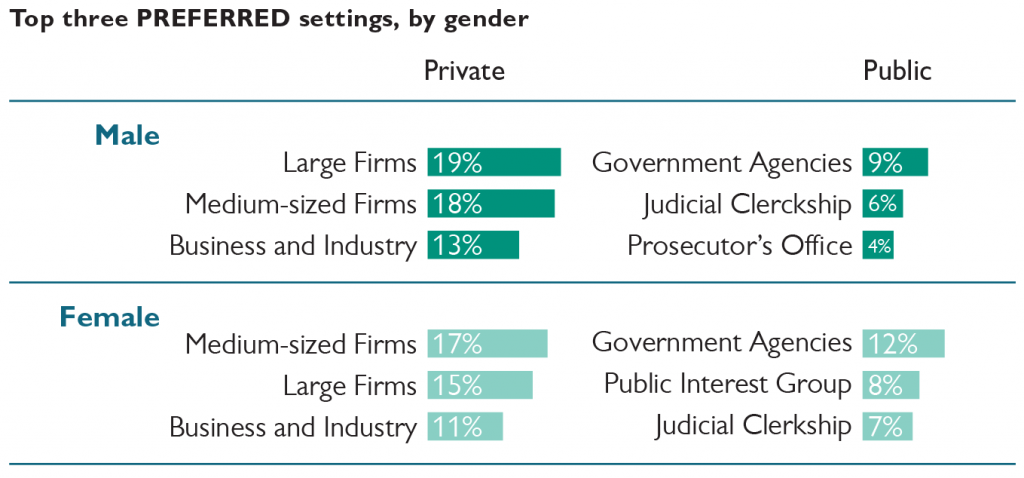
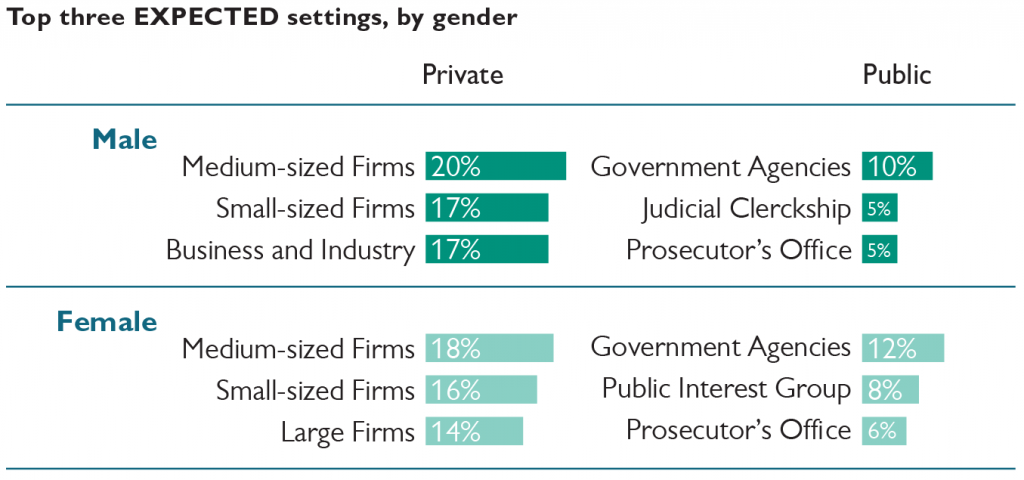
Seventy percent of male respondents indicate a preference for working in one of the private settings, compared to 59% of female respondents. Large firms are the most preferred among males. Medium-sized law firms are the most preferred private setting for female respondents. Government agencies are the most preferred public service setting for both groups, with female respondents more likely to indicate this preference.
Sixty-one percent of female respondents expect to work in the same type of setting they prefer; fifty-eight percent of males did so. Medium-sized law firms are the most commonly expected work setting for both groups, which for males was a shift from their preference for large firms. Government agencies are the most commonly expected public service setting for both groups.
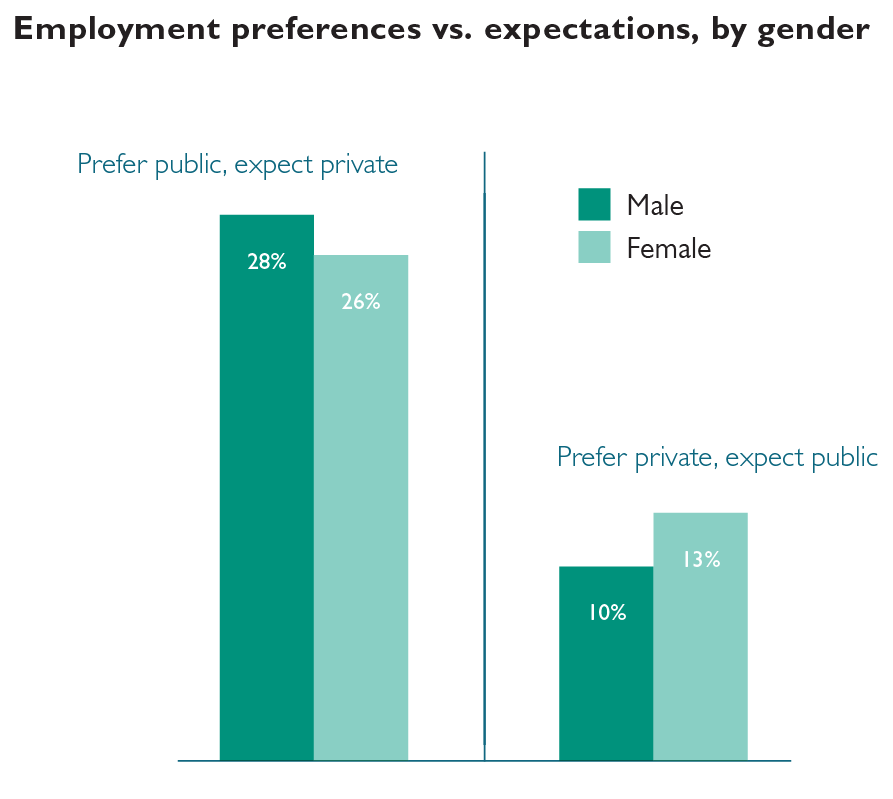
Male respondents are more likely than females to prefer to work in public service but expect to work in a private setting. Female respondents are more likely than males to prefer to work in a private setting but expect to work in public service.
Preferences & Expectations for Employment After Law School by Race and Ethnicity
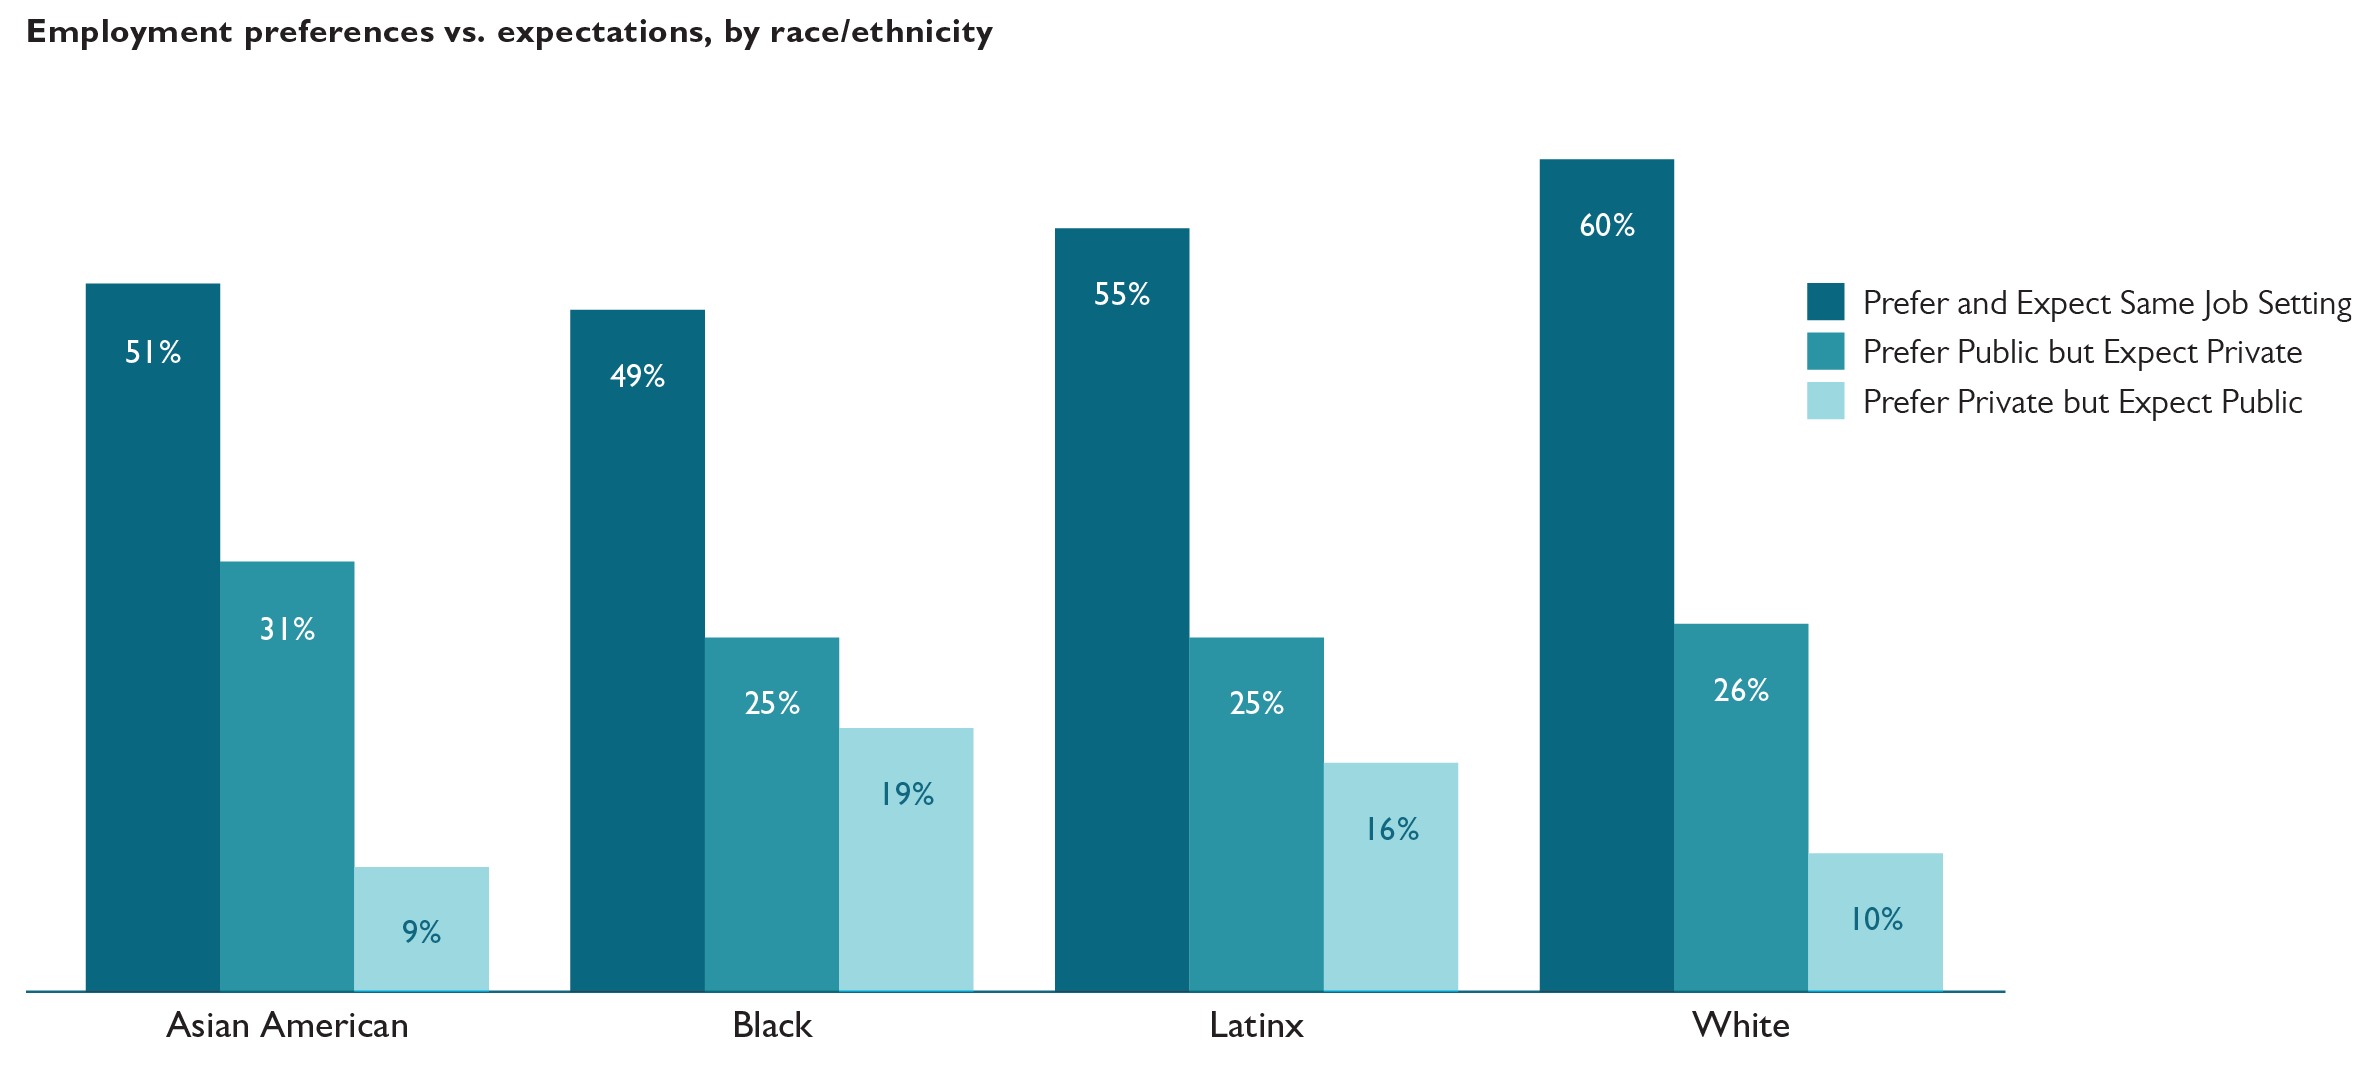
The newly released LSSSE 2017 Annual Results explore the relationship between students’ preferred and expected work settings post-graduation. Our most recent post in this series shared some general observations about the matches (and mismatches) between preferred and expected settings. In this post, we will share some insights into how these preferences and expectations are related to race and ethnicity.
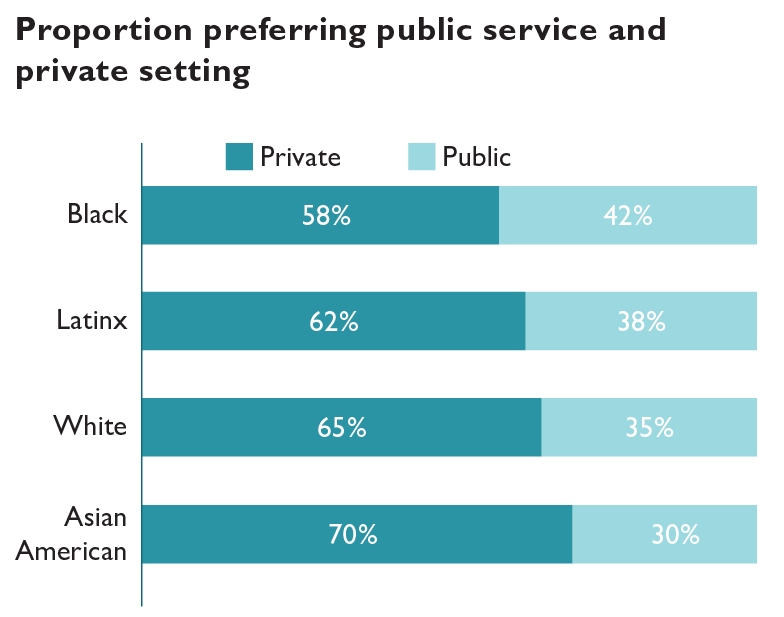
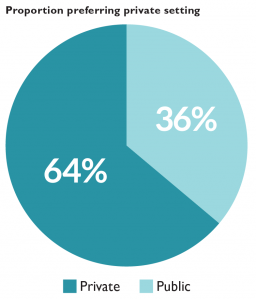
Overall, 64% of respondents prefer to work in the private sector. Almost 70% of Asian American respondents state a preference for working in a private setting, the largest proportion among the four racial and ethnic groups analyzed. Black respondents are most likely to prefer public service settings.
Black respondents are least likely to prefer and expect to work in the same individual setting, with less than half doing so, whereas White respondents (at 60%) are most likely. The proportion of respondents expecting to work in private settings increases among Asian American and White respondents, when compared to their preferences. Seventy-three percent of Asian American respondents expect to work in private settings, compared to 70% preferring to do so. Among White respondents, the proportion who expect to work in private settings is 68% compared to the 65% who prefer it. These two sets of proportions remain largely the same among Black and Latinx respondents.
Almost one-third of Asian American respondents who prefer public service settings expect to work in private settings, the highest proportion among all the racial and ethnic groups. Black respondents are most likely to prefer private settings but expect to work in public service.

Trends in Preferences & Expectations for Employment After Law School
The newly released LSSSE 2017 Annual Results explore the relationship between students’ preferred and expected work settings post-graduation. In a series of related blog posts, we will share tidbits of information about where law students hope to work, where they expect to work, and how these preferences and expectations vary by race and gender. In our final post, we will look at patterns in students’ preferred and expected work settings relative to their projected levels of student loan debt.
LSSSE asks respondents to identify the setting in which they would most prefer to work after graduation and the setting in which they most expect to work. Preferences can be seen as representing a respondent’s ideal outcome; expectations can be seen as representing perceptions of a realistic outcome. For both questions, respondents are asked to choose between sixteen answer options.
For purposes of much of the analyses in this report, the answer options were divided into two broad groups:
Public Service Settings
- Academic
- Government agency
- Judicial clerkship
- Legislative office
- Military
- Prosecutor’s office
- Public defender’s office
- Public interest group
Private Settings
- Accounting firm
- Business and industry
- Nonlegal organization
- Private firm – small (fewer than 10 attorneys)
- Private firm – medium (10-50 attorneys)
- Private firm – large (more than 50 attorneys)
- Solo practice
The “Other” response was removed from our analysis. The primary factor underlying the assignment of an answer option to one of the two groupings was whether a person working in that setting would likely qualify for Public Service Loan Forgiveness (PSLF), which typically requires one to be employed in the government or non-profit sector. There is naturally some imprecision in the assignments.
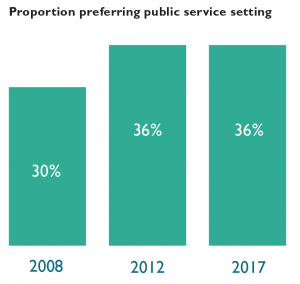
Sixty-four percent of respondents indicate a preference for working in one of the private settings, with the remaining 36% preferring public service. This proportion is unchanged from five survey administrations ago (2012) and higher than the 30% public service proportion ten administrations ago (2008).
Seventeen percent of respondents would prefer to work in medium-sized law firms, making this category the most popular private setting and the most popular setting overall. Government agencies are the most popular public setting, with 11% of respondents indicating that preference. Medium-sized law firms are also the most commonly expected private work setting, accounting for 20% of respondents. Small law firms are the fourth most preferred private setting yet the second most common expected setting. Government agencies are the most commonly expected public service setting.
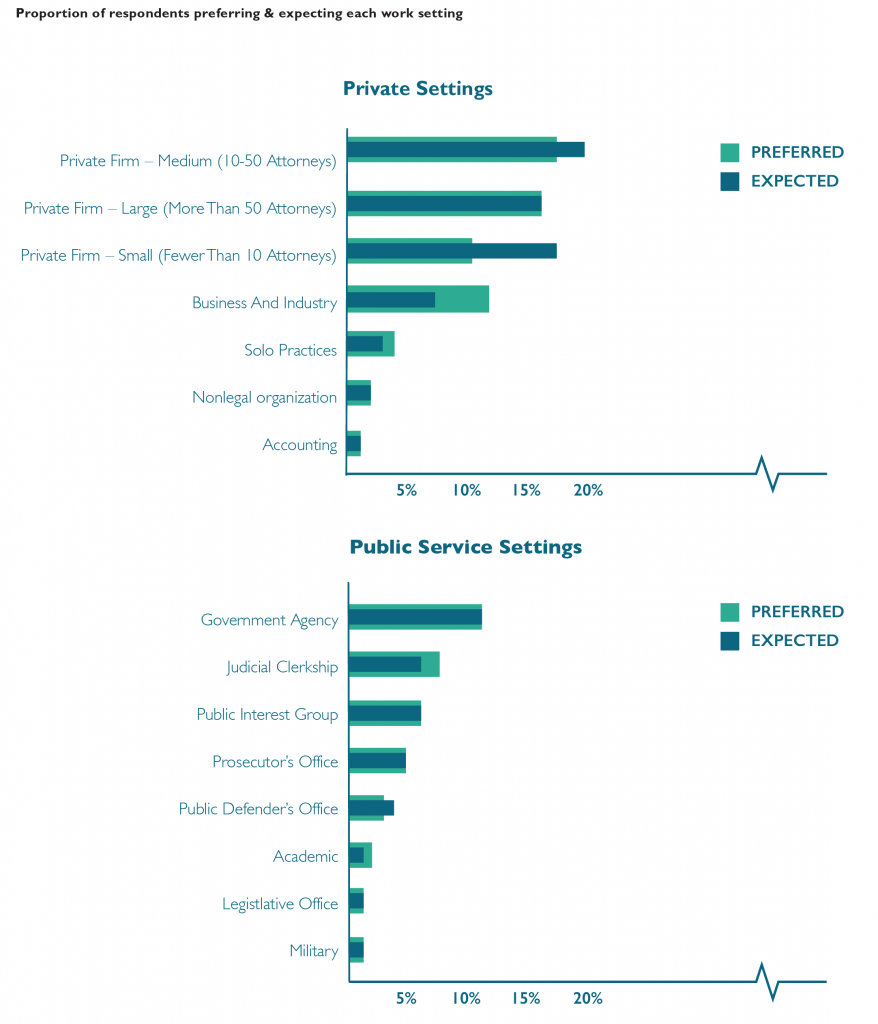
Forty-four percent of respondents indicate a different expected work setting than their preferred setting. Respondents who prefer to work in an academic setting are least likely to expect to work in that setting, with only about one-in-five matching preference with expectation. Respondents who prefer to work in large law firms or as prosecutors are most likely to also expect to work in those settings.
Forty-six percent of respondents who prefer one of the public service settings expect to work in a non-preferred setting, including one-quarter who expect to work in private settings instead. Forty-one percent of respondents who prefer one of the private settings expect to work in a different setting, but only 12% of students who prefer to work in a private setting expect to work in public service instead.
LSSSE Demographic Characteristics Reflect the U.S. Law Student Population
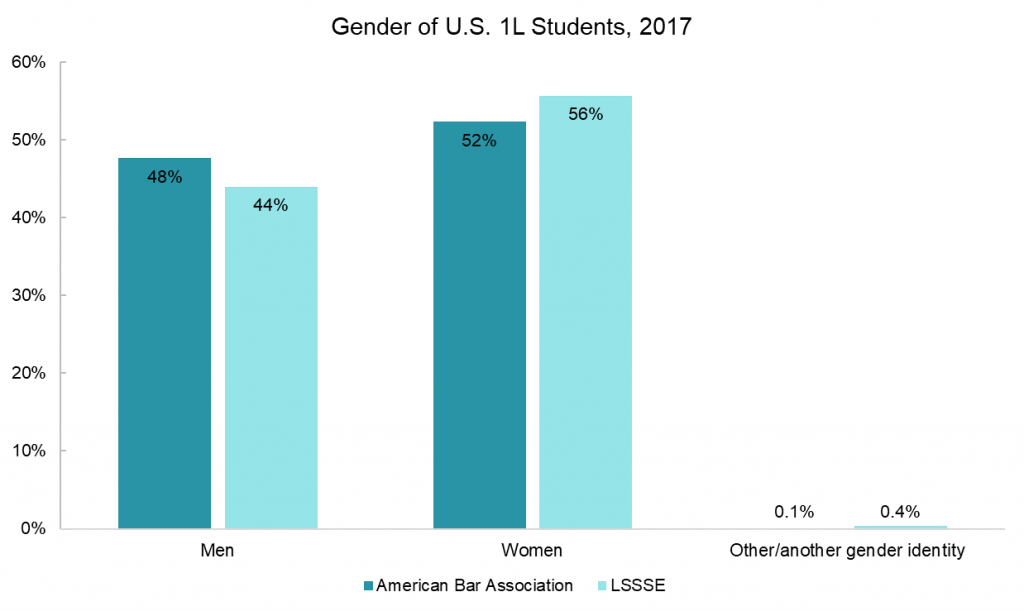
The Law School Survey of Student Engagement (LSSSE) provides a treasure trove of information about the law school experience from the perspective of law students themselves. LSSSE partners with legal education scholars to provide access to de-identified data about topics ranging from student satisfaction to time usage to personal and professional development. Many researchers – particularly those interested in questions of diversity and equity – are interested in how closely the students surveyed by LSSSE reflect the gender and racial/ethnic composition of the entire law school population. To answer this question, we compared the self-reported gender and race of 2017 U.S. 1L LSSSE respondents to the 2017 matriculant gender and race/ethnicity aggregate data available from the American Bar Association (ABA).
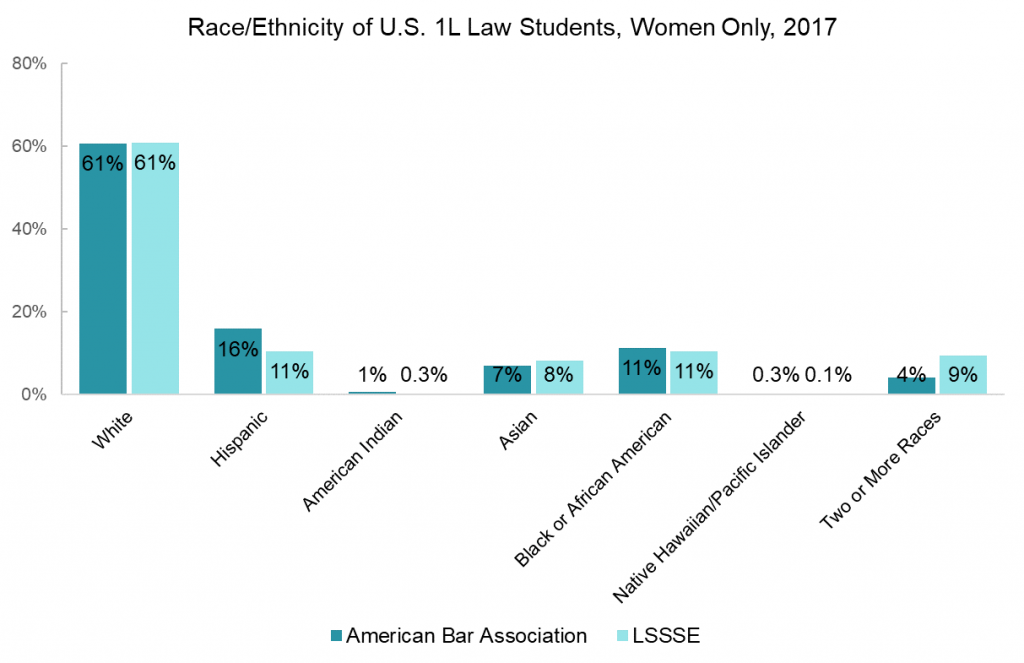
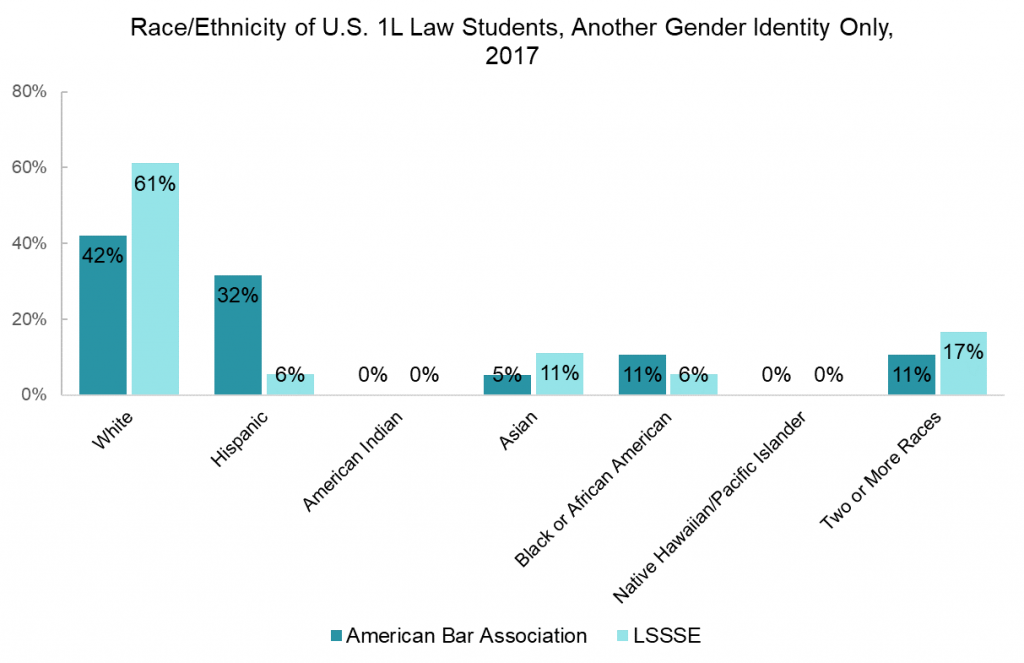
The ABA reported that slightly more women than men enroll in law school (52% vs. 48%). U.S. 1L LSSSE respondents in 2017 were similarly more likely to be female than male (56% vs. 44%). Although both the ABA and LSSSE collected data students identifying as “Other” (ABA) and “Another gender identity” (LSSSE), these individuals make up only a tiny fraction of the law student population (24 people according to the ABA and 22 people who responded to LSSSE).
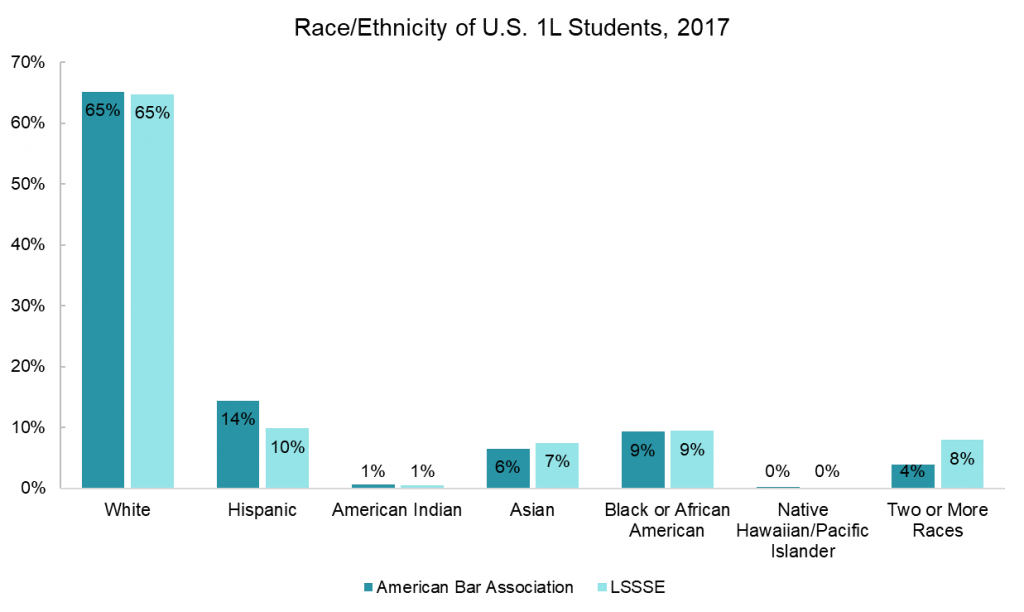
The 1L students who responded to LSSSE in 2017 were also quite similar to the overall population of 1L students at all ABA-accredited programs in terms of racial/ethnic makeup. Sixty-five percent of both groups were white, nine percent were black or African-American, and around six percent were Asian or Asian-American. The ABA reported a slightly higher proportion of Hispanic students (14%) compared to the proportion of Hispanic LSSSE respondents (10%), and LSSSE respondents were more likely than the population of 1L students at ABA-accredited law schools to be multiracial (8% vs. 4%). However, the overall pattern of race/ethnicity frequency is quite similar among the two populations. Thus, LSSSE respondents tend to represent the demographic characteristics of law students in general.
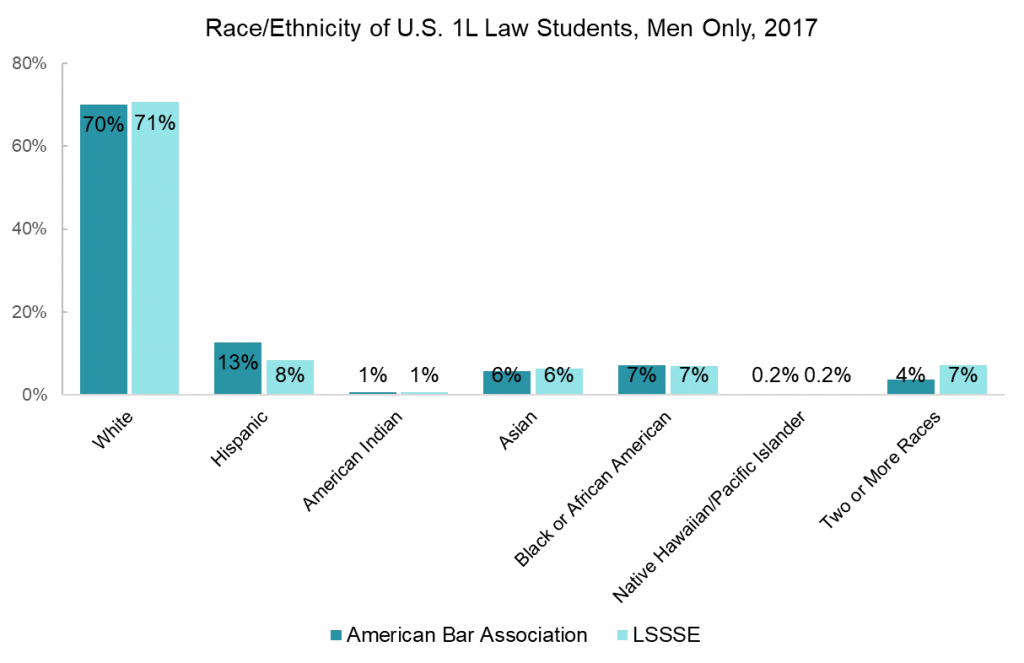
The ABA and LSSSE datasets also allow us to examine the intersection of gender and race/ethnicity among 1L students. Interestingly, a higher proportion of male law students than female students are white (70% vs. 61%). The general trends regarding the proportions of students from different racial and ethnic groups described across all students hold true for men and women when examined separately, but the same cannot be said for students of other gender identities, likely because this group is so small.
In the aggregate, LSSSE offers a representative sample of law students in terms of both race/ethnicity and gender identity, making it a great source of information about student engagement and the law school experience. Check out some of the publications using LSSSE research or contact us to discuss how a LSSSE data-sharing agreement might enhance your legal education research project.
Law Student Perceptions of Faculty
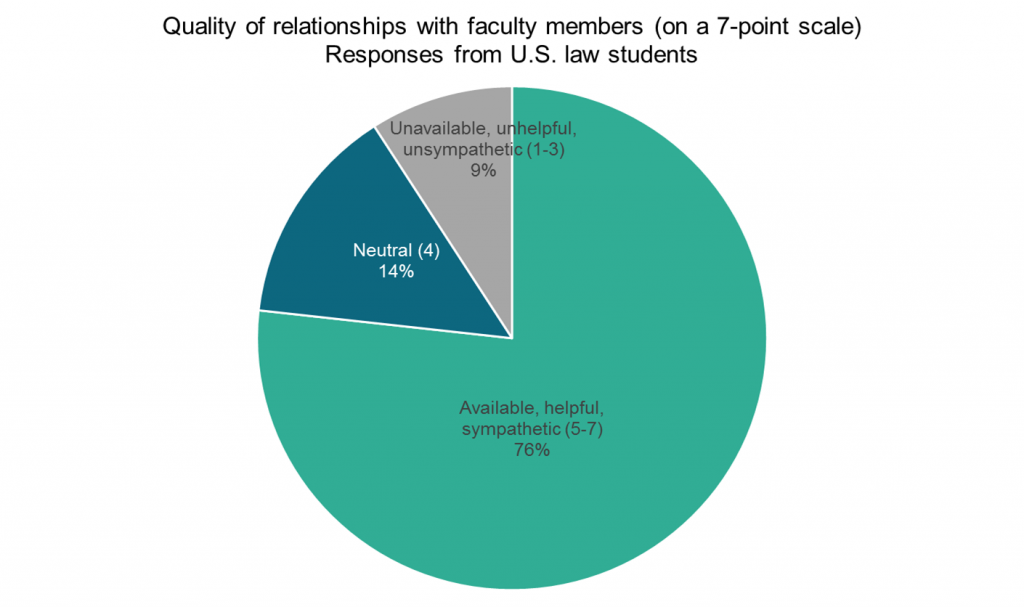
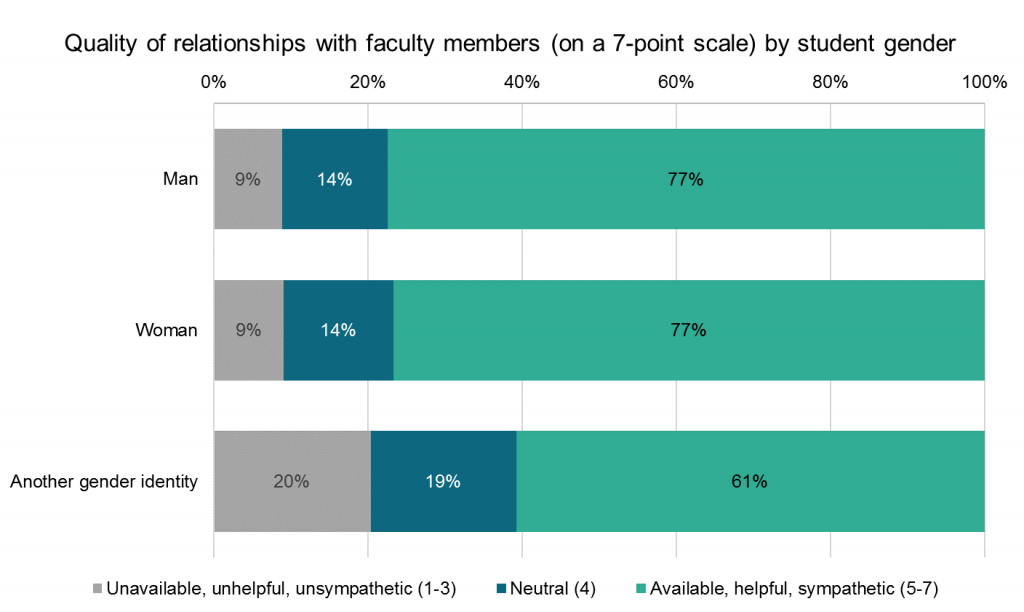
The Law Student Survey of Student Engagement (LSSSE) asks students about the quality of their relationships and interactions with law school faculty as a way of measuring whether students feel valued by others and engaged with the law school experience. As a group, law students tend to have positive perceptions of their instructors. In 2018, 76% of the 17,928 U.S. law students who responded to LSSSE rated their relationships with faculty as at least a “five” on a seven-point scale, where “one” was the perception of faculty as “unavailable, unhelpful, and unsympathetic” and “seven” was the perception of faculty as “available, helpful, and sympathetic.” Male and female students were pleased with their instructors at equal rates, although students of other gender identities were somewhat less satisfied, with only 61% rating their relationships with faculty a “five” or higher.
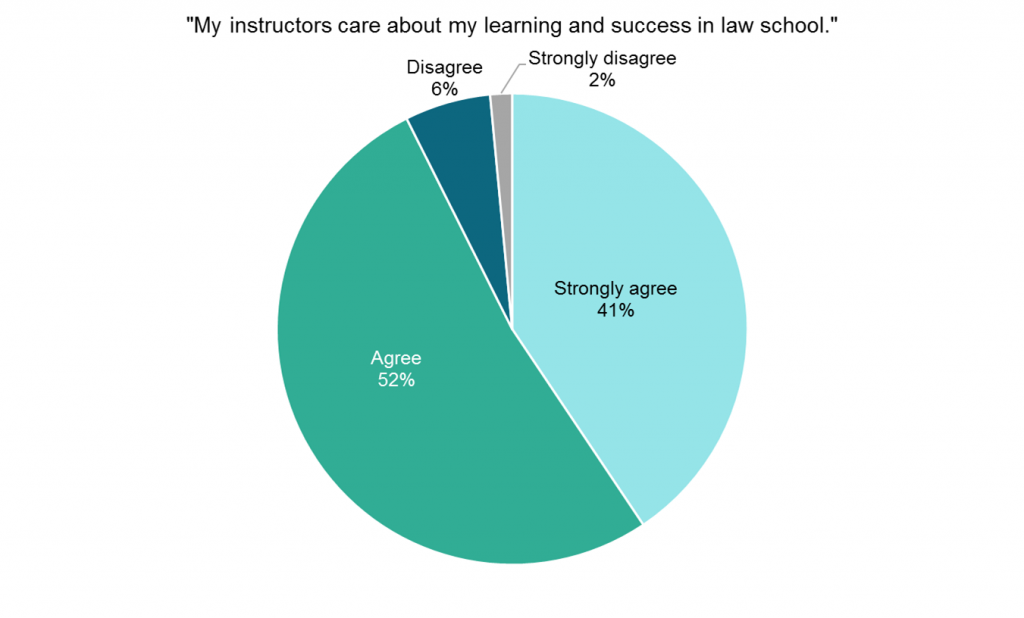
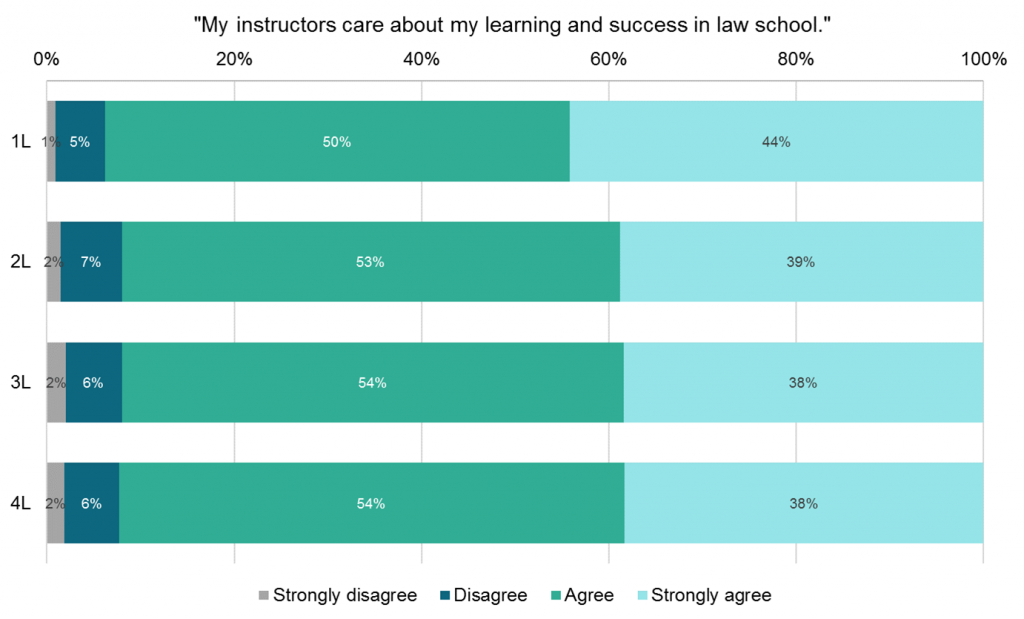
In 2018, a subset of 7,718 LSSSE respondents received the popular Learning Experiences and Professionalism (LEAP) module, which dives more deeply into students’ perceptions of both the law school community and their own readiness for legal practice. The vast majority of law school students (93%) agree or strongly agree that their instructors “care about my learning and success in law school.” Students in their first year of law school are most likely to strongly agree with this statement (44%), but overall there is not an appreciable drop in students’ sense that their instructors care about their law school experience across class years. Only 6-9% of students in any year of law school disagree or strongly disagree that their instructors care about them.
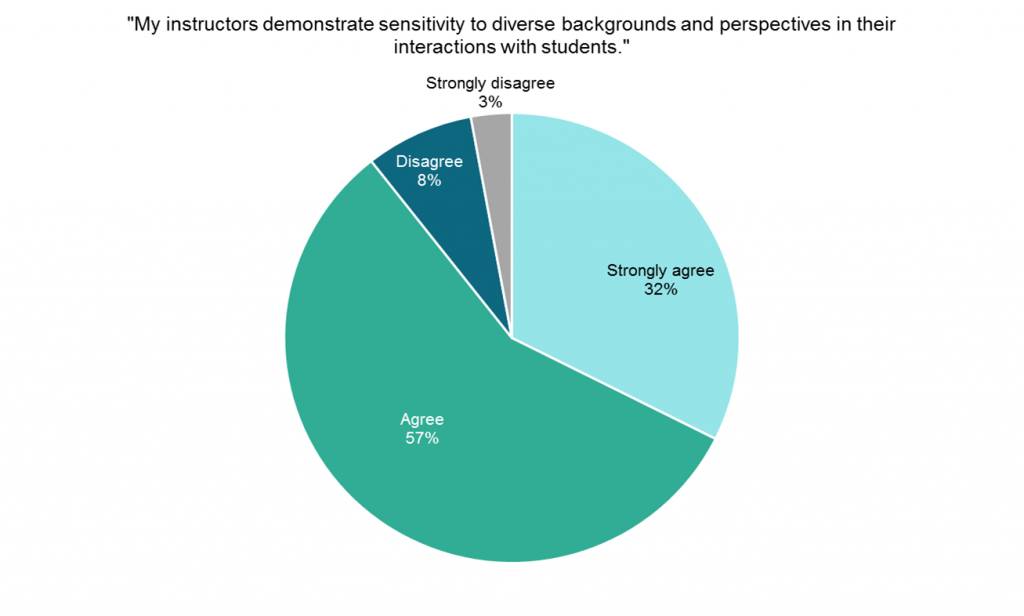
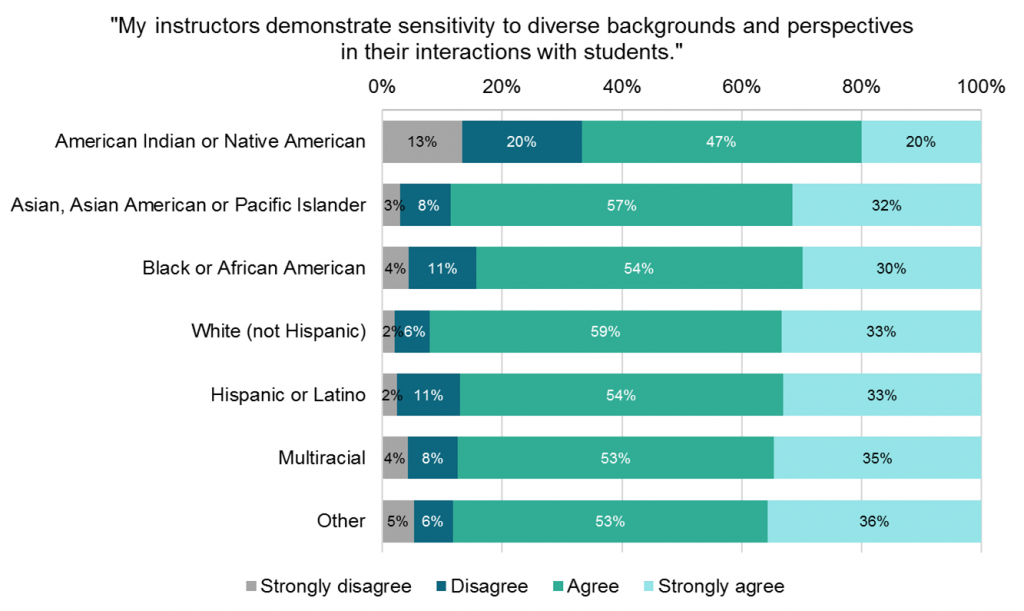
The LEAP module also asks whether student believe that their “instructors demonstrate sensitivity to diverse backgrounds and perspectives in their interactions with students." Among U.S. law students surveyed in 2018, 89% of students agree or strongly agree with this statement. There is some variation among students of different racial groups: 92% of white students agree or strongly agree that their instructors are sensitive to issues of diversity while only 67% of American Indian or Native American students share this viewpoint. This suggests that disparities still exist, particularly in how students of color perceive faculty attitudes toward diversity and how students from varying backgrounds are treated in the classroom.

Law Student Time Usage by Age
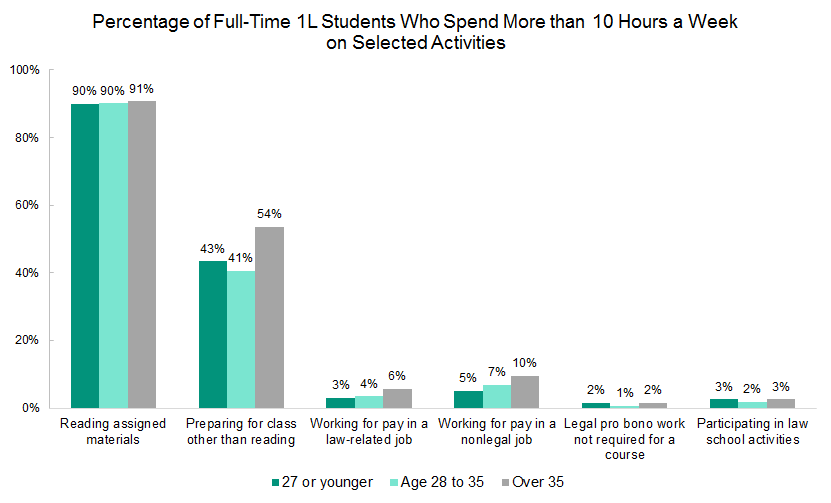
Attending law school can be a different experience for students at different life stages. Younger students who matriculate directly after receiving an undergraduate degree likely have different priorities and life experiences than older students who return to higher education after spending time in the workforce. We were interested in the academic and intellectual experiences of full-time 1L law students in the U.S. We also wanted to know how they spend their time outside the classroom. Our hope is that LSSSE data can help law schools understand the unique experiences and needs of different student populations based on age.
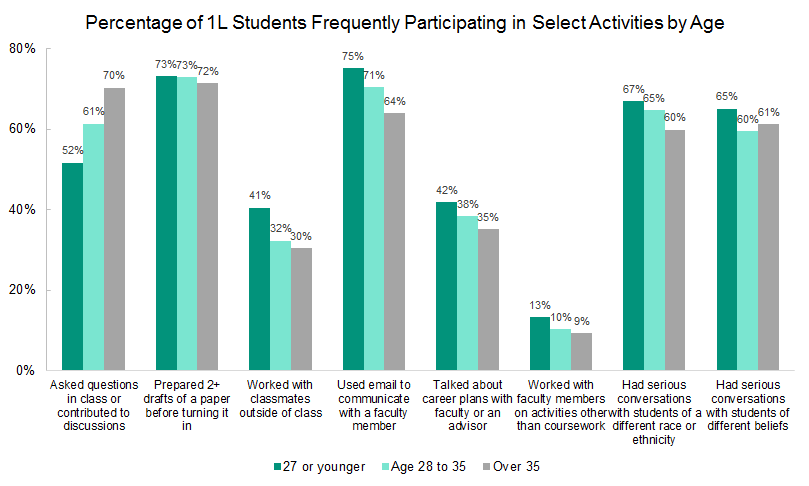
The academic experiences of younger and older students are quite different. Younger 1L students (age 27 or below) contribute less often to classroom discussions than their older peers. However, younger students are more likely to engage in email communication with faculty members and to talk about career plans with faculty or an advisor. Older 1L students (over age 35) were less likely to engage with students and faculty members outside of class. Older students were also generally less likely to have serious conversations with classmates who are different from them. However, most 1L students appear to invest heavily in their coursework regardless of age: almost three-quarters of students report frequently preparing multiple drafts of a paper before turning it in.
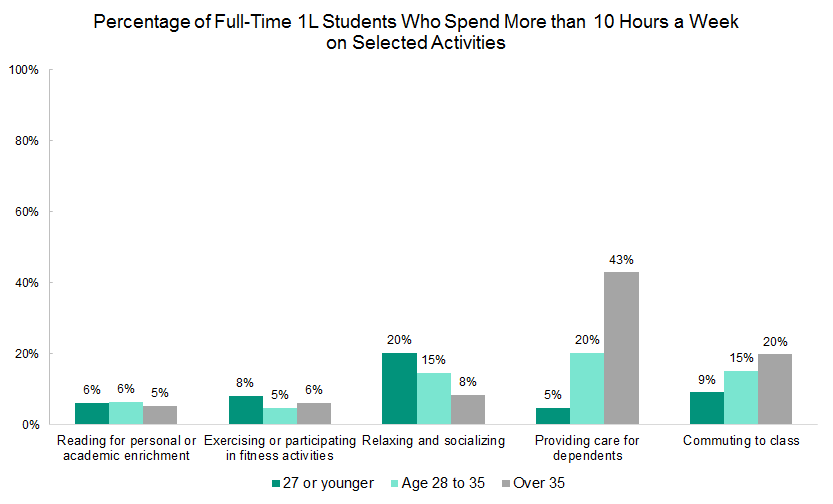
LSSSE also asks students to estimate how many hours they spend each week on various activities such as preparing for class, participating in law school activities, working for pay, socializing, and commuting to class. Different life circumstances necessitate different allocations of time and energy, and we see evidence of this among 1L students of different ages. We calculated the percentage of full-time 1L students in each age category (27 or younger, age 28-35, and over 35) who spend ten or more hours per week on each activity. Nearly all students (90%) spent more than 10 hours per week reading assigned materials, and a sizeable proportion spent more than 10 hours per week doing additional class preparation other than reading. This is particularly true for the oldest category of students. The youngest students spent more time relaxing and socializing than their older peers, although this disparity is likely accounted for by the extra time that older students spent working and providing care for dependents. The oldest group of students were also significantly more likely to have spent more than 10 hours per week commuting compared to the youngest students (20% vs. 9%), perhaps because their additional outside responsibilities made relocating closer to their law school less feasible. Finally, although the majority of full-time 1L law students spent some time participating in law school-sponsored activities each week (65%), most spent between one and five hours per week. Only a tiny fraction of each age group devoted more than ten hours per week to these endeavors.