Focus on First-Generation Students, Part 1
Our next two blog posts will provide selected snippets from the LSSSE 2024 Annual Report: Focus on First-Generation Students. To read the entire report, please visit our website.
First-Gen Demographics
First-generation (first-gen) students are trailblazers for their families. They attend college without the guidance of a parent who has completed their own bachelor’s degree. Decades of research show that first-gen students overcome significant challenges simply to gain access to college and invest even more to persist until degree completion. First-gen students tend to enter higher education with fewer financial resources and less social and cultural capital than those who have at least one parent who completed a college degree. Although first-gen students have already drawn on their resiliency and determination to adapt to college life, law school brings its own cultural norms and ways of learning that are, again, likely to be unfamiliar.
Despite these expected challenges, few studies focus on the experiences of first-gen students in law school. In 2014, LSSSE was one of the first organizations in legal education to collect data on first-gen students by adding a survey question about parental education. The data LSSSE has collected shed light on how first-gen students engage with law school and how their experiences differ from those of their non-first-gen classmates.
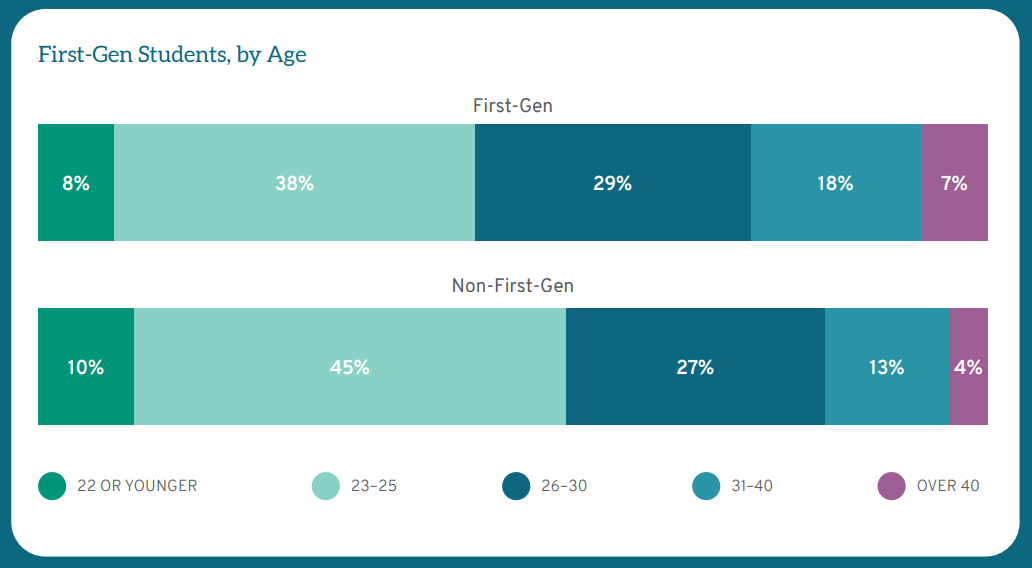
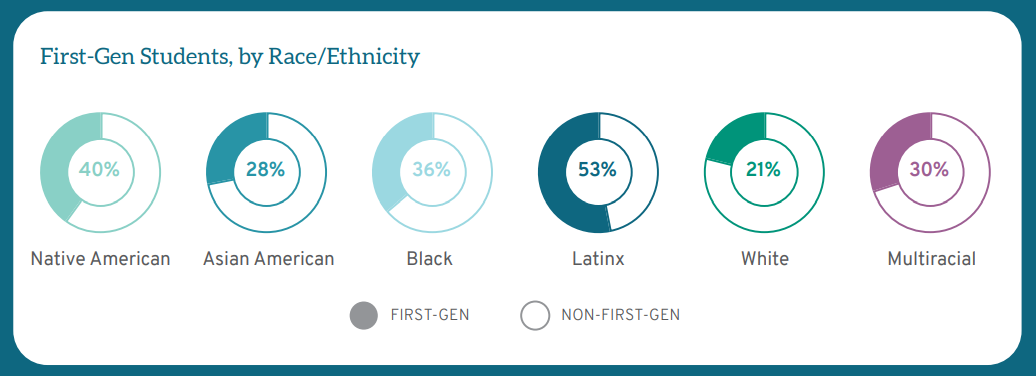
For LSSSE analyses, students who respond that neither parent received a bachelor’s degree or higher are considered first-gen students. First-gen students comprise over one-quarter (26%) of the LSSSE respondents. First-gen students tend to be different from non-first-gen students in important ways, including race, gender, age, and a full-time focus on law school. Students of color from every racial group are more likely than White students to be first-gen. For instance, 53% of Latinx respondents and 36% of Black respondents are first-gen, compared with 21% of White respondents. Twenty-eight percent (28%) of women are first-gen students compared to 24% of men. First-gen students also tend to be older, with 54% of first-gen students being over the age of 25 compared to 44% of non-first-gen students. Finally, while the vast majority of law students in the U.S. study on a full-time basis, first-gen students are more likely to study part-time by about 10 percentage points. Thus, in addition to their first-gen status, many of these students have other demographic differences from the average law student.
First-Gen Student Debt
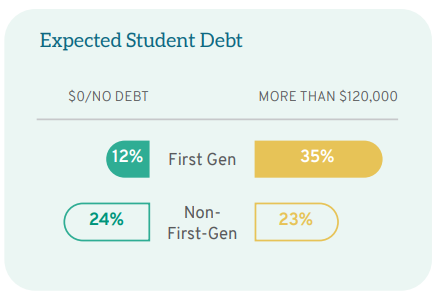
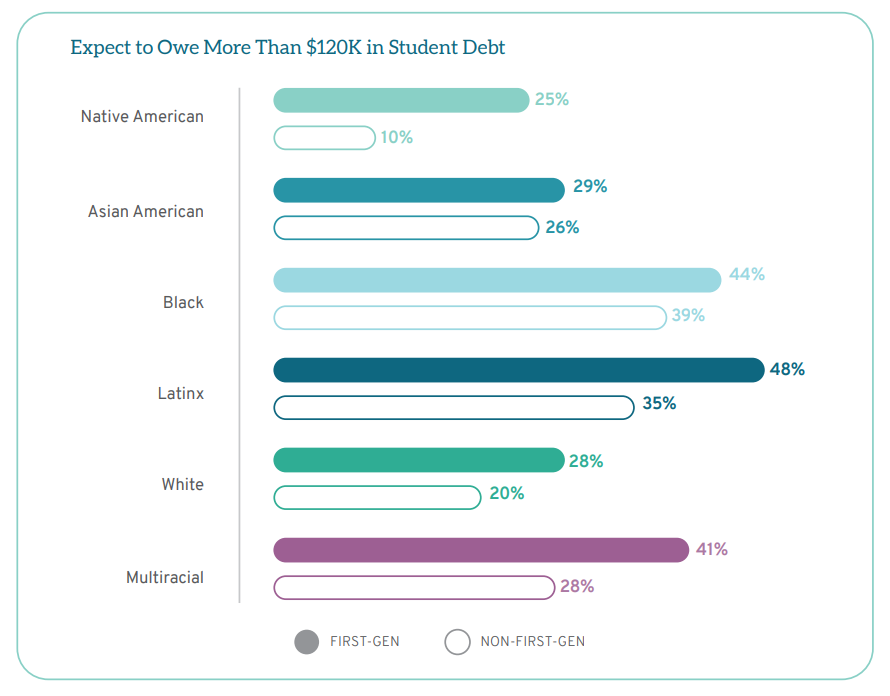
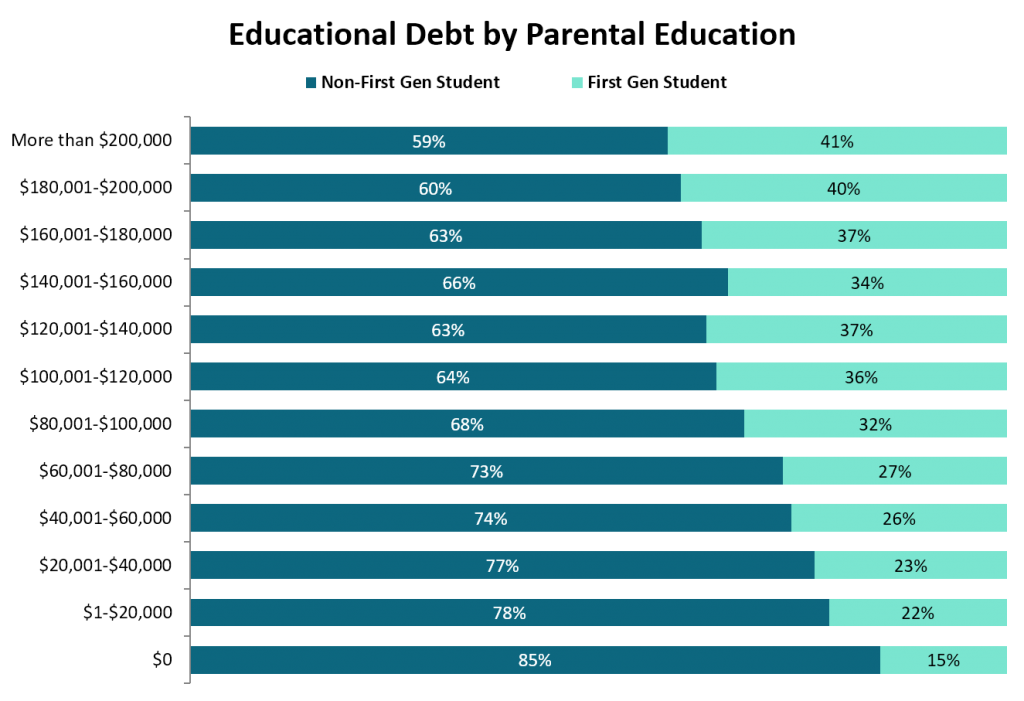
Parental education is often used as a proxy for socioeconomic status. A college degree has a significant positive impact on salary and career earnings over a lifetime. On average, first-gen students come from families that earn less than the families of students with a parent who completed college. Because first-gen students enter law school with lower undergraduate GPA and LSAT scores and because higher LSAT scores result in greater success with scholarships, first-gen students are less likely to be awarded merit scholarships in law school. As a result, first-gen students rely on student loans to a greater extent than their classmates. For instance, 24% of non-first-gen students anticipate graduating with no law school debt compared to only 12% of first-gen students. Conversely, roughly one-quarter (23%) of non-first-gen students expect to graduate with more than $120,000 in student debt compared to over one-third (35%) of first-gen students. Students from the same racial background nevertheless have significant debt differentials based on whether they are first-gen students, with first-gen students of color borrowing at particularly high levels.
First-gen students differ from their non-first-gen classmates in meaningful ways. First-gen students typically are older students, many have caretaking responsibilities, and they are more likely to come from families with fewer financial resources, necessitating working while in school. Because of these differences, first-gen students bring valuable life experiences and diverse perspectives to classroom conversations. Once they complete law school, they are also equipped to bring the fruits of their legal education back to their communities. The hard work and determination that first-gen students bring to law school is nonetheless coupled with higher levels of debt than their non-first-generation peers. This creates an additional burden not only during law school but as they choose their first jobs as lawyers and continue their legal careers.
In our next blog post, we will examine how first-gen law students use their time and the degree to which they engage with different aspects of the law school experience.

Better than BIPOC
 Meera E Deo, JD, PhD
The Honorable Vaino Spencer Professor of Law, Southwestern Law School
Director, Law School Survey of Student Engagement (LSSSE)
We should be precise with our language, especially when talking about race. In “Better than BIPOC,” I argue that BIPOC is a flawed term for empirical scholars to use, one that prioritizes historical oppression over ongoing realities and relies on virtue signaling rather than working toward meaningful change. In my previous essay “Why BIPOC Fails,” I explain how BIPOC can be misleading, confusing, and contribute to the invisibility of the very groups that should be centered in particular contexts. Thus, without the deep investment of community engagement and review, new labels—like BIPOC—run the risk of causing more harm than good. Instead, we should continue to use the term “people of color” when referencing this group in comparison to whites, while “women of color” is useful when considering raceXgender intersectionality. Banding together for mutual support and action has been critical for people from marginalized identities as they have worked toward lasting social change. Additionally, it is often important to disaggregate data to report on individual groups that could otherwise get lost under these larger umbrella terms.
The experiences of various communities in law school help illustrate the point that academics, advocates, and allies should use be careful in their language usage—especially when dealing with data. Grouping populations together is often instructive. It can also be necessary to disaggregate the data to deal with separate communities individually. Law student debt and experiences with issues of diversity are particularly instructive in explaining both paths.
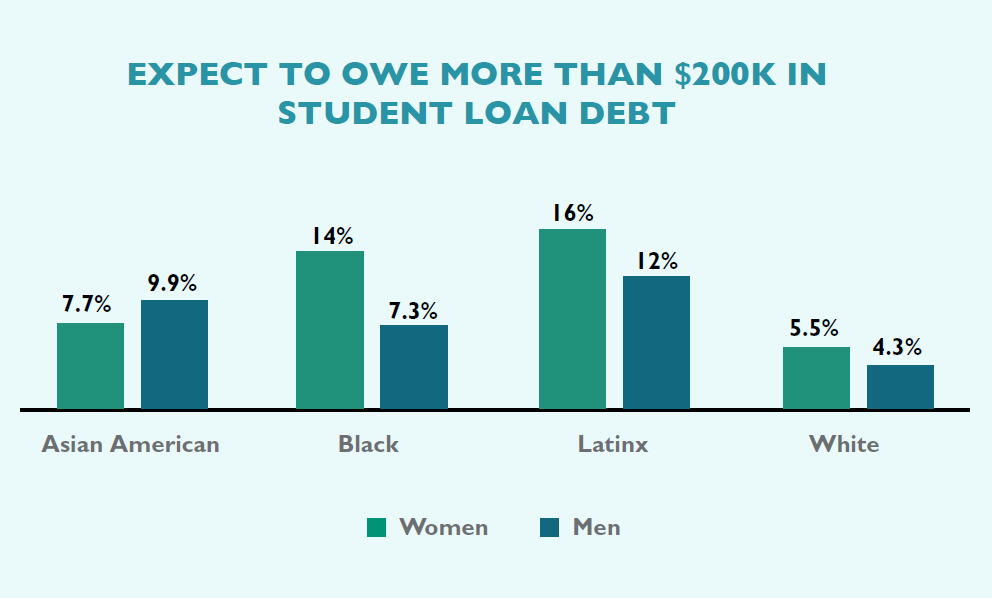
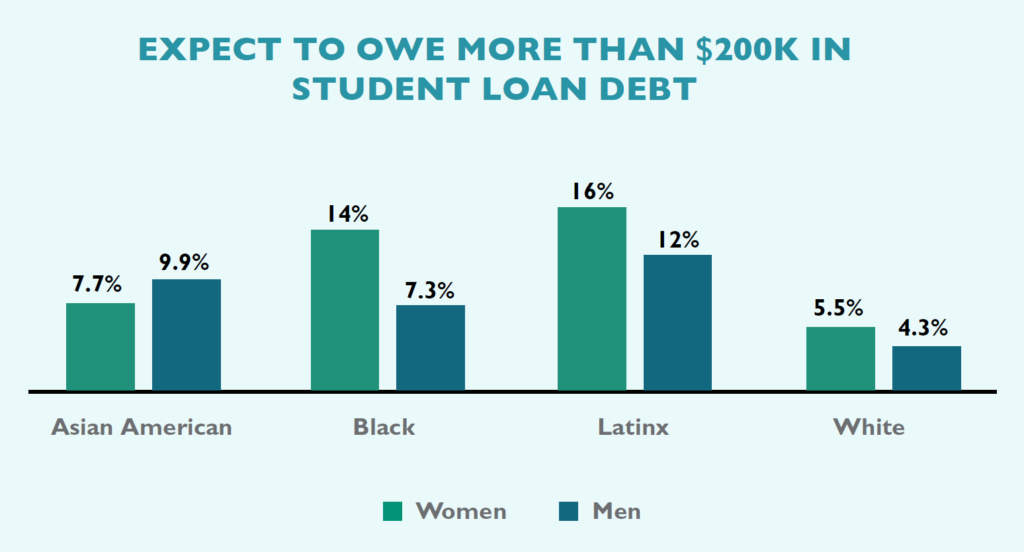
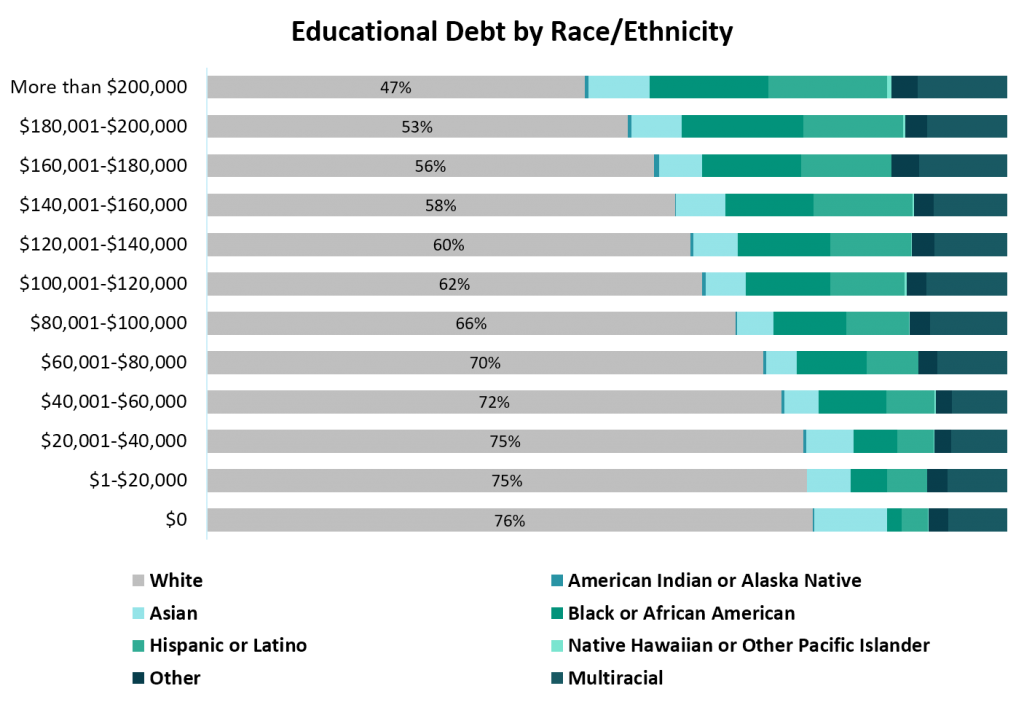
First, LSSSE data reveal that students of color carry more educational debt than white students. Here, it is appropriate and useful to group students of color together as a whole in comparing them with white students in terms of their overall debt loads. However, we can dig deeper to consider the intersectional experience of gender combined with race. If we ignore gender in this context, we run the risk of masking the distinct experiences of women of color compared with men of color as well as other groups. And there are differences. As I write in the article, “[H]igher percentages of Women of Color (23%) graduate with over $160,000 in law school debt, as compared with Men of Color (18%), white women (15%), and white men (12%).” While examining debt by raceXgender is thus more useful than considering race alone, being even more precise with the data and our language provides an opportunity to reveal more nuanced realities for communities within the women of color umbrella. As we share in our 2019 LSSSE Annual Report, The Cost of Women’s Success, the raceXgender groups most likely to carry the highest debt loads of over $200,000 are Latinas (16%) and Black women (14%), compared to lower percentages of Asian American women (7.7%), Black men (7.3%), Latino men (12%), and white men (4.3%). Thus, while it is correct to talk about the people of color and women of color carrying more debt than whites and those who are not women of color, it is more complete and sophisticated to explain how particular raceXgender groups—Black women and Latinas—have the highest debt loads of all. Precise racial language is instructive, particularly if we seek to craft solutions to ameliorate these challenges that are directly responsive to the needs of the populations affected.
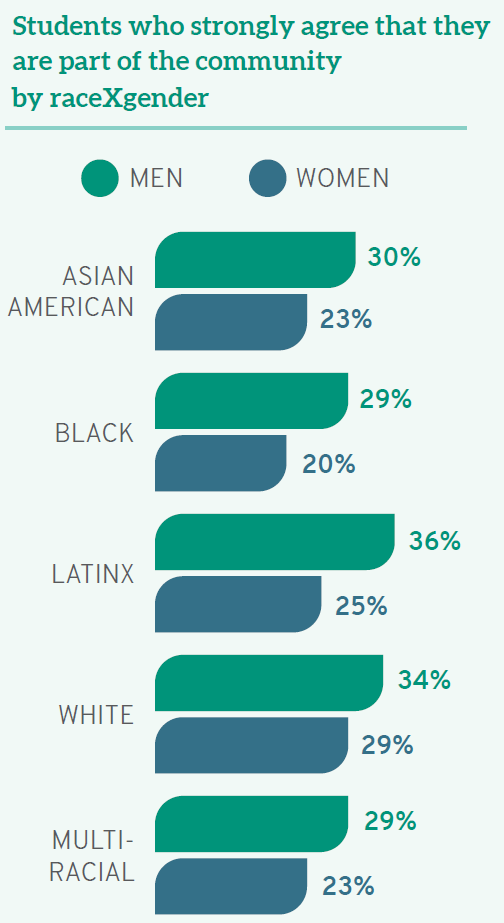
Student experiences with diversity provide another example of the benefits of careful language usage. Compared to their white peers, students of color have distinct opinions and experiences in law school when considering issues of diversity, equity, and inclusion. For example, although almost one-third (31%) of white law students “strongly agree” that they see themselves as part of the law school community, students of color are less likely to agree. As with debt levels, there are again additional distinctions based on raceXgender. In Better than BIPOC, I draw on data from the LSSSE 2020 Annual Report, Diversity & Exclusion, noting, “Fewer than one-quarter (23%) of women of color ‘strongly agree’ that they are part of the institutional community, compared to almost one-third (31%) of men of color.” Thus, distinctions based on race alone are not as precise as those disaggregating racial data by gender. In certain contexts, we also can—and should—go further still. By looking within the category of people of color, we can determine important differences between groups that administrators, faculty, and staff should consider in order to tailor solutions to the students who most need them. For instance, when we consider student belonging, “only 21% of Native American and Black law students see themselves as part of their law school community—compared to 31% of their white classmates, 25% of multiracial students, 26% of Asian Americans, and 28% of Latinx students.” Considering the student of color narrative as one group would tell an incomplete story as Black and Native law students are even more alienated nationally than even other students of color. Addressing their concerns will require us first to understand them, then to act.
Better than BIPOC also draws from the data behind my book project, Unequal Profession: Race and Gender in Legal Academia, to share examples from the law faculty context. I use findings on student evaluations and the challenges different populations face while navigating work/life balance to suggest when we should compare faculty of color as a whole to their white colleagues, when to disaggregate by race as well as gender to examine the experience of women of color faculty, and when to look more carefully within racial and gender-based categories to reveal important distinctions that could otherwise be hidden. Beyond the context of legal education, we can apply this thesis to frameworks as diverse as political engagement, workplace harassment, elementary school integration, diversity in corporate boards, and more. Different situations will naturally call for specific groups to be named and studied directly; that context, regardless of the terms currently en vogue, should drive the data used and arguments made in any endeavor. Working collectively serves a purpose, as does disaggregating the data. Through both efforts, we can understand the unique challenges facing different groups and work collectively to address them.

First Generation College Students Bear More Law School Debt
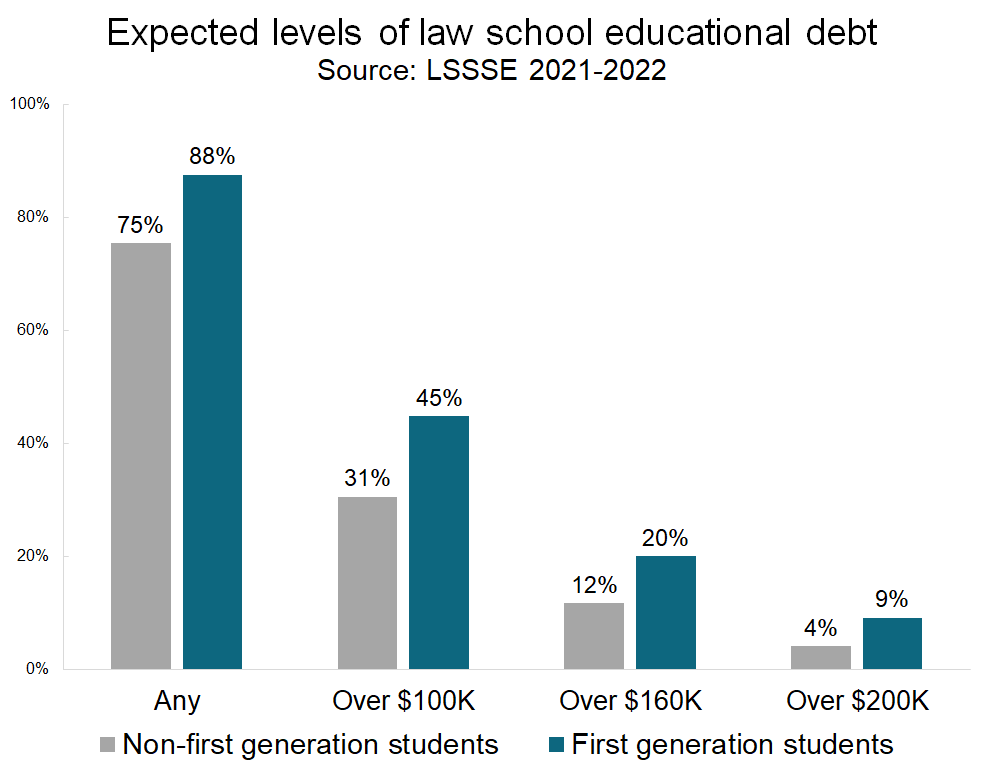
First generation law students, defined as those students who do not have at least one parent with a bachelor’s degree, face unique hurdles in higher education. In addition to navigating an unfamiliar cultural landscape, first generation students may be particularly challenged by financial concerns and student debt. In fact, although 75% of non-first generation law students expect to have some debt from attending law school, that number climbs to 88% for first generation students.
Additionally, the total dollar amount owed in student debt tends to be higher for first generation students. LSSSE 2021 and 2022 survey data show that first generation law students expected to owe an average of $96,000 compared to $71,000 for their non-first generation classmates. Around 45% of first generation students expected to owe over $100,000, but only 31% of non-first generation students expected to have loan balances that high. Shockingly, first generation students are twice as likely as their non-first generation peers to owe more than $200,000, which is the highest debt category recorded by LSSSE. Only four percent of non-first gen students fall into this category, compared to a full nine percent of first gen students.
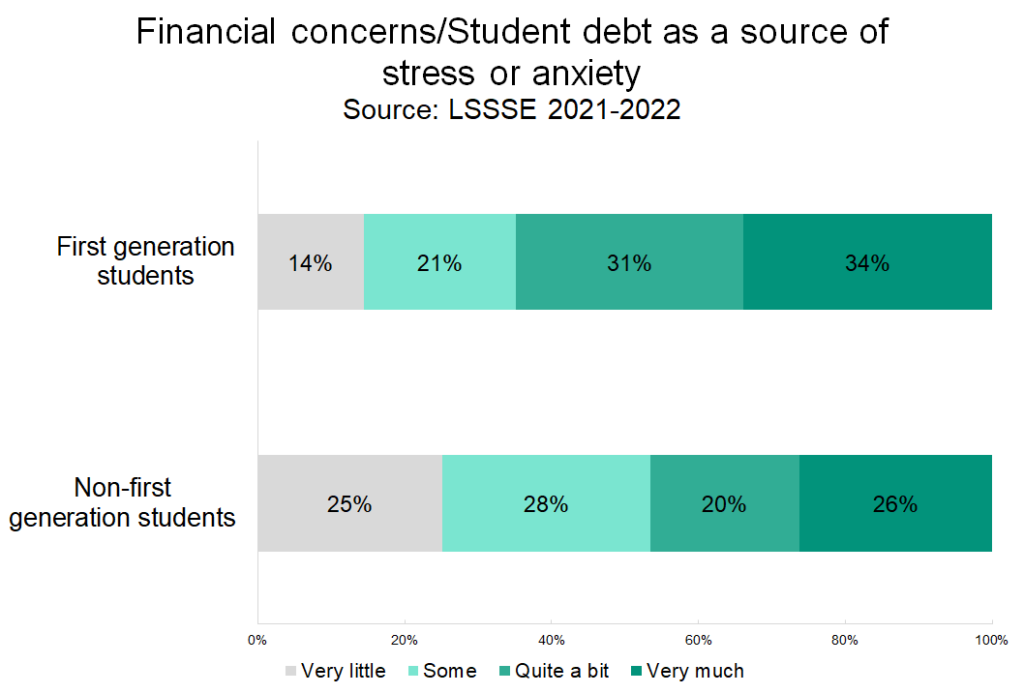
The differing financial picture for these groups of students takes an emotional toll. Although first gen and non-first gen students report similar stress levels related to law school (about 84% rank their stress a 5 or higher on a 7-point scale), two-thirds of first gen students say that financial concerns and student debt are a big source of stress or anxiety compared to less than half (46%) of non-first gen students.

How Many Law Students Are Following in Their Lawyer Parent’s Footsteps?
Why and how do people choose their course of study and their future career? While status, compensation, and personal values likely play an important role in choosing a career, there may also be an influence of family tradition. We used LSSSE data from 2019 and 2020 to ask how many law students have at least one lawyer parent and to see whether these students differ in appreciable ways from their classmates who were not raised by a lawyer.
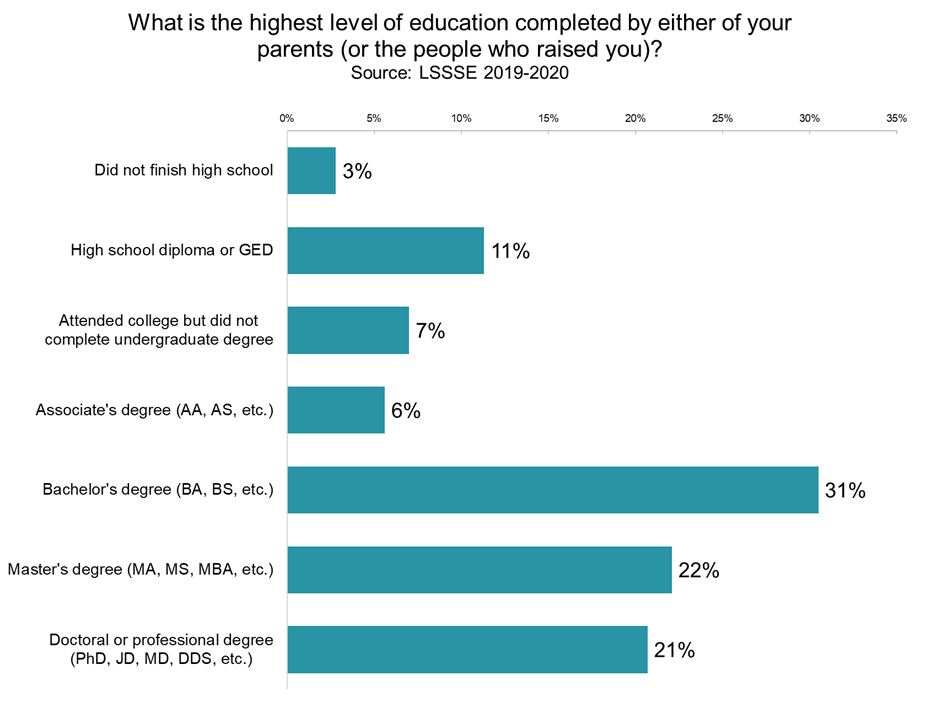
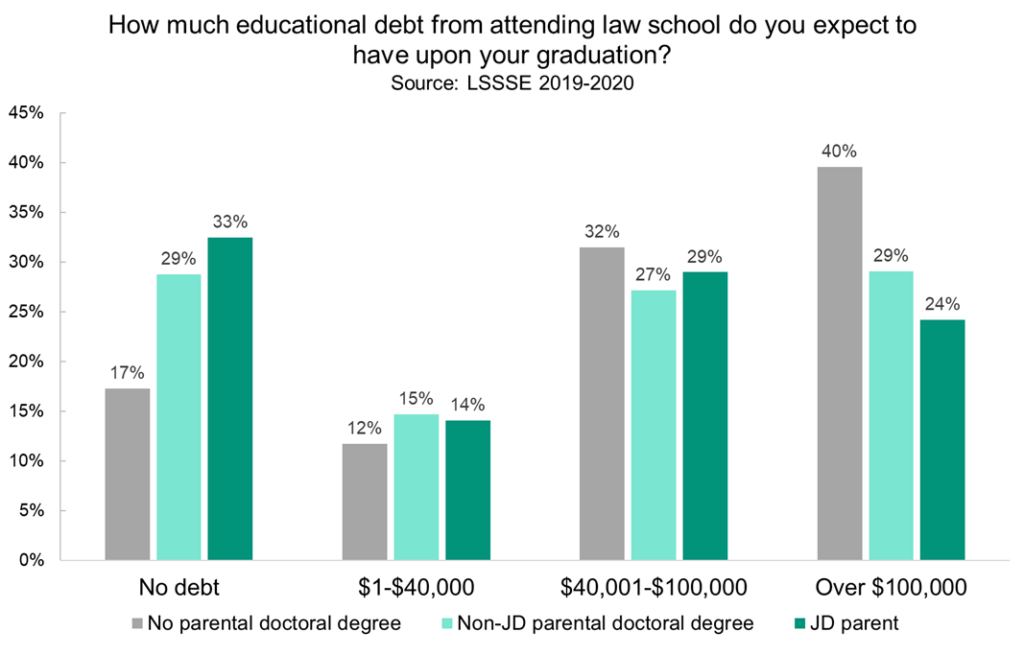
Law students tend to have educated parents. Around 73% of LSSSE respondents have at least one parent with a bachelor’s degree or higher. One in five students (20%) have at least one parent with a doctoral or professional degree (PhD, JD, MD, DDS, etc.), and among those students, just over half (53%) report that the doctoral degree is a JD. Overall, 11% of LSSSE respondents have a parent with a JD.
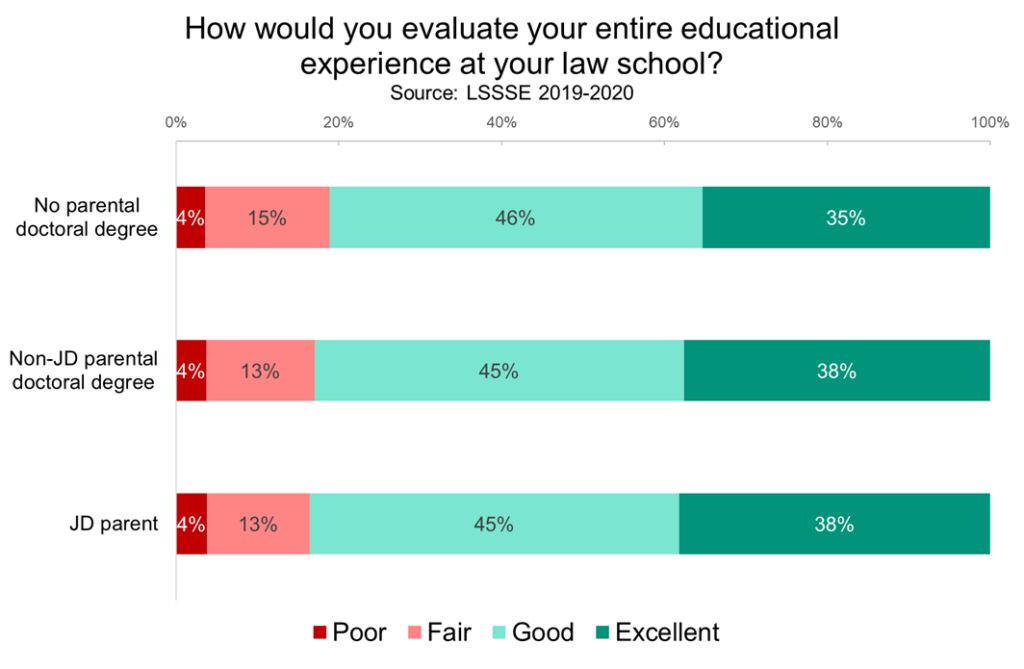
By and large, law students are satisfied with their experiences at law school, and we see minimal differences in satisfaction by parental education. If we combine “good” and “excellent” ratings, satisfaction is 84% among students who have at least one parent with a JD, 83% among students who have at least one parent with a different doctoral degree, and 81% among students whose parents do not have doctoral degrees. Students who have at least one parent with a doctoral degree may be slightly more likely to choose the highest rating (38% vs. 35% among students with non-doctorate parents).
We do, however, see large differences in expected law school debt based on parental education. Students with less educated parents are much more likely to expect to owe more than $100,000 upon graduation and much less likely to graduate debt-free than their classmates with more educated parents. On some level, this may make sense, given that parental education is a strong predictor of a students’ socioeconomic status. However, it remains deeply problematic given that law school debt disadvantages students from lower income households and minimizes upward economic mobility, particularly among students of color. Interestingly, compared to their counterparts whose parents have non-JD doctoral degrees, students with JD parents are still less likely to owe over $100,000 and are more likely to graduate debt-free. If we assume socioeconomic status is roughly equivalent among parents with doctorates, then there may be some advantage to having a lawyer parent, either by increased parental investment in the students’ education or by a keener insight into navigating the process of financing a legal education.

LSSSE Annual Results 2019: The Cost of Women’s Success (Part 3)
Opportunities for Improvement
Given the many challenges facing women upon entry to law school, it is no surprise that there are also opportunities to improve the experience for women students in legal education. LSSSE data on concepts as varied as classroom participation, caretaking, and debt make clear that women need greater support.
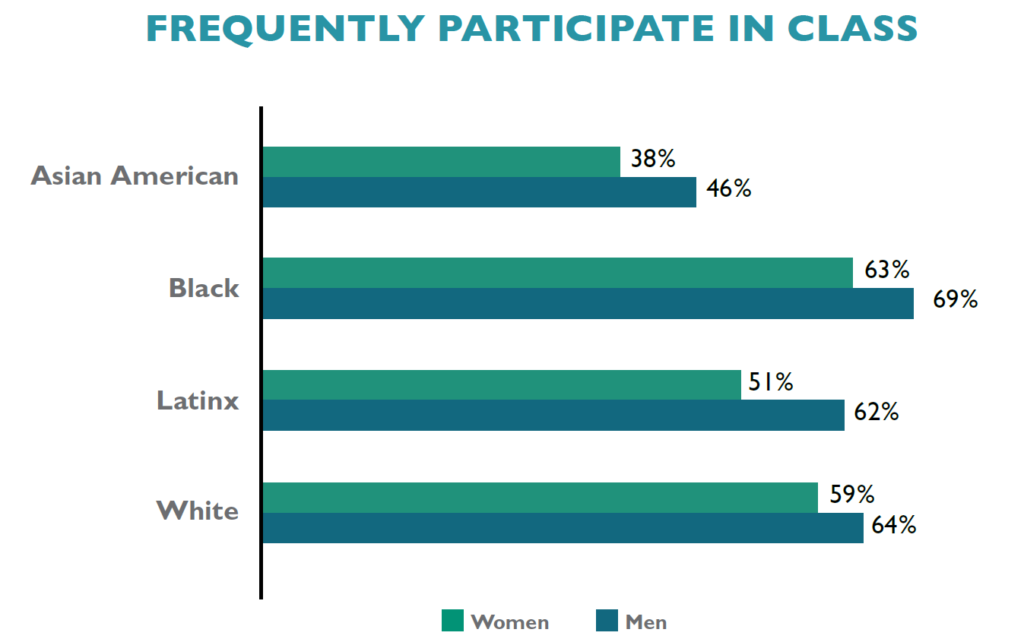
Engagement in campus life is an especially significant indicator of success. Law students who are deeply invested in both classroom and extracurricular activities tend to maximize opportunities for success overall. As stated in a previous post, women are just as likely as men to be involved in various co-curricular endeavors. Yet, smaller percentages of women than men are deeply engaged in the classroom. While 64% of men report that they “Often” or “Very Often” ask questions in class or contribute to class discussions, only 58% of women do. This gender disparity remains pronounced within every racial/ethnic group, as men participate in class at higher rates than women from their same background. There are also interesting variations by raceXgender, with Black men frequently participating at higher rates than any other group (69%), and at almost twice the rate of Asian American women (38%).
Many women students also spend numerous hours during their law school careers providing care to household members. For instance, 11% of women report that they spend more than 20 hours per week providing care for dependents living with them, as do 8.6% of men. These competing responsibilities require a significant investment of time, which could otherwise be spent on studying for class, working with faculty on a project outside of class, or even engaging in leisure activities. Instead, these students are taking care of their families.
An especially troubling discovery is that high percentages of women than men incur significant levels of debt in law school. Among those who expect to graduate from law school with over $160,000 in debt are 19% of women and 14% of men. This gender difference remains constant within every racial/ethnic group. Even more alarming is the disparity among those carrying the highest debt loads: 7.9% of women will graduate from law school owing over $200,000 as compared to 5.5% of men. LSSSE data not only confirm existing research on racial disparities in educational debt, with people of color and especially Black and Latinx students borrowing more than their peers to pay for law school, but also reveal that women carry a disproportionate share of the debt load as compared to men. Furthermore, when considering the intersection of race/ethnicity and gender, we see that women of color specifically are graduating with extreme debt burdens.
Next week, we will conclude this series with some troubling trade-offs that women make to overcome the disadvantaged position in which they often find themselves relative to their male counterparts. You can read the entire LSSSE 2019 Annual Results The Cost of Women’s Success (pdf) on our website.

Guest Post: Paying for Law School and the Public Service Loan Forgiveness Program
 Guest Post by CJ Ryan, J.D., Ph.D.
Associate Professor of Law, Roger Williams University School of Law
Affiliated Scholar - American Bar Foundation
Legal education in 2019 is a costly proposition for most law students. The average cost of tuition and fees at private law schools was $49,095 and $40,725 at public law schools, for out-of-state students, in the 2018-2019 academic year, to say nothing of living expenses and other costs that students pay out of pocket.[1] As a result, many law school graduates carry significant student loan debt upon completing their studies. In fact, the average amount borrowed by law school graduates totaled $115,481 for the graduating class of 2018.[2]
When discussing student loan debt, it is easy to fixate on the aggregate impact of the burdens this debt places on tax payers, the economy, and borrowers alike, such as the depressive effects that law school loan debt has on homeownership and entrepreneurship.[3] Yet, a discussion of which graduates are saddled with the largest student loans is often absent from conversations about student debt.
The results of the 2018 Law School Survey of Student Engagement (LSSSE) reveal that students from the lowest socio-economic backgrounds, as proxied by parental education, expect the greatest debt loads upon graduating from law school. In fact, among students expecting to owe between $180,000 and $200,000, 40% of these students have parents whose highest level of educational attainment was less than a baccalaureate degree, and the proportion jumps to 42% of students who expect to owe more than $200,000 in student loans from attending law school. Thus, unsurprisingly, students from the lowest socio-economic backgrounds borrow the most to finance their legal education and, perhaps as a result, are on the hook for the largest debt sums.
Furthermore, students from racial minority groups account for the largest expected law school debt loads. Of the students surveyed by LSSSE who expected to owe more than $200,000 in law school loans following their graduation, 53% identified with a racial group other than White. Thus, the disparate impact of the highest law school loans is greatest among racial minorities.
Fortunately, income-based repayment options for student loans make paying back significant debt loads for law school graduates more manageable. One repayment option, the Public Service Loan Forgiveness (PSLF) program, even forgives borrowers a portion of their student loan debt, subject to paying into the program for 10 years of full-time employment with a government organization, or a qualifying public service or tax-exempt organization under Section 501(c)(3) of the Internal Revenue Code.[4] However, the future of the PSLF remains uncertain, as the Department of Education, as well as President Trump, have announced plans to eliminate PSLF.[5]
In the fall of 2017, I administered the Law School Choice Survey at four law schools: a private elite law school; a public flagship law school; a public regional law school; and a private new law school.[6] The response rate within this sample of law students was quite robust—45%, 34%, 40% and 43%, respectively—and respondents to the survey were representative of their law school’s entire population on the basis of race and gender, within two%, in each category.[7] The survey queried current law students about their career aspirations and whether they planned to take advantage of the PSLF program to repay their student loans. Responses from students at the public flagship law school indicated that 16% of White students planned to enroll in or were already enrolled in PSLF, but 20% of the African-American students and half of the Hispanic/Latino students planned to enroll in or were already enrolled in PSLF. At the public regional law school, nearly 29% of White students indicated that they planned to enroll in or had already paid into PSLF, but half of the Hispanic/Latino students and 70% of African-American students planned to enroll in or had already paid into PSLF. At the private new law school, 33% of African-American students and over 35% of White students surveyed indicated that they plan to avail themselves of PSLF.[8] Furthermore, nearly 77% of students at the public flagship law school, and over 55% of students at the public regional and private new law schools, with expected law school loan debt exceeding $100K, indicated that they plan to enroll or were enrolled in PSLF. These results demonstrate that a significant proportion of racial minority students, as well as their White counterparts, and students with the greatest expected debt loads view the PSLF as their primary recourse for repaying their law school loans.
Likewise, 40% of the students whose parents earned a combined income of less than $50,000 annually plan to enroll or were already enrolled in the PSLF program at the public flagship law school. At the public regional law school, over 21% of students whose parents earned less than $50,000—but more than 44% of the students who parents earned less than $60,000 annually—are counting on the PSLF program. And over 58% of the students whose parents earned less than $50,000 annually at the private new law school indicated that they plan to use or are enrolled in the PSLF to repay their student loans.
Additionally, over 35% of students who planned to enter a career in traditional public interest sectors indicated that they planned to or had already enrolled in PSLF.[9] More than 54% of students who sought a career in a public interest sector at the public regional law school indicated that PSLF was a part of their loan repayment plans. And over 30% of students at the new private law school who plan to enter a career in the public interest sector reported that they plan to repay using PSLF.
Taken together, these results suggest that that the students who most need relief for their substantial law school loans—students from lower socio-economic backgrounds, students from diverse racial backgrounds, students considering careers in public interest law, and students carrying the highest debt loads, most of whom are the same students across these four categories—are the students most likely to enroll in the PSLF program. Thus, despite the administrative challenges associated with the PSLF program,[10] it has succeeded in attracting law graduates to careers in the public interests, and particularly racial minority law graduates.[11] As such, it presents the most viable path to ensuring diversity in the legal profession, in terms of socio-economic status and race, but it also has substantial implications for ensuring access to justice. PSLF provides an important pathway for lawyers willing to serve in public interest roles, often at dramatically lower salaries than their peers who pursue careers in the private sector, to repay their loans, while helping to address the unmet demand for legal services for those with the greatest need in our society.[12] To eliminate the PSLF program, and these important goals that it accomplishes, would be a mistake.
____
[1] See, e.g., Ilana Kowarski, See the Price, Payoff of Law School before Enrolling, U.S. News & World Report, March 12, 2019, https://www.usnews.com/education/best-graduate-schools/top-law-schools/articles/law-school-cost-starting-salary.
[2] Law School Costs, Law School Transparency, https://data.lawschooltransparency.com/costs/debt/.
[3] Alvaro Mezza, Daniel Ringo, and Kamila Sommer, Can Student Loan Debt Explain Low Homeownership Rates for Young Adults?, Federal Reserve Board, January 2019, https://www.federalreserve.gov/publications/files/consumer-community-context-201901.pdf; see also, Vadim Revzin and Segei Revzin, Student Debt Is Stopping U.S. Millenials from Becoming Entrepreneurs, Harvard Business Review, April 26, 2019, https://hbr.org/2019/04/student-debt-is-stopping-u-s-millennials-from-becoming-entrepreneurs.
[4] The Public Service Loan Forgiveness Program, Federal Student Aid, https://studentaid.ed.gov/sa/repay-loans/forgiveness-cancellation/public-service#qualifying-employment.
[5] Zack Friedman, Trump Proposes to End Student Loan Forgiveness Program, Forbes, March 12, 2019, https://www.forbes.com/sites/zackfriedman/2019/03/12/trump-proposes-to-end-student-loan-forgiveness-program/#3cb3d8e5415e.
[6] See Christopher J. Ryan, Jr., Analyzing Law School Choice, 2020 Ill. L. Rev. ___ (forthcoming 2020), available at https://papers.ssrn.com/sol3/papers.cfm?abstract_id=3309815. As a condition of their participation in the survey, the law schools at which the survey was administered asked to remain anonymous and only be identified by descriptive terms. The administration at the private elite law school would not permit me to ask whether students at the law school were planning to enroll or had already paid into the PSLF program; however, all other survey questions were common between law schools.
[7] See id.
[8] Curiously, no Hispanic/Latino students surveyed at the new private law school indicated that PSLF was included in their loan repayment plans but both of the Asian-American law students surveyed indicated that they planned to enroll or were enrolled in the PSLF program. However, it should be noted that the private new law school is not terribly diverse in terms of race.
[9] These law career sectors included: children’s law/ juvenile justice; civil liberties and civil rights; criminal law; education law; employment/labor law; family law; general legal services; government law; housing law; immigration law; and public interest law.
[10] Zack Friedman, 99.5% of People Are Rejected for Student Loan Forgiveness Program, Forbes, January 3, 2019, https://www.forbes.com/sites/zackfriedman/2019/01/03/student-loan-forgiveness-data/#14c9cb3e68d0.
[11] See, e.g., Public Service Loan Forgiveness Data, Dept. of Educ., March 2019, available at https://studentaid.ed.gov/sa/about/data-center/student/loan-forgiveness/pslf-data.
[12] For example, it is estimated that legal aid lawyers “are estimated to provide just 1 percent of the total legal needs in the United States each year[.]” Three Ways to Meet the “Staggering” Amount to Unmet Legal Needs, Am. Bar Ass’n J., June 26, 2018, https://www.americanbar.org/news/abanews/publications/youraba/2018/july-2018/3-ways-to-meet-the-staggering-amount-of-unmet-legal-needs-/.

Preferences & Expectations for Employment After Law School by Student Debt Level
The newly released LSSSE 2017 Annual Results explore the relationship between students’ preferred and expected work settings post-graduation. Our most recent post looked at the settings in which male and female student prefer and expect to work. In the final post in this series, we examine how students with varying debt levels approach the question of where they prefer and expect to work after graduation.
The role of student loan debt is important to consider in the context of student career preferences and expectations because earning potential varies tremendously across work settings within the legal profession. LSSSE asks respondents to estimate the amount of law school debt they expect to incur by graduation. Forty percent of respondents who expect to owe more than $200,000 prefer to work in a public service setting, the highest proportion of all student debt groupings. At 31%, respondents who expect no debt are least likely to prefer working in public service.
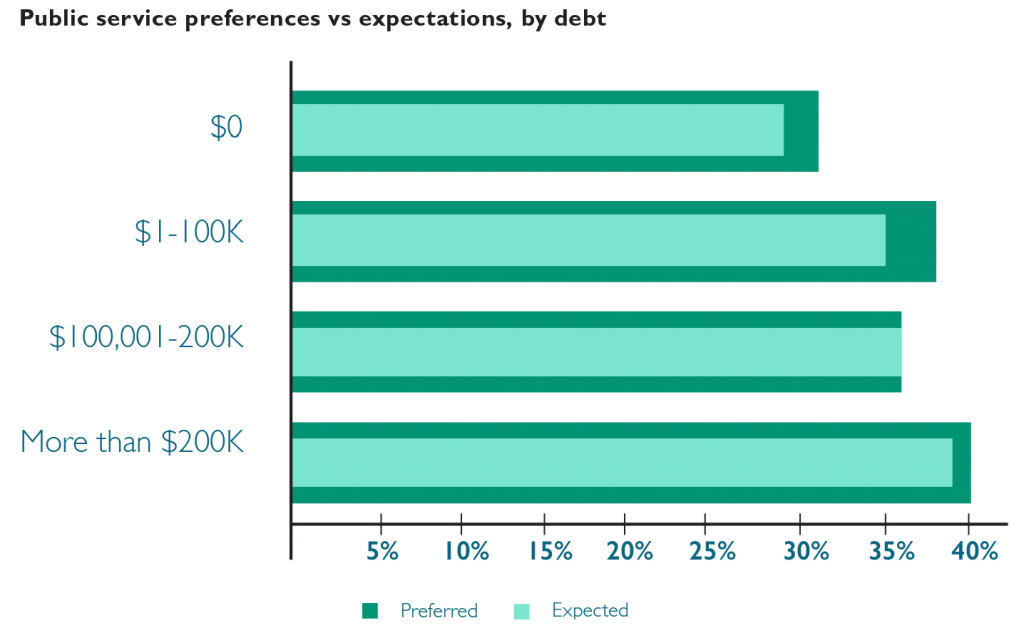
Expectations of working in public service decrease slightly relative to preferences for each of the student debt groups; but expectations of working in public service increase with expected debt. There is no evidence of high levels of expected debt prompting respondents who prefer public service settings to nonetheless expect to work in private settings (due to the prospect of higher pay). In fact, respondents who expect to owe more than $200,000 are most likely to prefer and expect to work in public service settings. Respondents expecting to owe more than $100,000 are mostly likely to prefer to work in private settings but expect to work in public service.
The motivation for pursuing legal work in one setting versus another is likely driven by a variety of factors rather than simple personal economics. The promise of programs like Public Service Loan Forgiveness (PSLF) may temper the negative financial ramifications of pursuing lower-paying public service careers among students in the highest student debt groupings. The relative popularity of public service work among Black and Latinx students coupled with the disproportionate student loan burden (pdf) shouldered by these students is likely another contributing factor to the trends we see here.

Trends in Preferences & Expectations for Employment After Law School
The newly released LSSSE 2017 Annual Results explore the relationship between students’ preferred and expected work settings post-graduation. In a series of related blog posts, we will share tidbits of information about where law students hope to work, where they expect to work, and how these preferences and expectations vary by race and gender. In our final post, we will look at patterns in students’ preferred and expected work settings relative to their projected levels of student loan debt.
LSSSE asks respondents to identify the setting in which they would most prefer to work after graduation and the setting in which they most expect to work. Preferences can be seen as representing a respondent’s ideal outcome; expectations can be seen as representing perceptions of a realistic outcome. For both questions, respondents are asked to choose between sixteen answer options.
For purposes of much of the analyses in this report, the answer options were divided into two broad groups:
Public Service Settings
- Academic
- Government agency
- Judicial clerkship
- Legislative office
- Military
- Prosecutor’s office
- Public defender’s office
- Public interest group
Private Settings
- Accounting firm
- Business and industry
- Nonlegal organization
- Private firm – small (fewer than 10 attorneys)
- Private firm – medium (10-50 attorneys)
- Private firm – large (more than 50 attorneys)
- Solo practice
The “Other” response was removed from our analysis. The primary factor underlying the assignment of an answer option to one of the two groupings was whether a person working in that setting would likely qualify for Public Service Loan Forgiveness (PSLF), which typically requires one to be employed in the government or non-profit sector. There is naturally some imprecision in the assignments.
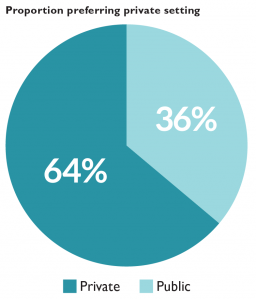
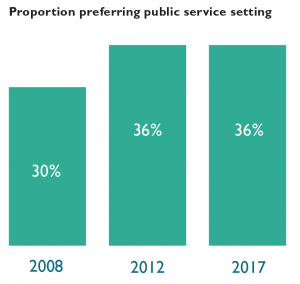
Sixty-four percent of respondents indicate a preference for working in one of the private settings, with the remaining 36% preferring public service. This proportion is unchanged from five survey administrations ago (2012) and higher than the 30% public service proportion ten administrations ago (2008).
Seventeen percent of respondents would prefer to work in medium-sized law firms, making this category the most popular private setting and the most popular setting overall. Government agencies are the most popular public setting, with 11% of respondents indicating that preference. Medium-sized law firms are also the most commonly expected private work setting, accounting for 20% of respondents. Small law firms are the fourth most preferred private setting yet the second most common expected setting. Government agencies are the most commonly expected public service setting.
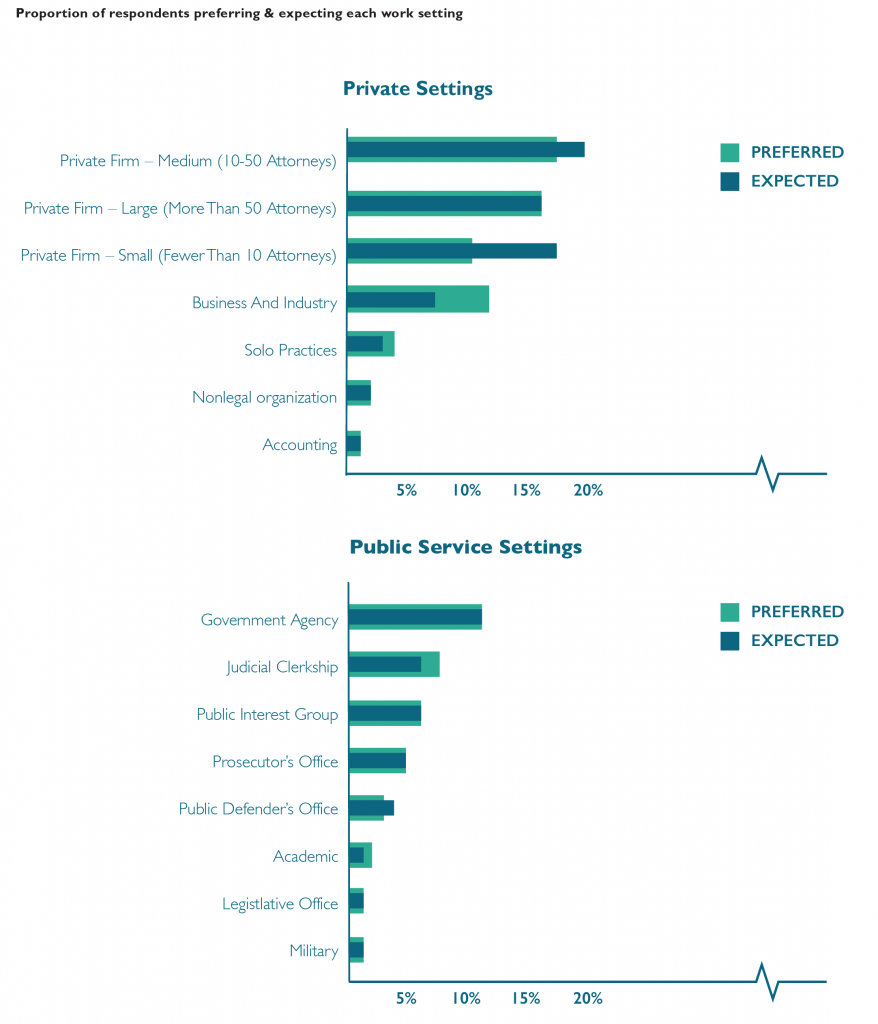
Forty-four percent of respondents indicate a different expected work setting than their preferred setting. Respondents who prefer to work in an academic setting are least likely to expect to work in that setting, with only about one-in-five matching preference with expectation. Respondents who prefer to work in large law firms or as prosecutors are most likely to also expect to work in those settings.
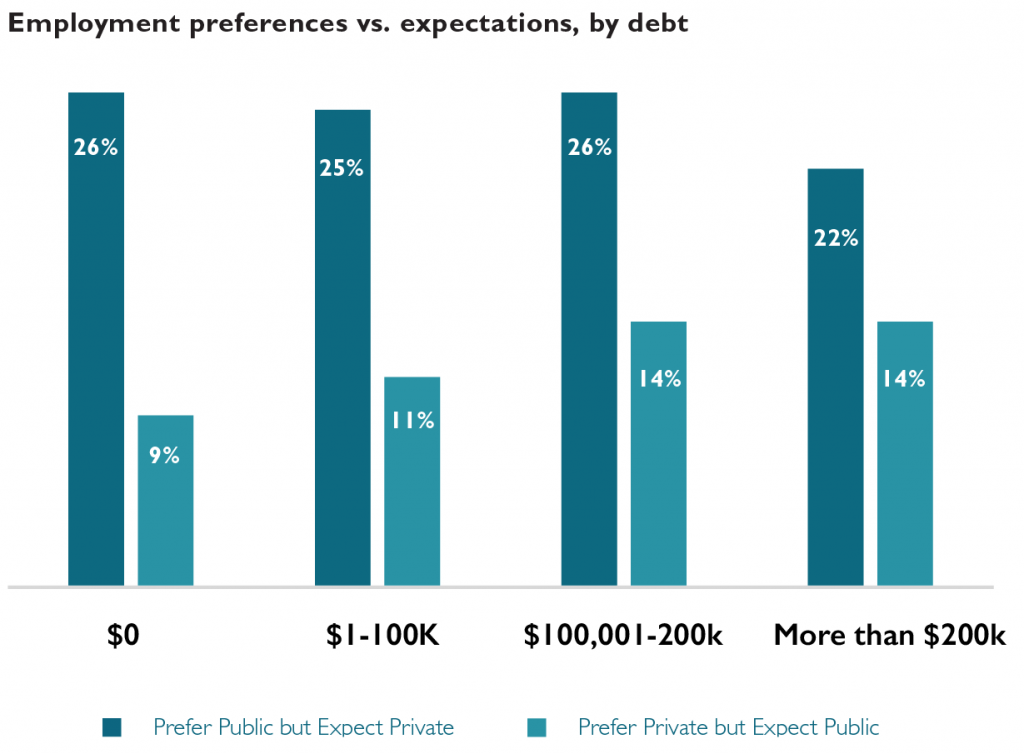
Forty-six percent of respondents who prefer one of the public service settings expect to work in a non-preferred setting, including one-quarter who expect to work in private settings instead. Forty-one percent of respondents who prefer one of the private settings expect to work in a different setting, but only 12% of students who prefer to work in a private setting expect to work in public service instead.

LSSSE Annual Results: Higher Debt, Lower Student Satisfaction (Part 2)
This is the sixth installment in a series of posts centered around data from the 2015 LSSSE Survey administration and the 2015 Annual Report, which provides a retrospective glimpse into law student debt trends over a 10-year period, 2006 to 2015, with 2011 as a midpoint. This post discusses student debt and the student satisfaction.
The LSSSE Survey is designed to measure the effects of legal education on law students. Student satisfaction is related to those effects; therefore, respondents are asked:
If you could start over again, would you go to the same law school you are now attending?
The purpose of this question is to, again, prompt respondents to consider and assess their law school experiences, but this time in the context of the opportunity costs. Respondents are given the following four answer choices:
- Definitely yes
- Probably yes
- Probably no
- Definitely no
In the analyses below, the favorable responses (Definitely yes and Probably yes) are combined, as are the unfavorable responses (Probably no and Definitely no).
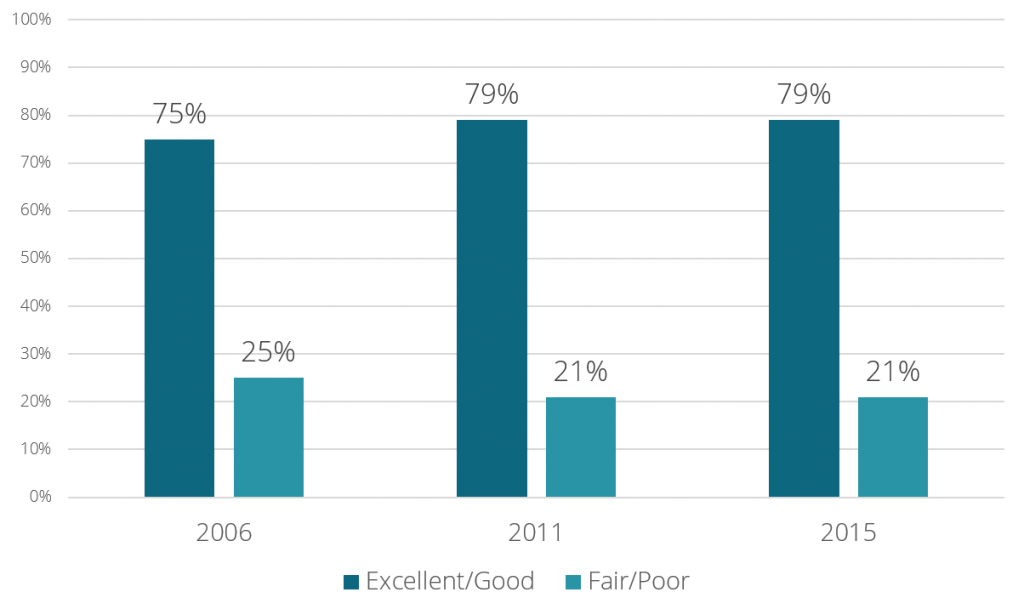
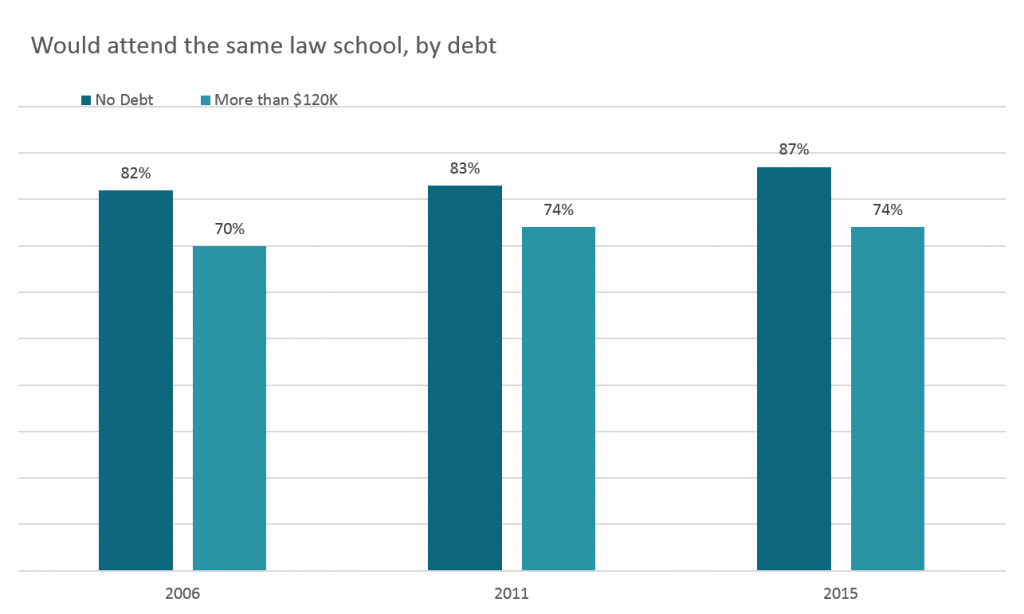
In each survey year, respondents who expected to owe more than $120,000 were noticeably less likely to respond favorably to the satisfaction questions. In 2006, 75% of these respondents had favorable views of their law school experiences, compared to the overall rate of 80%. Similar differences were observed in 2011 and 2015.
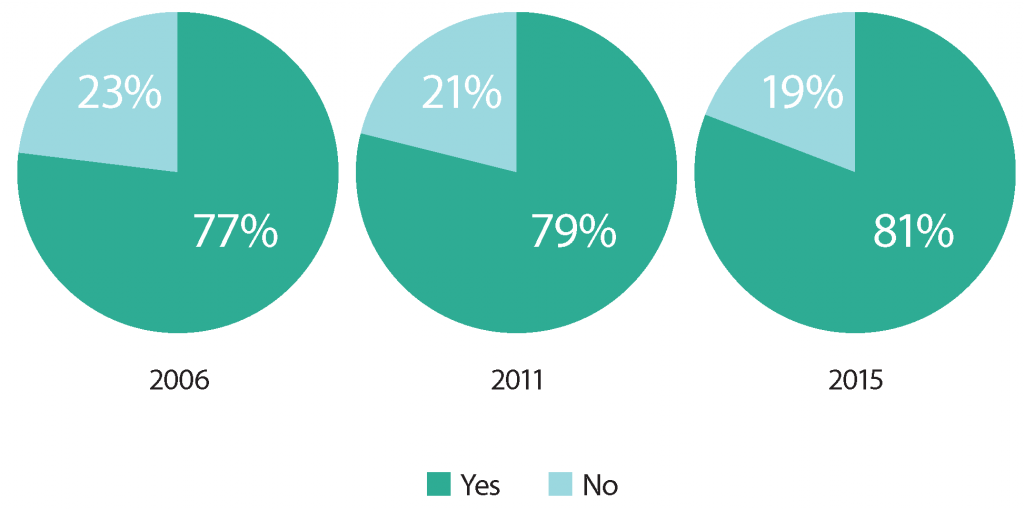
The effects of debt seemed even more apparent in the responses to the “same law school” question. With a few slight exceptions, in every survey year, respondents were less likely to state that they would attend the same law school as expected debt increased. At the level of more than $120,000 in expected the debt, 70% of respondents in 2006 said they would attend the same law school, compared to 82% of those who expected no debt. In 2011, the favorable response rate among these high-debt respondents was 74%, compared to 83% of those who expected no debt. And lastly, in 2015, 74% of these high-debt respondents stated they would attend the same school, compared to 87% of those expecting no debt. This 13-percentage point difference was the largest among the three survey years.

LSSSE Annual Results: Higher Debt, Lower Student Satisfaction (Part 1)
This is the fifth installment in a series of posts centered around data from the 2015 LSSSE Survey administration and the 2015 Annual Report, which provides a retrospective glimpse into law student debt trends over a 10-year period, 2006 to 2015, with 2011 as a midpoint. This post discusses student debt and the student experience.
The LSSSE Survey is designed to measure the effects of legal education on law students. Student satisfaction is related to those effects; therefore, respondents are asked:
How would you evaluate your entire educational experience at your law school?
The purpose of this question is to prompt respondents to consider and assess their law school experiences. This is, in essence, a question regarding satisfaction, a perceptional concept. As such, respondents are given the following four answer choices:
- Excellent
- Good
- Fair
- Poor
In the analyses below, the favorable responses (Excellent and Good) are combined, as are the unfavorable responses (Fair and Poor).
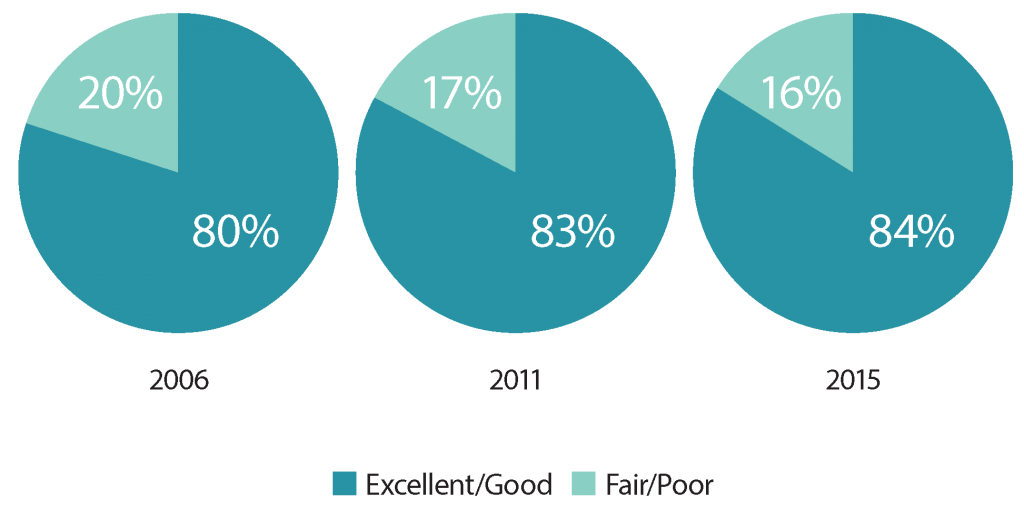
As a general proposition, LSSSE respondents reported high levels of satisfaction with their law school experience in each of the survey years. In 2015, 84% of respondents rated their law school experiences “excellent” or “good.” [i] Eighty-one percent stated that they would definitely or probably attend their same law school again. [ii] Interestingly, these proportions were higher than in both 2011 and 2006. This is noteworthy, given the increased costs of legal education and the handwringing about whether the endeavor is worth those costs.
A possible theory for these higher expressions of satisfaction might be that those who have opted to attend law school in spite of the unflattering scrutiny of late are more likely to have an affinity for the endeavor that transcends some of the most common practical considerations. Put simply, current law students may be more apt to be satisfied with the experience compared to past cohorts. Another theory could be that law schools have adapted to changing student needs and demands in ways that have increased satisfaction. In any case, the trend was somewhat surprising to us.
But in each survey year, respondents who expected to owe more than $120,000 were noticeably less likely to respond favorably to the satisfaction questions. In 2006, 75% of these respondents had favorable views of their law school experiences, compared to the overall rate of 80%. Similar differences were observed in 2011 and 2015. [iii]
[i]. Overall Satisfaction with “Entire Law School Experience” response proportions
[ii]. Overall “Same Law School” response proportions
[iii]. Satisfaction with “Entire Law School Experience,” more than $120K