
Law School Support for Non-Academic Responsibilities
Law students vary in their amount and type of non-academic responsibilities, and they also vary in the degree to which they feel that their law school helps them cope with these responsibilities. In addition to their studies, some law students work, care for children or other dependents, and engage in community activities. We wanted to examine the degree to which students feel supported in these endeavors by their law schools.
Time Spent Caring for Dependents
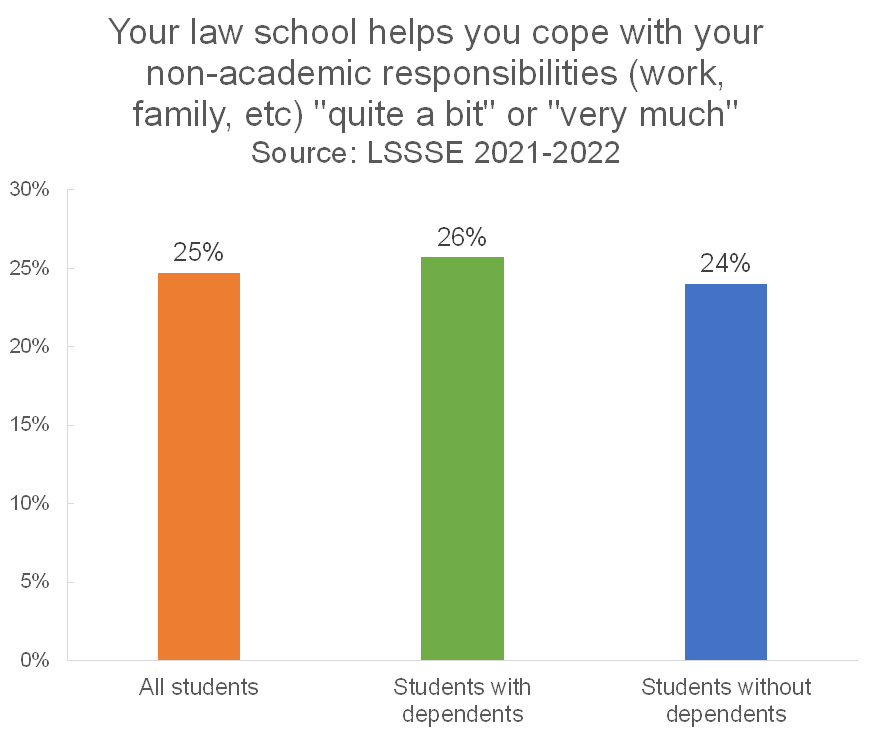
Thirty-eight percent of law students spend at least one hour per week caring for dependents living with them (parents, children, spouse, etc.). Interestingly, there is little difference in the percentage of students with and without dependent care duties who feel that their law school emphasizes helping them cope with their non-academic responsibilities. About a quarter of each group (26% of students with dependents and 24% of students without dependents) feel well-supported. However, students with dependents are slightly more likely to say that their law school does very little to help them cope with non-academic responsibilities. Two out of five (42%) of students with dependents feel this way compared to 38% of students without dependents.
Gender and Dependent Care
However, there are huge differences by gender. Men with dependent care responsibilities are much more likely to feel supported by their law schools than women with dependent care responsibilities, and both groups feel more supported than people of other gender identities with dependent care responsibilities.
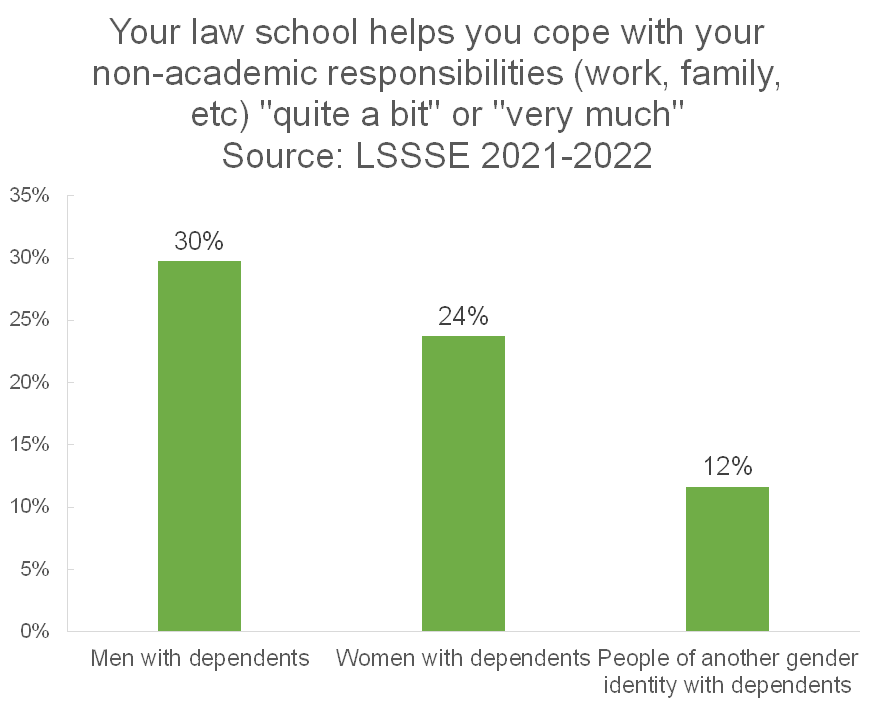
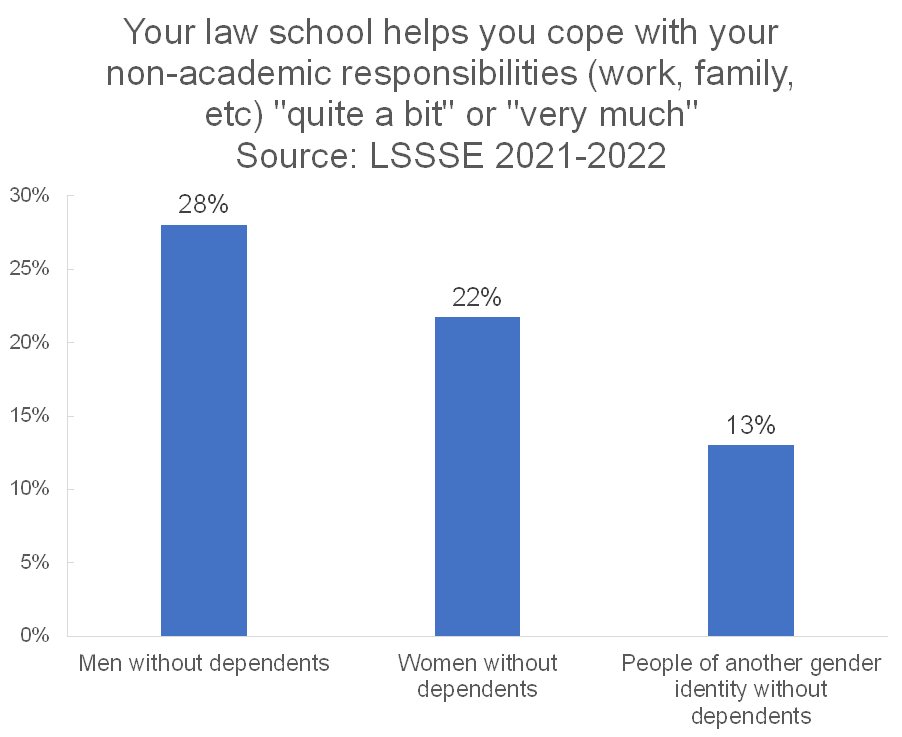
It appears, however, that this effect is more about gender and less about the dependent care responsibilities as we see this same disparity across gender among people without dependent care responsibilities.
Time Spent Working for Pay
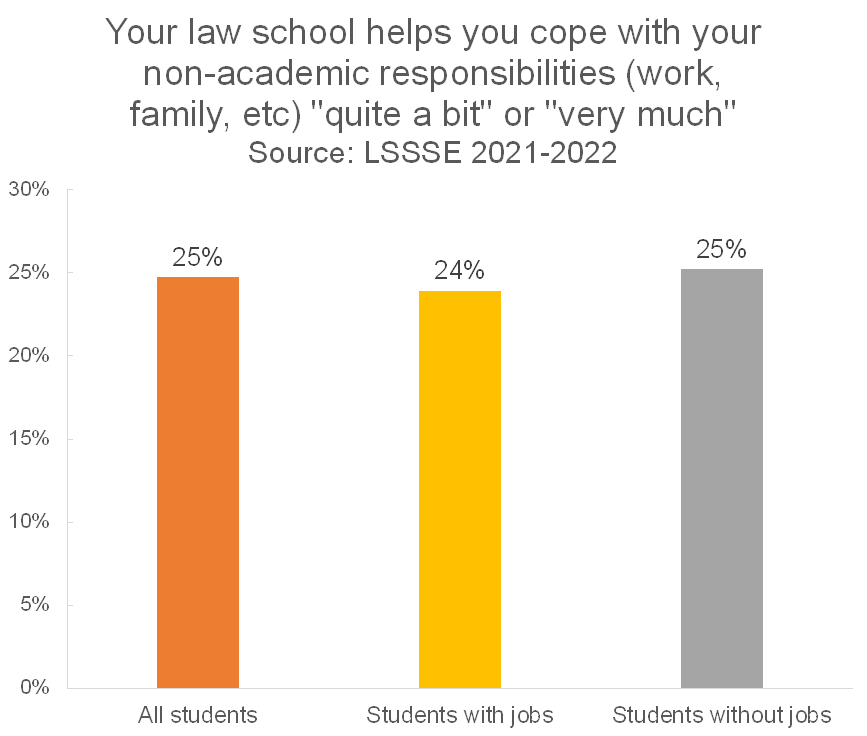
Similar to the pattern we see with dependent care duties, there is minimal difference in the perceived level of support for non-academic responsibilities between students who have jobs and students who do not. Around one in four students in either category say that their law school emphasizes supporting their non-academic responsibilities.
Gender and Employment
The gender pattern for perceived support is much the same for working/non-working students as it is for dependent care duties. Men are more likely to feel high levels of support than other students. However, people who identify as neither men nor women are actually more likely to feel highly supported in their non-academic responsibilities when they are employed (20% of students) relative to when they are not (6% of students).
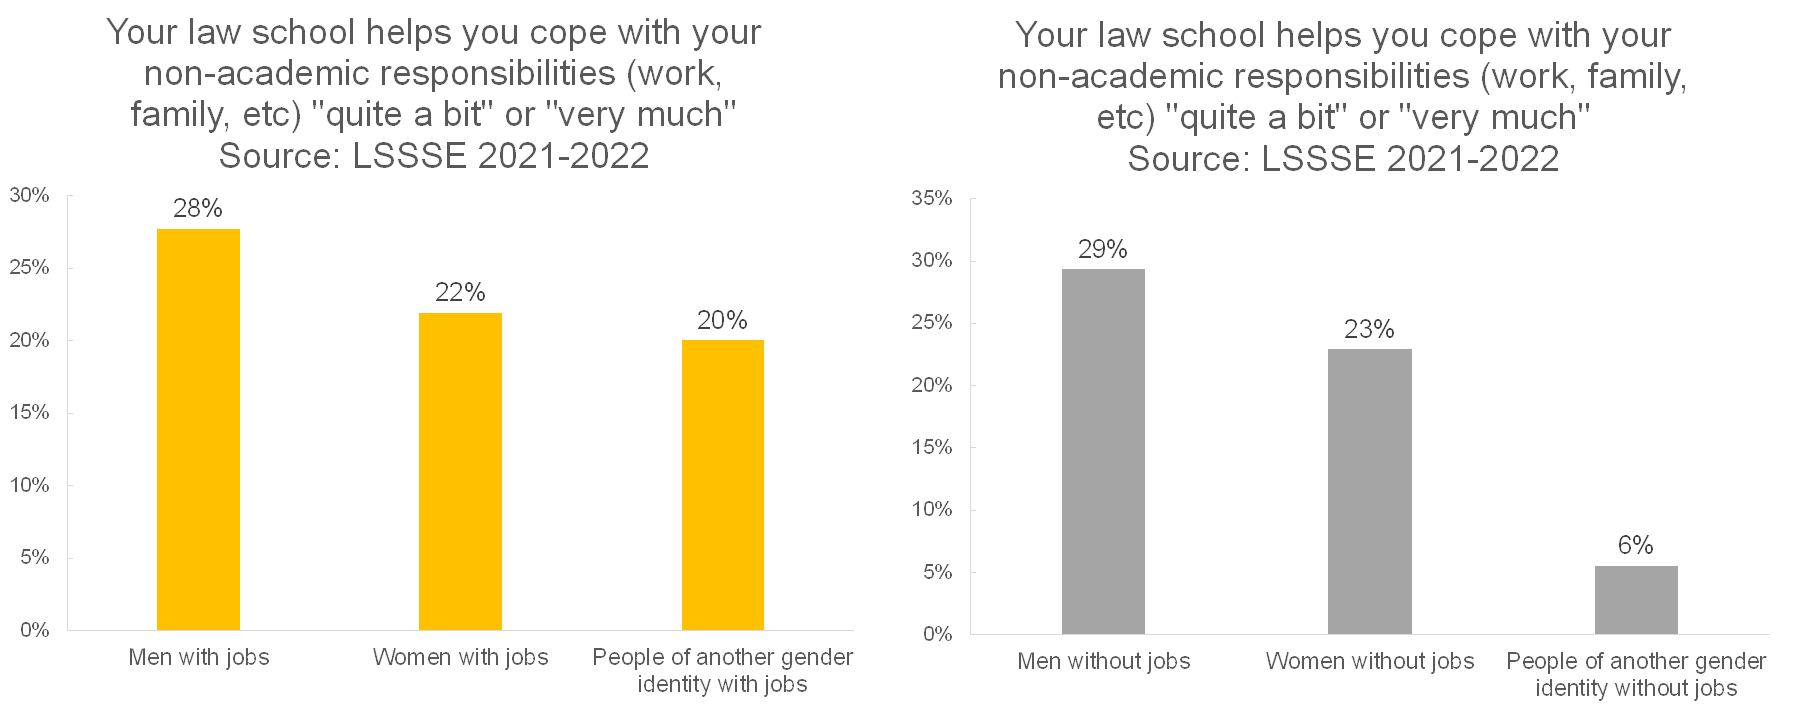
Regardless of how they spend their time outside of law school, men are much more likely to feel highly supported in their non-academic responsibilities, people of another gender identity are very unlikely to feel supported, and women generally fall somewhere in between. Adequate support for non-academic responsibilities clearly looks different for different people, and it appears that gender is a major factor. Rather than focusing on student populations based on which responsibilities they have and how they spend their time outside of the classroom, law schools may want to consider the unique needs of women and people of other gender identities to close the gap in the degree of support they feel about coping with their non-academic responsibilities.

Preferences & Expectations for Employment After Law School by Student Debt Level
The newly released LSSSE 2017 Annual Results explore the relationship between students’ preferred and expected work settings post-graduation. Our most recent post looked at the settings in which male and female student prefer and expect to work. In the final post in this series, we examine how students with varying debt levels approach the question of where they prefer and expect to work after graduation.
The role of student loan debt is important to consider in the context of student career preferences and expectations because earning potential varies tremendously across work settings within the legal profession. LSSSE asks respondents to estimate the amount of law school debt they expect to incur by graduation. Forty percent of respondents who expect to owe more than $200,000 prefer to work in a public service setting, the highest proportion of all student debt groupings. At 31%, respondents who expect no debt are least likely to prefer working in public service.
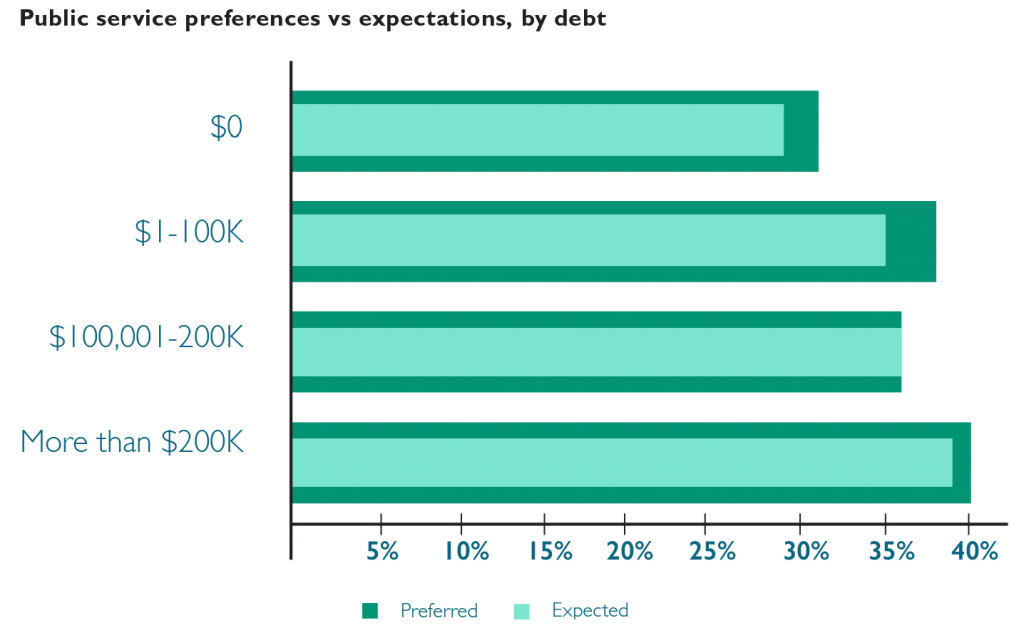
Expectations of working in public service decrease slightly relative to preferences for each of the student debt groups; but expectations of working in public service increase with expected debt. There is no evidence of high levels of expected debt prompting respondents who prefer public service settings to nonetheless expect to work in private settings (due to the prospect of higher pay). In fact, respondents who expect to owe more than $200,000 are most likely to prefer and expect to work in public service settings. Respondents expecting to owe more than $100,000 are mostly likely to prefer to work in private settings but expect to work in public service.
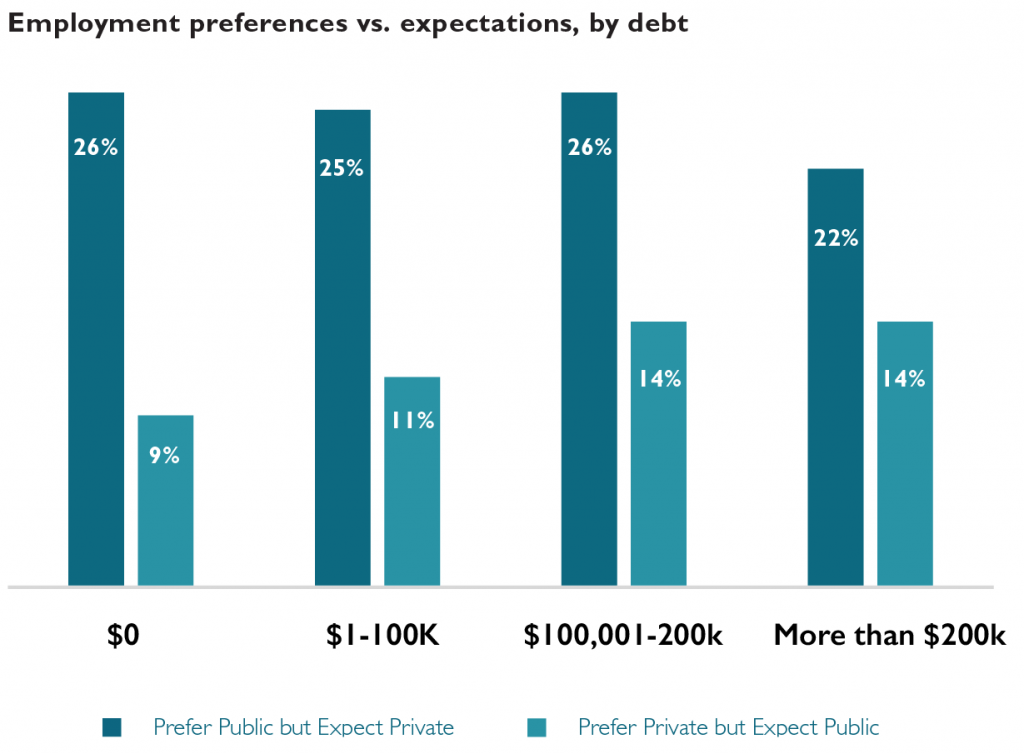
The motivation for pursuing legal work in one setting versus another is likely driven by a variety of factors rather than simple personal economics. The promise of programs like Public Service Loan Forgiveness (PSLF) may temper the negative financial ramifications of pursuing lower-paying public service careers among students in the highest student debt groupings. The relative popularity of public service work among Black and Latinx students coupled with the disproportionate student loan burden (pdf) shouldered by these students is likely another contributing factor to the trends we see here.
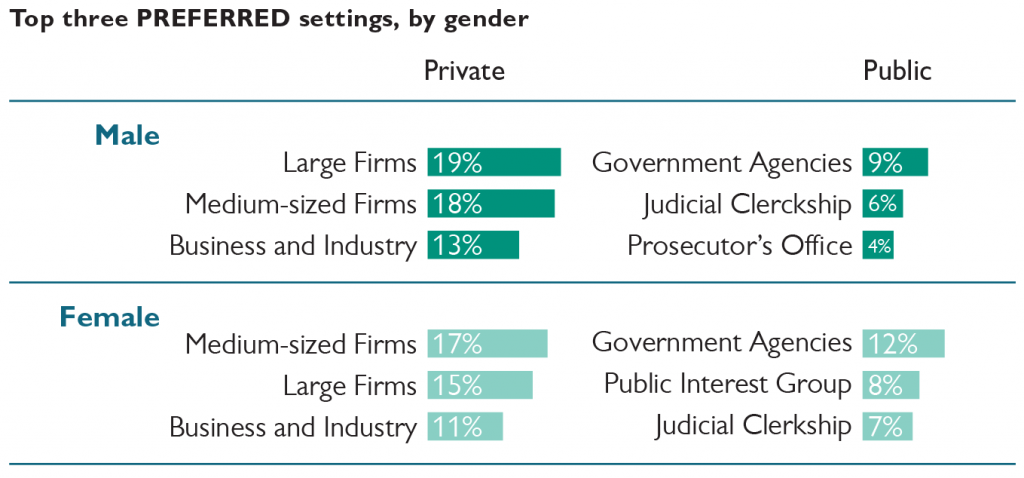
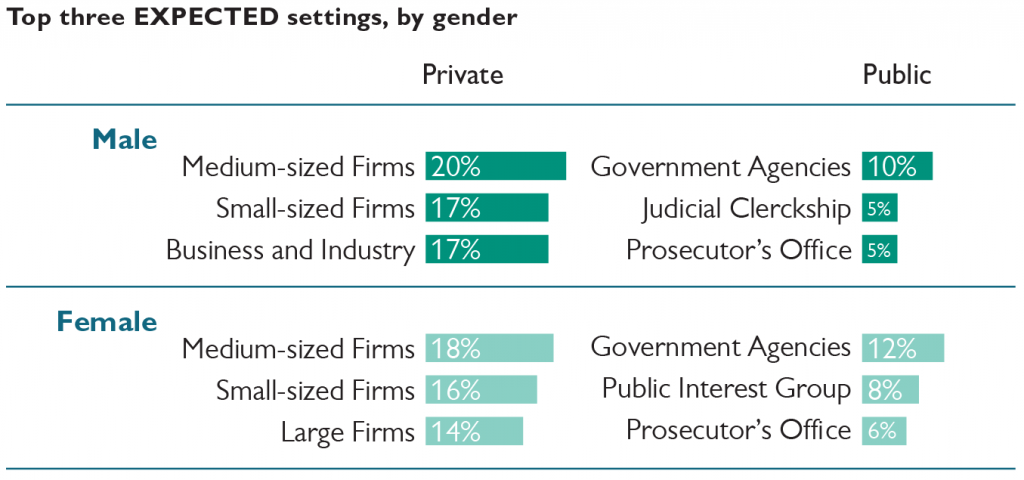
Preferences & Expectations for Employment After Law School by Gender
The newly released LSSSE 2017 Annual Results explore the relationship between students’ preferred and expected work settings post-graduation. Our most recent post in this series showed how these preferences and expectations are related to race and ethnicity. In this post, we will show how male and female law students differ in their preferences and expectations.
Seventy percent of male respondents indicate a preference for working in one of the private settings, compared to 59% of female respondents. Large firms are the most preferred among males. Medium-sized law firms are the most preferred private setting for female respondents. Government agencies are the most preferred public service setting for both groups, with female respondents more likely to indicate this preference.
Sixty-one percent of female respondents expect to work in the same type of setting they prefer; fifty-eight percent of males did so. Medium-sized law firms are the most commonly expected work setting for both groups, which for males was a shift from their preference for large firms. Government agencies are the most commonly expected public service setting for both groups.
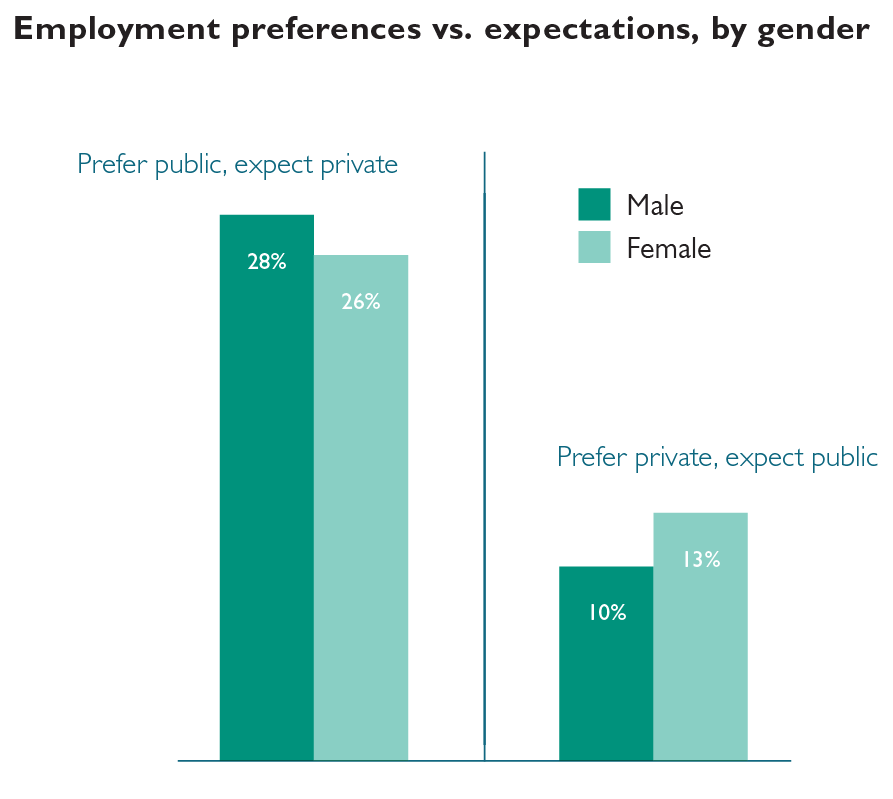
Male respondents are more likely than females to prefer to work in public service but expect to work in a private setting. Female respondents are more likely than males to prefer to work in a private setting but expect to work in public service.
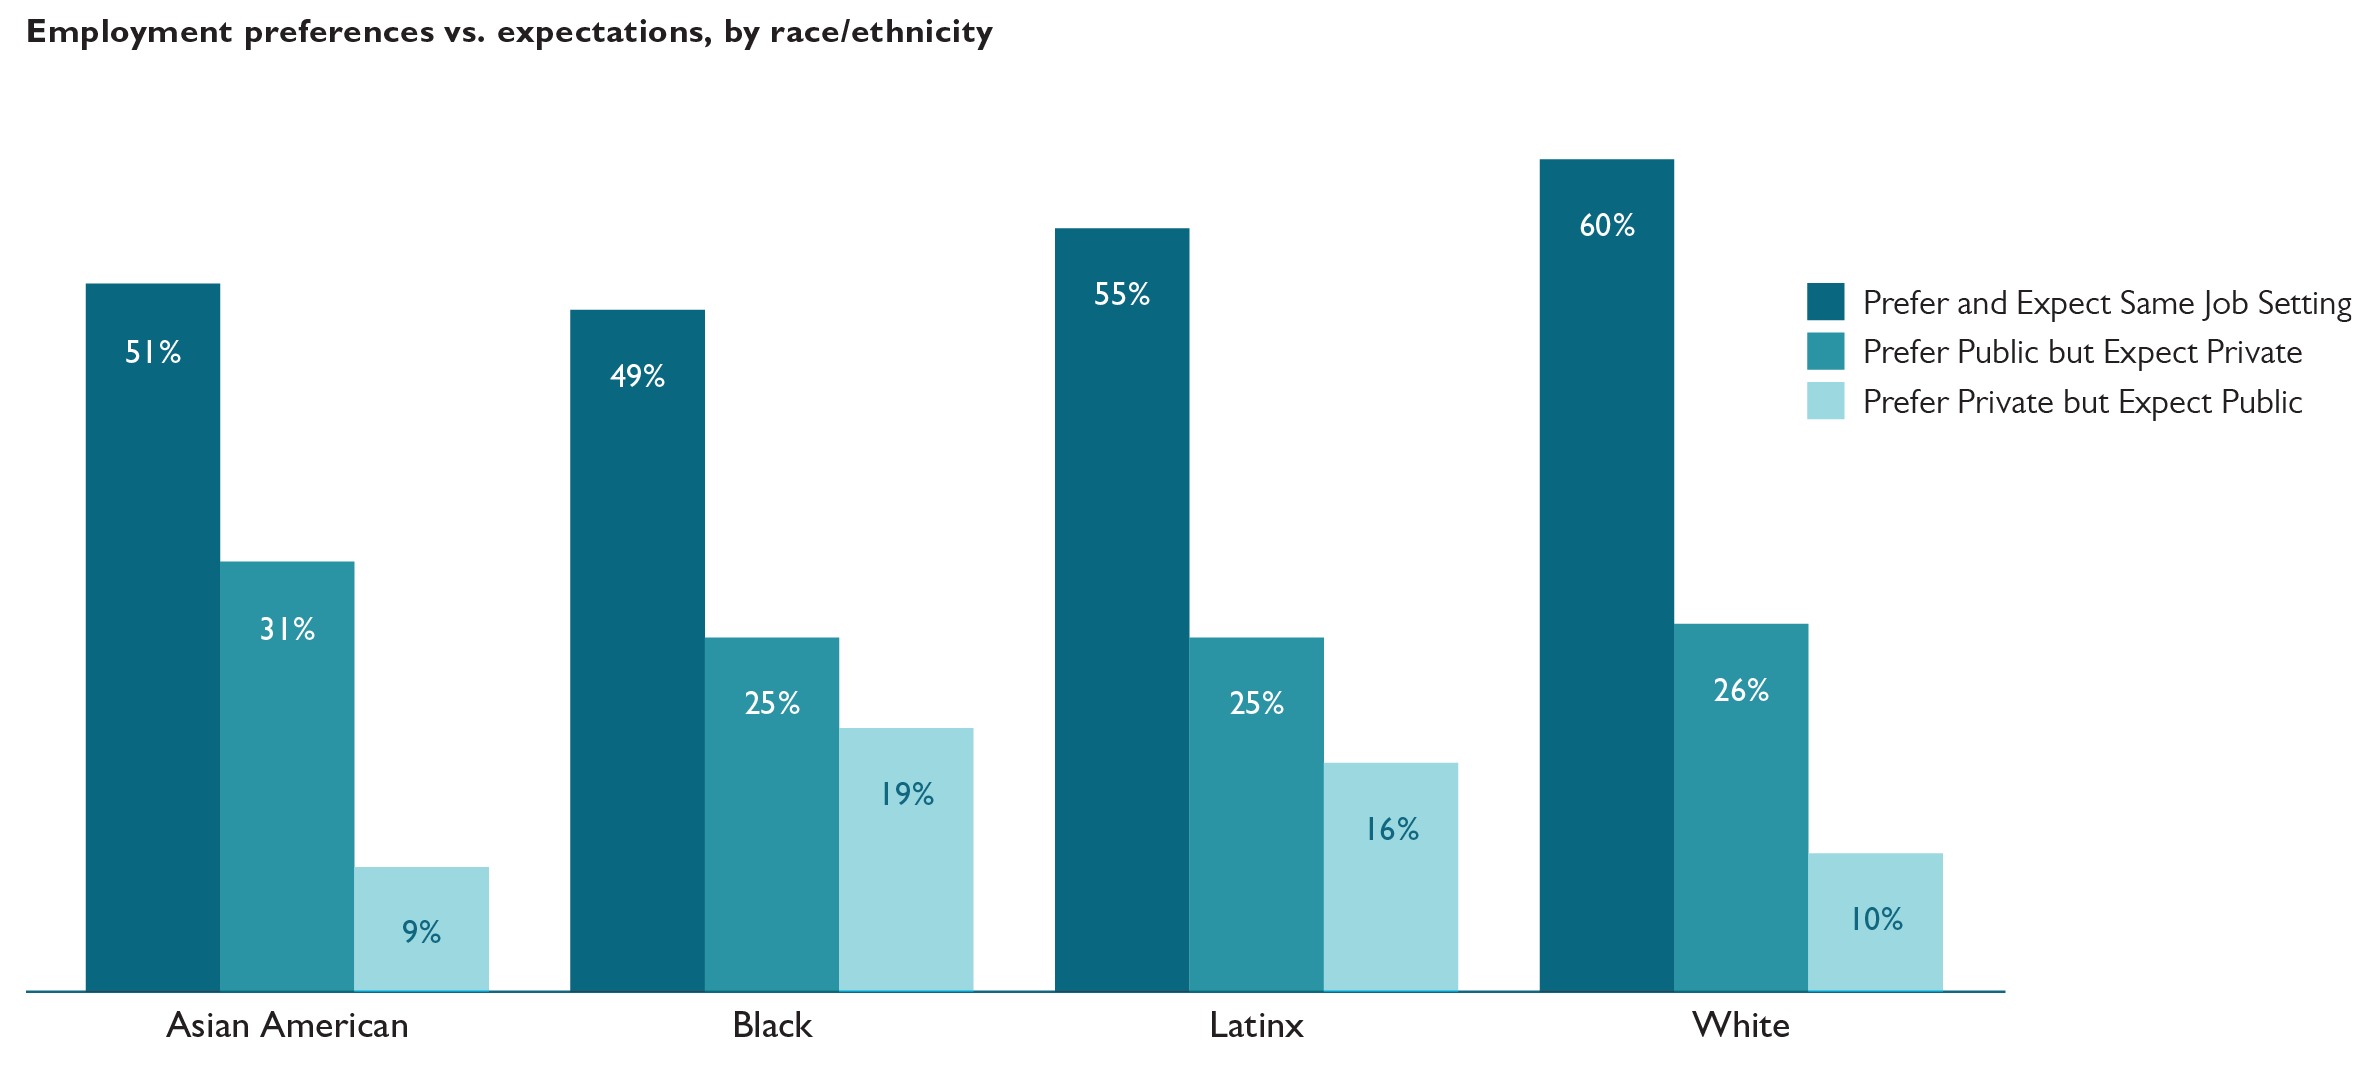
Preferences & Expectations for Employment After Law School by Race and Ethnicity
The newly released LSSSE 2017 Annual Results explore the relationship between students’ preferred and expected work settings post-graduation. Our most recent post in this series shared some general observations about the matches (and mismatches) between preferred and expected settings. In this post, we will share some insights into how these preferences and expectations are related to race and ethnicity.
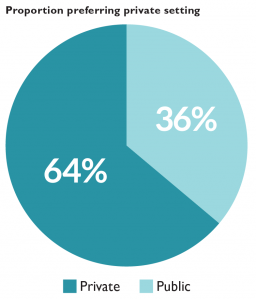
Overall, 64% of respondents prefer to work in the private sector. Almost 70% of Asian American respondents state a preference for working in a private setting, the largest proportion among the four racial and ethnic groups analyzed. Black respondents are most likely to prefer public service settings.
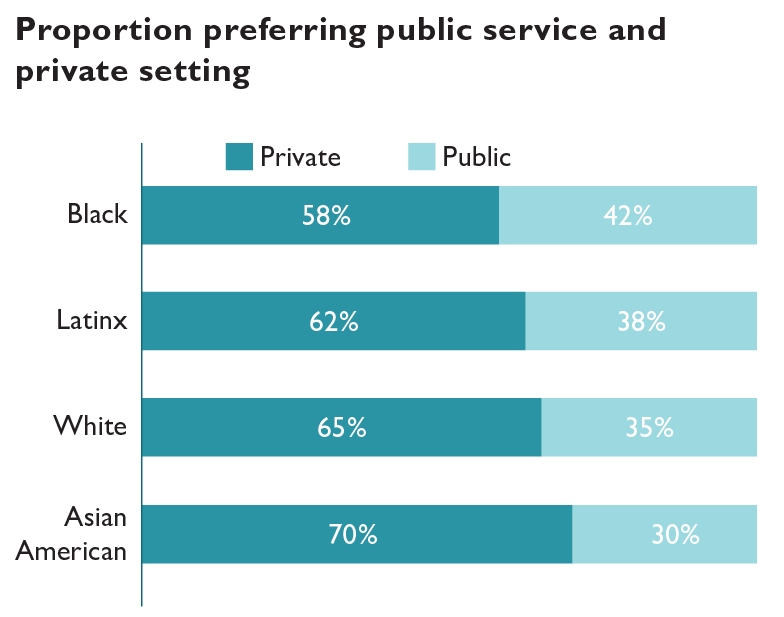
Black respondents are least likely to prefer and expect to work in the same individual setting, with less than half doing so, whereas White respondents (at 60%) are most likely. The proportion of respondents expecting to work in private settings increases among Asian American and White respondents, when compared to their preferences. Seventy-three percent of Asian American respondents expect to work in private settings, compared to 70% preferring to do so. Among White respondents, the proportion who expect to work in private settings is 68% compared to the 65% who prefer it. These two sets of proportions remain largely the same among Black and Latinx respondents.
Almost one-third of Asian American respondents who prefer public service settings expect to work in private settings, the highest proportion among all the racial and ethnic groups. Black respondents are most likely to prefer private settings but expect to work in public service.

Trends in Preferences & Expectations for Employment After Law School
The newly released LSSSE 2017 Annual Results explore the relationship between students’ preferred and expected work settings post-graduation. In a series of related blog posts, we will share tidbits of information about where law students hope to work, where they expect to work, and how these preferences and expectations vary by race and gender. In our final post, we will look at patterns in students’ preferred and expected work settings relative to their projected levels of student loan debt.
LSSSE asks respondents to identify the setting in which they would most prefer to work after graduation and the setting in which they most expect to work. Preferences can be seen as representing a respondent’s ideal outcome; expectations can be seen as representing perceptions of a realistic outcome. For both questions, respondents are asked to choose between sixteen answer options.
For purposes of much of the analyses in this report, the answer options were divided into two broad groups:
Public Service Settings
- Academic
- Government agency
- Judicial clerkship
- Legislative office
- Military
- Prosecutor’s office
- Public defender’s office
- Public interest group
Private Settings
- Accounting firm
- Business and industry
- Nonlegal organization
- Private firm – small (fewer than 10 attorneys)
- Private firm – medium (10-50 attorneys)
- Private firm – large (more than 50 attorneys)
- Solo practice
The “Other” response was removed from our analysis. The primary factor underlying the assignment of an answer option to one of the two groupings was whether a person working in that setting would likely qualify for Public Service Loan Forgiveness (PSLF), which typically requires one to be employed in the government or non-profit sector. There is naturally some imprecision in the assignments.
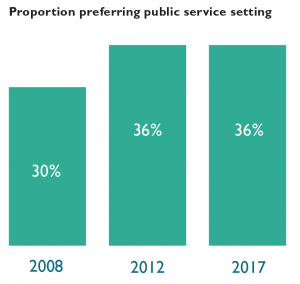
Sixty-four percent of respondents indicate a preference for working in one of the private settings, with the remaining 36% preferring public service. This proportion is unchanged from five survey administrations ago (2012) and higher than the 30% public service proportion ten administrations ago (2008).
Seventeen percent of respondents would prefer to work in medium-sized law firms, making this category the most popular private setting and the most popular setting overall. Government agencies are the most popular public setting, with 11% of respondents indicating that preference. Medium-sized law firms are also the most commonly expected private work setting, accounting for 20% of respondents. Small law firms are the fourth most preferred private setting yet the second most common expected setting. Government agencies are the most commonly expected public service setting.
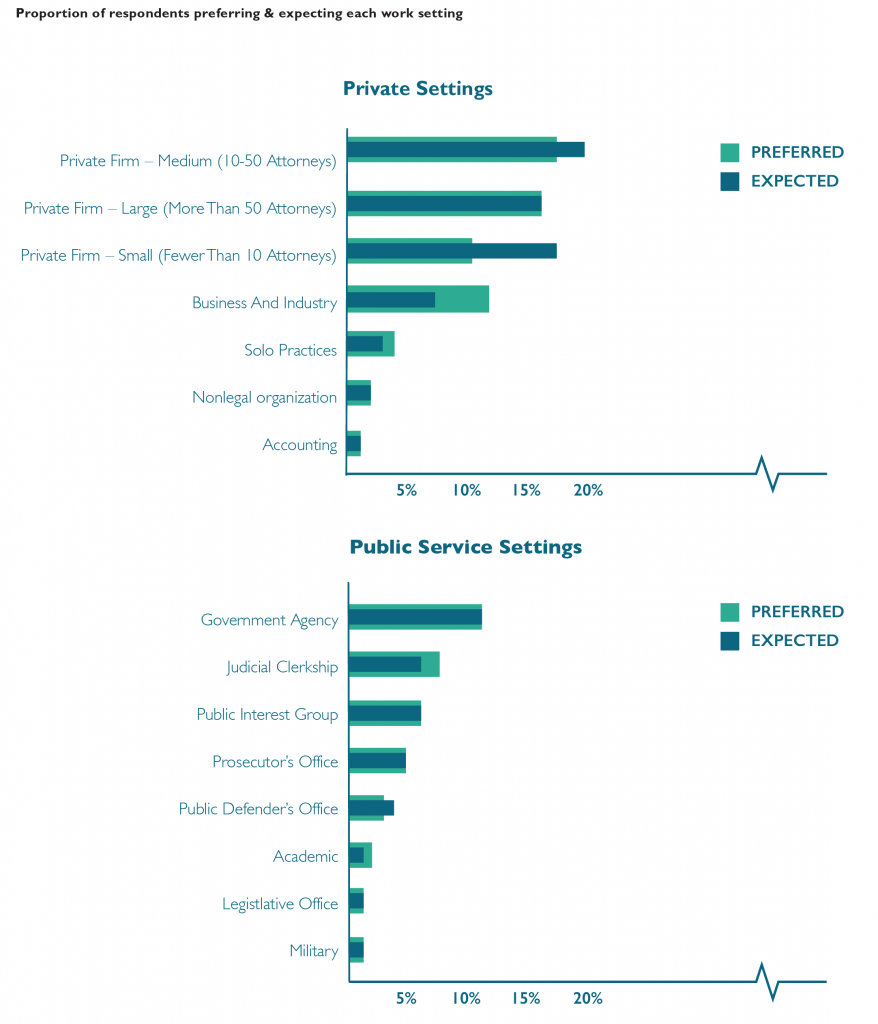
Forty-four percent of respondents indicate a different expected work setting than their preferred setting. Respondents who prefer to work in an academic setting are least likely to expect to work in that setting, with only about one-in-five matching preference with expectation. Respondents who prefer to work in large law firms or as prosecutors are most likely to also expect to work in those settings.
Forty-six percent of respondents who prefer one of the public service settings expect to work in a non-preferred setting, including one-quarter who expect to work in private settings instead. Forty-one percent of respondents who prefer one of the private settings expect to work in a different setting, but only 12% of students who prefer to work in a private setting expect to work in public service instead.