LSSSE Annual Results 2019: The Cost of Women’s Success (Part 3)
Opportunities for Improvement
Given the many challenges facing women upon entry to law school, it is no surprise that there are also opportunities to improve the experience for women students in legal education. LSSSE data on concepts as varied as classroom participation, caretaking, and debt make clear that women need greater support.
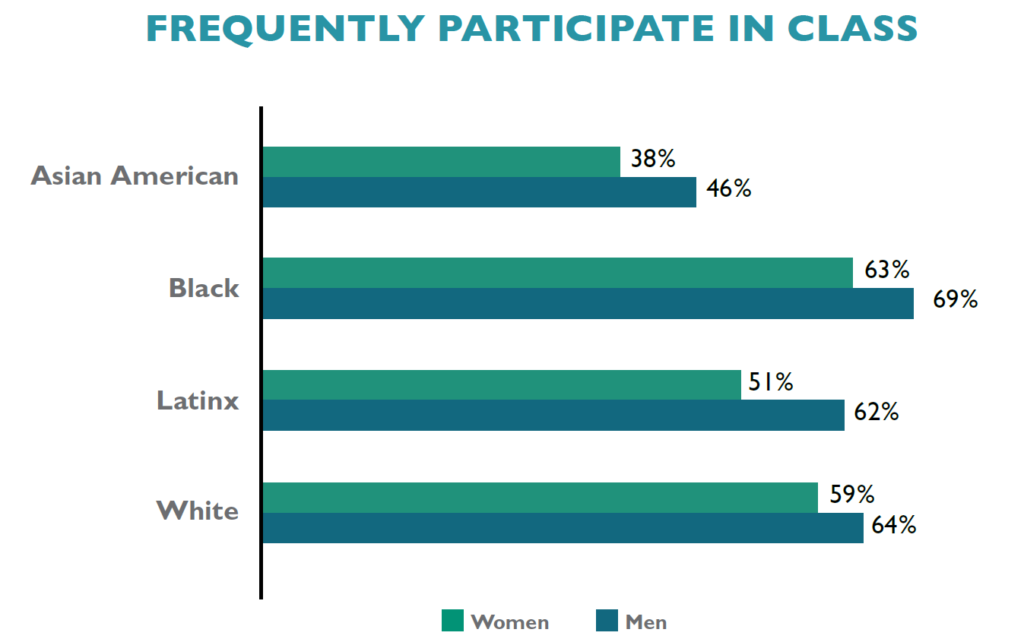
Engagement in campus life is an especially significant indicator of success. Law students who are deeply invested in both classroom and extracurricular activities tend to maximize opportunities for success overall. As stated in a previous post, women are just as likely as men to be involved in various co-curricular endeavors. Yet, smaller percentages of women than men are deeply engaged in the classroom. While 64% of men report that they “Often” or “Very Often” ask questions in class or contribute to class discussions, only 58% of women do. This gender disparity remains pronounced within every racial/ethnic group, as men participate in class at higher rates than women from their same background. There are also interesting variations by raceXgender, with Black men frequently participating at higher rates than any other group (69%), and at almost twice the rate of Asian American women (38%).
Many women students also spend numerous hours during their law school careers providing care to household members. For instance, 11% of women report that they spend more than 20 hours per week providing care for dependents living with them, as do 8.6% of men. These competing responsibilities require a significant investment of time, which could otherwise be spent on studying for class, working with faculty on a project outside of class, or even engaging in leisure activities. Instead, these students are taking care of their families.
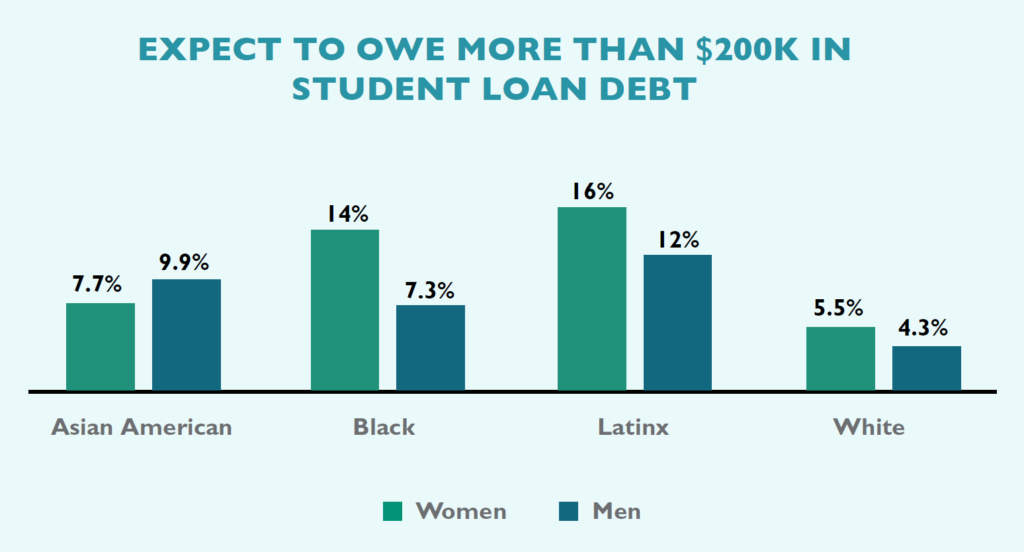
An especially troubling discovery is that high percentages of women than men incur significant levels of debt in law school. Among those who expect to graduate from law school with over $160,000 in debt are 19% of women and 14% of men. This gender difference remains constant within every racial/ethnic group. Even more alarming is the disparity among those carrying the highest debt loads: 7.9% of women will graduate from law school owing over $200,000 as compared to 5.5% of men. LSSSE data not only confirm existing research on racial disparities in educational debt, with people of color and especially Black and Latinx students borrowing more than their peers to pay for law school, but also reveal that women carry a disproportionate share of the debt load as compared to men. Furthermore, when considering the intersection of race/ethnicity and gender, we see that women of color specifically are graduating with extreme debt burdens.
Next week, we will conclude this series with some troubling trade-offs that women make to overcome the disadvantaged position in which they often find themselves relative to their male counterparts. You can read the entire LSSSE 2019 Annual Results The Cost of Women’s Success (pdf) on our website.
LSSSE Annual Results 2019: The Cost of Women’s Success (Part 2)
Contextualizing Women’s Success
Women’s relative success in law school is quite significant when we consider basic demographic differences between women and men when they first enroll in law school. Fewer economic resources and lower test scores do not seem to inhibit women from achieving at high levels once on campus.
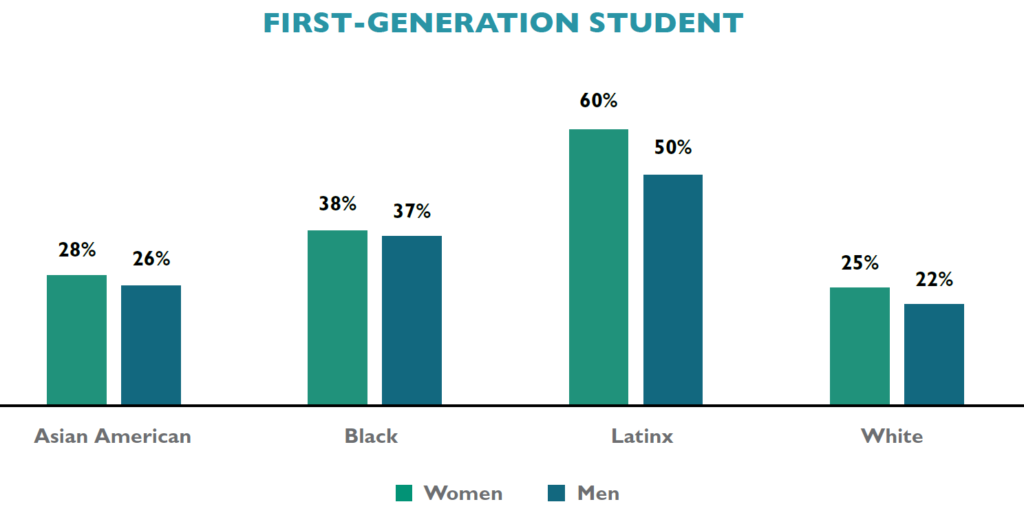
Parental education is a common proxy not only for family income but for future educational success, with the children of highly educated parents generally drawing on class privilege and extra resources to achieve at high levels. LSSSE data reveal that women are more likely than men to be first-generation law students, with 30% reporting that neither parent holds a bachelor’s degree as compared to 25% of male law students. This finding is consistent for women regardless of race/ethnicity, with Asian American, Black, Latinx, and White women being more likely than men from those same backgrounds to be the children of parents who did not earn at least a college degree.
Even considering those whose parents are highly educated, women law students are less likely than men to have a parent who is a lawyer. Among those reporting that they have a parent who earned a doctoral or professional degree, 57% of men but only 52% of women report that their parent’s degree is a J.D. Only Asian American women are more likely than men from their same racial/ethnic background to have a parent with a law degree; higher percentages of male law students who are Black, Latinx, or White have a lawyer parent than women from those same backgrounds.
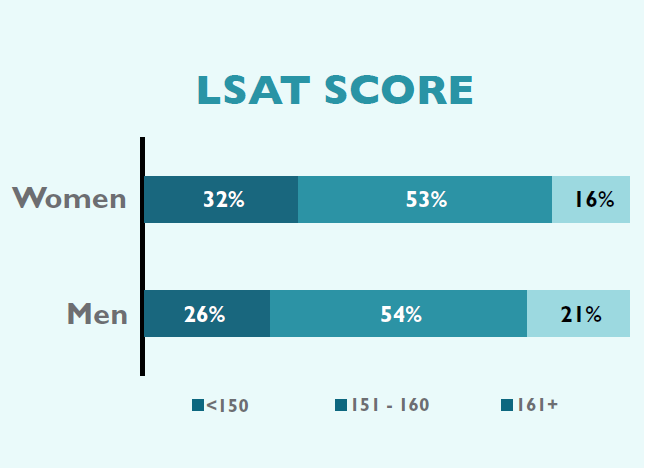
In addition to demographic differences based on parental status, women also report lower LSAT scores than men, even when comparing within racial/ethnic groups. While 21% of men report LSAT scores in the highest range of 161 or above, only 16% of women report similar achievement on this exam. This finding mirrors other critiques of high-stakes testing as potentially limiting opportunities for non-traditional students including women and people of color.
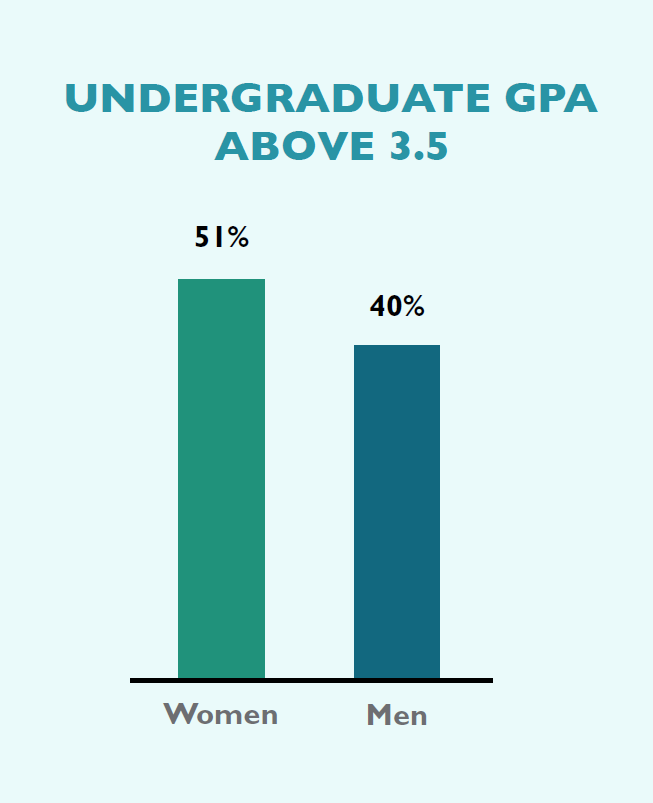
Conversely, higher percentages of women than men enter law school with undergraduate grade point averages (UGPAs) in the top range. A full 51% of women report UGPAs of 3.5 and above as compared to only 40% of their male classmates. As with LSAT scores, this gender finding is consistent across race/ethnicity: when comparing women and men from the same background, women outperform men on UGPA. Recall that in spite of the inconsistency of lower LSAT scores and higher UGPAs, women nevertheless report slightly higher overall law school grades than men. This may further bolster research questioning the value of using test performance as the primary determinant of expected success in law school and beyond.
The next post in this series will offer some opportunities for improvement in gender equity in legal education. You can read the entire LSSSE 2019 Annual Results The Cost of Women’s Success (pdf) on our website.
LSSSE Annual Results 2019: The Cost of Women’s Success (Part 1)
The past two decades have seen increasing numbers of women in law schools. After graduating from law school, women lawyers enjoy greater opportunities for financial independence, security of employment, and a potential for leadership facilitated by the J.D. degree. Yet, gender inequities in pay and position continue to plague the legal profession. In spite of this conundrum, there has been little scholarly attention given to the experience of women while in law school.
The 2019 LSSSE Annual Results celebrate women. We investigate the successes of women law students—using objective and subjective measures to reveal various accomplishments. We also interrogate their backgrounds and the context for their enrollment in law school, revealing challenges women overcome and the sacrifices they make to succeed. This Report not only shares findings on women as a whole, but also features comparisons by gender and race/ethnicity, providing greater depth and context to the overall experience of women law students. Our findings make clear that women’s success comes at great personal and financial cost. Greater awareness of these challenges provides both an imperative and an opportunity for administrators, institutions, and leaders in legal education to invest more deeply in the success of women.
The Good News
Women are succeeding in legal education along numerous metrics. When considering overall satisfaction rates, roughly equal percentages of women (81%) and men (83%) report that their entire experience in law school has been either “Good” or “Excellent.” In spite of generally high marks for all groups, there are notable differences by race/ethnicity. While the vast majority (75%) of Black women characterize their overall experience as positive, these rates are lower than those of women who are Asian American (78%), Latina (78%), and White (84%).
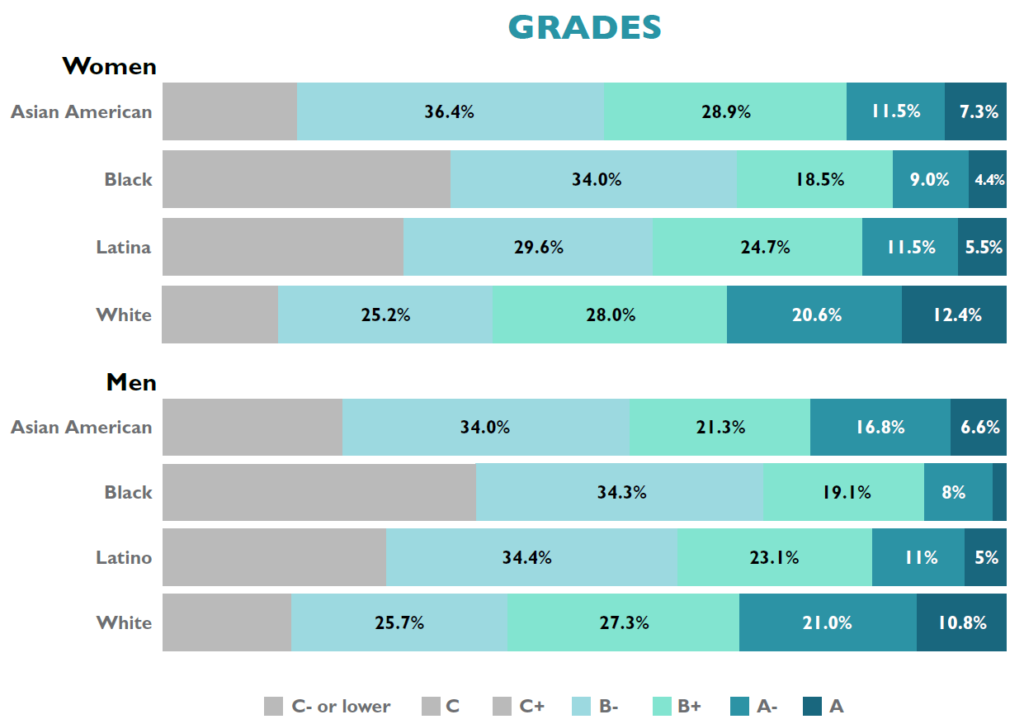
In addition to appreciating their law school experience, women are also excelling academically. Women’s self-reported law school grades are slightly higher than men’s. As one example 10.3% of women report earning mostly A grades in law school compared to 9.5% of men. There is important variation not only by race but also by the intersectional consideration of raceXgender. To start, 7.3% of Asian American women, 4.4% of Black women, and 5.5% of Latinas claim mostly A grades as compared to 12% of White women law students. Yet, when investigating grades within each racial/ethnic group by gender, women are nevertheless outperforming men.
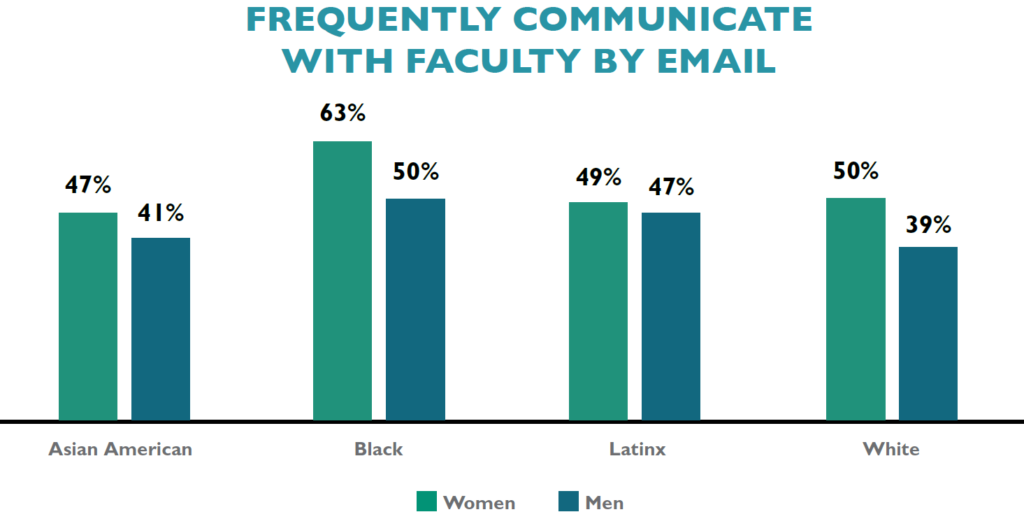
Additionally, women are adept at utilizing particular resources in law school, connecting with faculty and fellow students. Just over half (51%) of women use email to communicate with a faculty member “Very often” compared to only 40% of men. In fact, at 63%, Black women are more likely to engage in frequent email contact with faculty than any other raceXgender group. Women, regardless of their racial/ethnic background, are also more likely than men on average to engage in ongoing and frequent conversations with faculty and other advisors about career plans or job search activities. Women and men are also engaged in co-curricular activities at roughly equivalent rates, including the percentages participating in pro bono service, moot court, and law journals. A majority of students also enjoy positive interactions with classmates. A full 79% of men and 75% of women report the quality of their relationships with peers as a five or higher on a six-point scale. Furthermore, 65% of women rely on and invest in membership in law student organizations—which research has shown provide social, emotional, cultural, and intellectual support for many students. Black women (68%), Latinas (65%), Asian American women (60%), and White women (65%) join student groups at higher rates than men as a whole (53%).
Women are clearly engaged members of the law school community. Our next post in this series will discuss contextual differences between men and women before entering law school that suggest women are more likely to have to overcome obstacles to be successful. You can read the entire LSSSE 2019 Annual Results The Cost of Women’s Success (pdf) on our website.
Annual Results 2018: Relationships Matter – Advising
A majority of students are pleased with the quality of advising and their relationships with administrators:
- 69% are satisfied with academic advising and planning.
- 66% are satisfied with career counseling.
- 64% are satisfied with job search help.
- 70% are satisfied with financial aid advising.
- 68% report that administrative staff are helpful, friendly, and considerate.
The quality of relationships with advisors and administrators is both positive and relatively consistent across race, gender, and year in school. Seventy percent of 1L students (and 67% of 2Ls and 3Ls) report that administrative staff are helpful, considerate, and flexible. Seventy-nine percent (79%) of students consider at least one administrator or staff member as someone they could approach for advice or guidance on managing the law school experience. Higher percentages of Black students (87%) rely on these relationships than students from other racial backgrounds (79% for Asian American, white, and Latinx students).

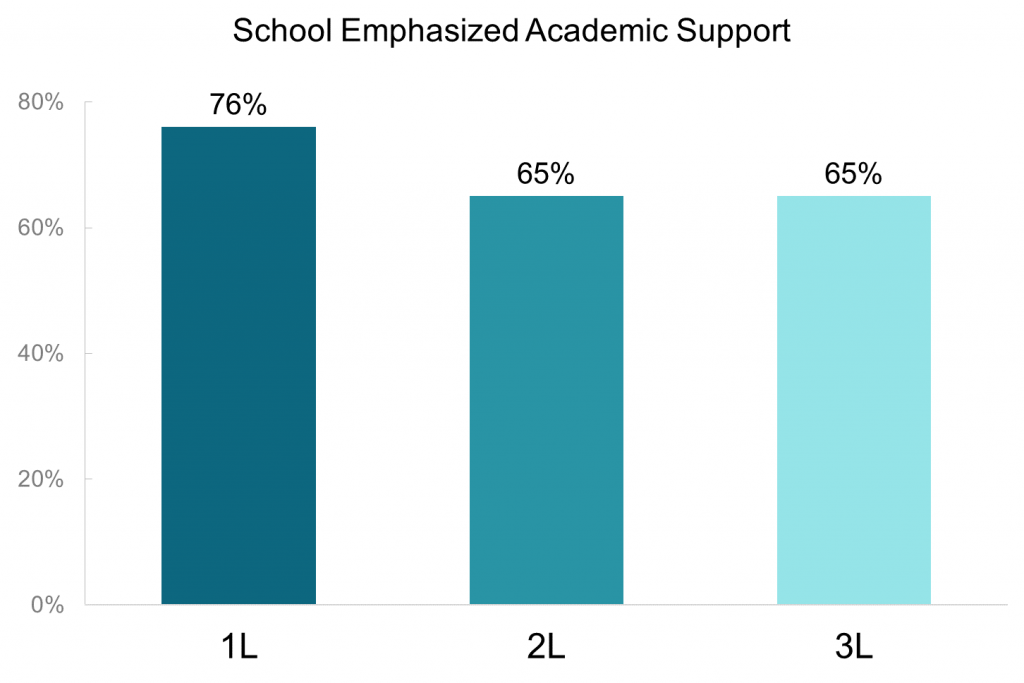
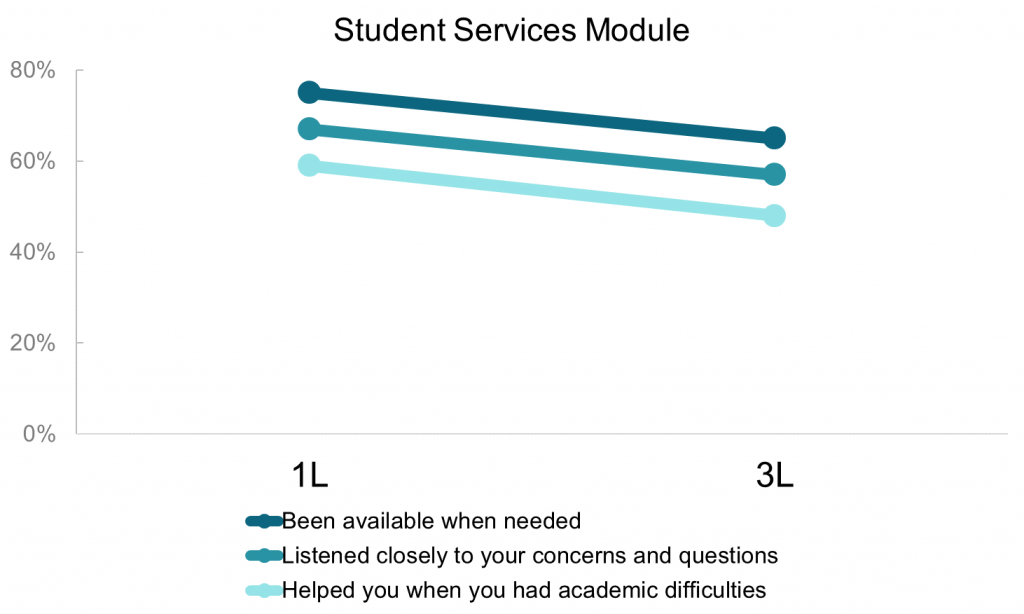
Interactions with academic support personnel drive whether a student would choose to attend the same law school again as well as overall satisfaction with their law school experience. Though students report positive relationships with administrative staff, satisfaction with advising services is less consistent and more varied across race/ethnicity, year in school, and gender. Sixty-nine percent of all respondents report that their law school provides the support they need to succeed academically, with higher perceptions of support among 1L students. Similarly, academic advising, career counseling, and job search help are key support services that students appreciate greatly when they begin law school, though they are more dissatisfied as graduation nears.
Annual Results 2018: Relationships Matter - Student-Faculty Interaction
Faculty, administrators, and classmates are key ingredients to law student success. These relationships serve as important ties to the law school and impact student satisfaction, sense of belonging, and academic and professional development. This year’s annual report explores relationships and examines the nuances of the impact they have on law students.
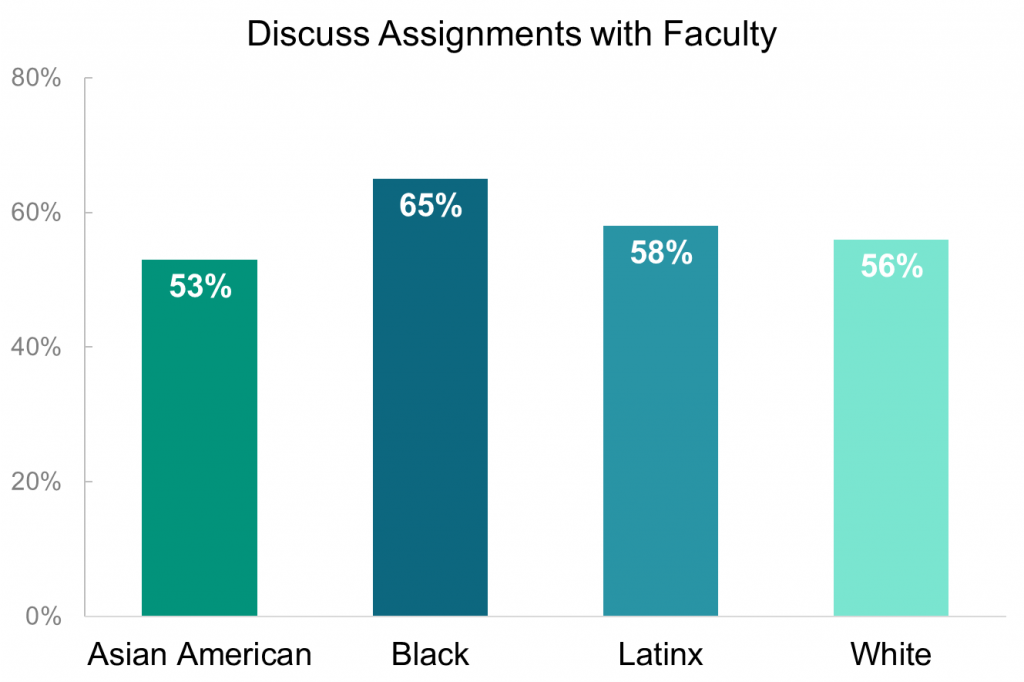
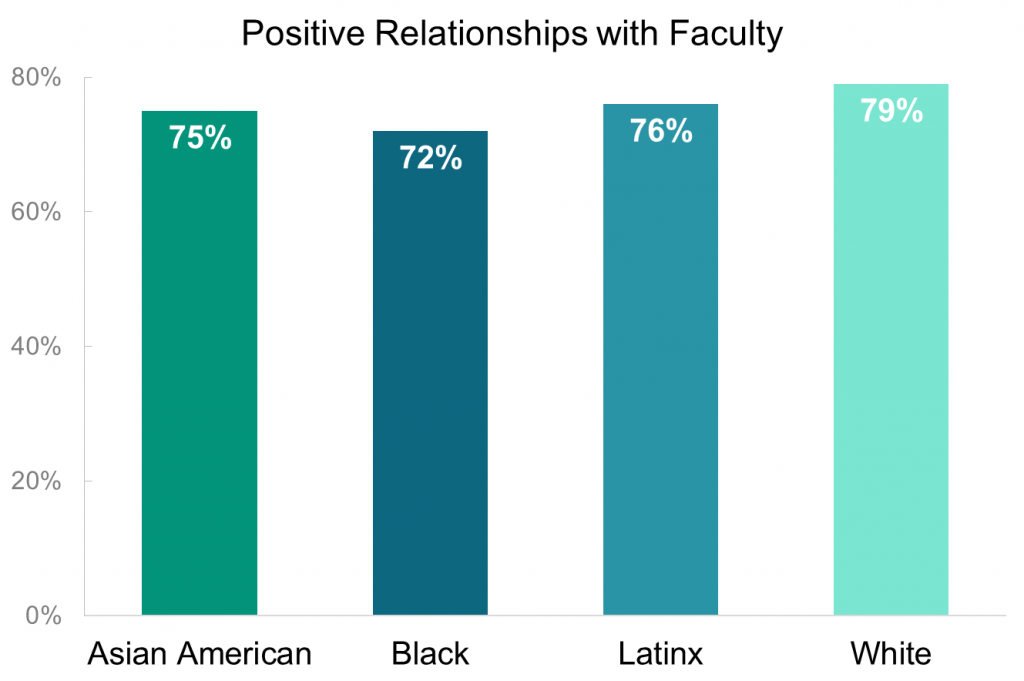
The vast majority of students (76%) report positive relationships with faculty, including interactions both in and out of the classroom. Meaningful interactions vary across student demographics, with notable race/ethnic differences. On multiple dimensions Black and Latinx students report more engagement and interaction with faculty than white and Asian American students. For instance, while a majority of all law students (57%) discuss assignments with faculty “often” or “very often,” 65% of Black students do so, the highest of any racial or ethnic group, followed by 58% of Latinx students, 56% of white students and 53% of Asian American students.
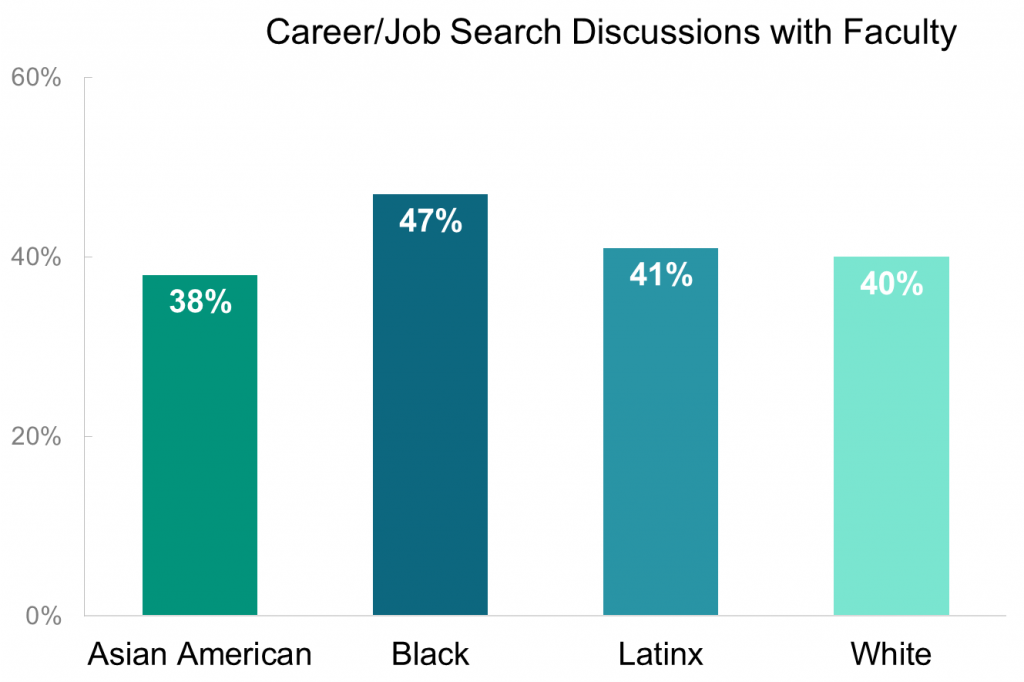
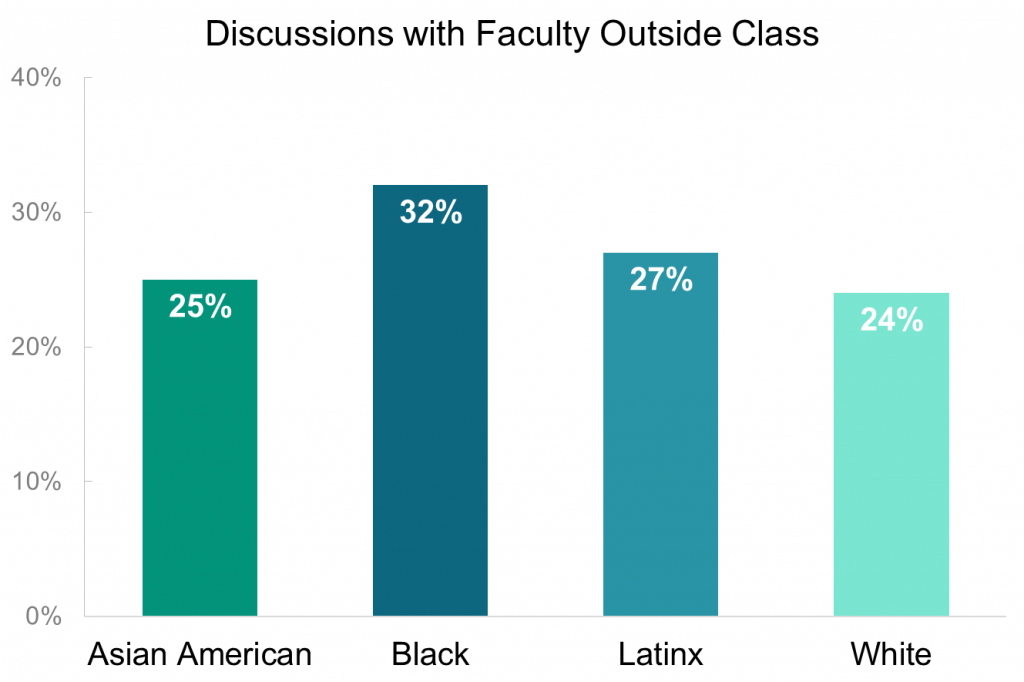
The pattern of Black and Latinx students enjoying higher rates of engagement with faculty persists across multiple dimensions. For example, Black students (47%) are more likely to discuss career or job search with faculty than Latinx (41%), white (40%), or Asian American (38%) students. Black and Latinx students are also more likely to talk with faculty outside of class. The vast majority of students find faculty available, helpful, and sympathetic. Interestingly, this sentiment does not directly track interaction with faculty, as a higher percentage of white students report favorable relationships with faculty than Black and Latinx students.
Preferences & Expectations for Employment After Law School by Gender
The newly released LSSSE 2017 Annual Results explore the relationship between students’ preferred and expected work settings post-graduation. Our most recent post in this series showed how these preferences and expectations are related to race and ethnicity. In this post, we will show how male and female law students differ in their preferences and expectations.
Seventy percent of male respondents indicate a preference for working in one of the private settings, compared to 59% of female respondents. Large firms are the most preferred among males. Medium-sized law firms are the most preferred private setting for female respondents. Government agencies are the most preferred public service setting for both groups, with female respondents more likely to indicate this preference.
Sixty-one percent of female respondents expect to work in the same type of setting they prefer; fifty-eight percent of males did so. Medium-sized law firms are the most commonly expected work setting for both groups, which for males was a shift from their preference for large firms. Government agencies are the most commonly expected public service setting for both groups.
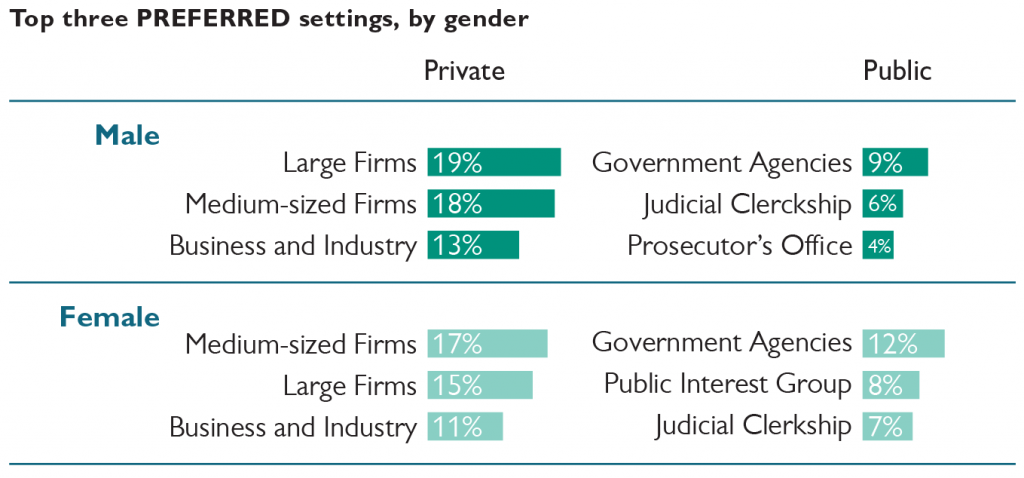
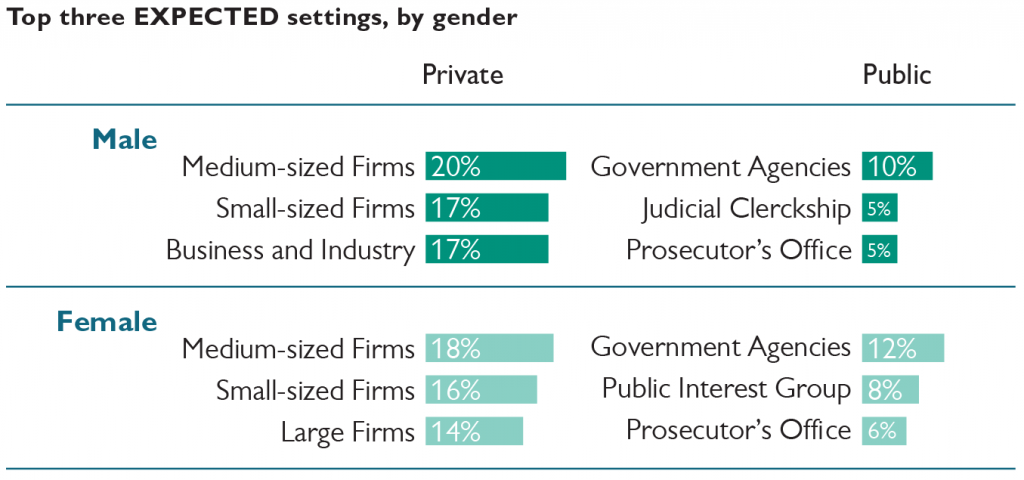
Male respondents are more likely than females to prefer to work in public service but expect to work in a private setting. Female respondents are more likely than males to prefer to work in a private setting but expect to work in public service.

Trends in Preferences & Expectations for Employment After Law School
The newly released LSSSE 2017 Annual Results explore the relationship between students’ preferred and expected work settings post-graduation. In a series of related blog posts, we will share tidbits of information about where law students hope to work, where they expect to work, and how these preferences and expectations vary by race and gender. In our final post, we will look at patterns in students’ preferred and expected work settings relative to their projected levels of student loan debt.
LSSSE asks respondents to identify the setting in which they would most prefer to work after graduation and the setting in which they most expect to work. Preferences can be seen as representing a respondent’s ideal outcome; expectations can be seen as representing perceptions of a realistic outcome. For both questions, respondents are asked to choose between sixteen answer options.
For purposes of much of the analyses in this report, the answer options were divided into two broad groups:
Public Service Settings
- Academic
- Government agency
- Judicial clerkship
- Legislative office
- Military
- Prosecutor’s office
- Public defender’s office
- Public interest group
Private Settings
- Accounting firm
- Business and industry
- Nonlegal organization
- Private firm – small (fewer than 10 attorneys)
- Private firm – medium (10-50 attorneys)
- Private firm – large (more than 50 attorneys)
- Solo practice
The “Other” response was removed from our analysis. The primary factor underlying the assignment of an answer option to one of the two groupings was whether a person working in that setting would likely qualify for Public Service Loan Forgiveness (PSLF), which typically requires one to be employed in the government or non-profit sector. There is naturally some imprecision in the assignments.
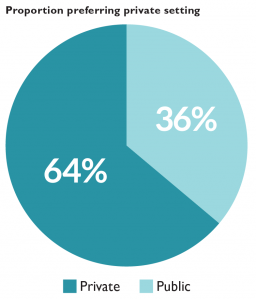
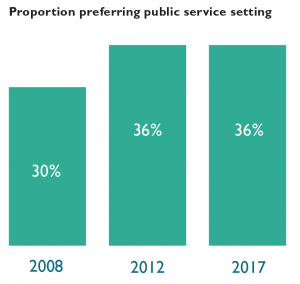
Sixty-four percent of respondents indicate a preference for working in one of the private settings, with the remaining 36% preferring public service. This proportion is unchanged from five survey administrations ago (2012) and higher than the 30% public service proportion ten administrations ago (2008).
Seventeen percent of respondents would prefer to work in medium-sized law firms, making this category the most popular private setting and the most popular setting overall. Government agencies are the most popular public setting, with 11% of respondents indicating that preference. Medium-sized law firms are also the most commonly expected private work setting, accounting for 20% of respondents. Small law firms are the fourth most preferred private setting yet the second most common expected setting. Government agencies are the most commonly expected public service setting.
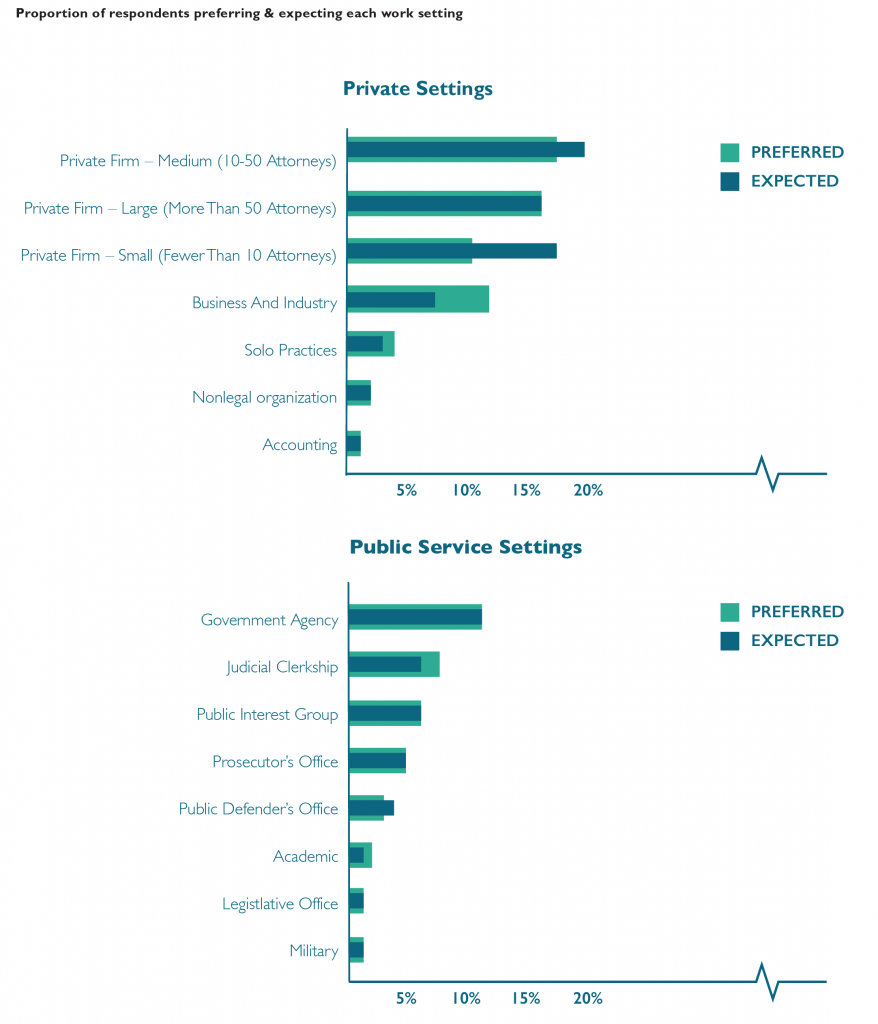
Forty-four percent of respondents indicate a different expected work setting than their preferred setting. Respondents who prefer to work in an academic setting are least likely to expect to work in that setting, with only about one-in-five matching preference with expectation. Respondents who prefer to work in large law firms or as prosecutors are most likely to also expect to work in those settings.
Forty-six percent of respondents who prefer one of the public service settings expect to work in a non-preferred setting, including one-quarter who expect to work in private settings instead. Forty-one percent of respondents who prefer one of the private settings expect to work in a different setting, but only 12% of students who prefer to work in a private setting expect to work in public service instead.
LSSSE Demographic Characteristics Reflect the U.S. Law Student Population
The Law School Survey of Student Engagement (LSSSE) provides a treasure trove of information about the law school experience from the perspective of law students themselves. LSSSE partners with legal education scholars to provide access to de-identified data about topics ranging from student satisfaction to time usage to personal and professional development. Many researchers – particularly those interested in questions of diversity and equity – are interested in how closely the students surveyed by LSSSE reflect the gender and racial/ethnic composition of the entire law school population. To answer this question, we compared the self-reported gender and race of 2017 U.S. 1L LSSSE respondents to the 2017 matriculant gender and race/ethnicity aggregate data available from the American Bar Association (ABA).
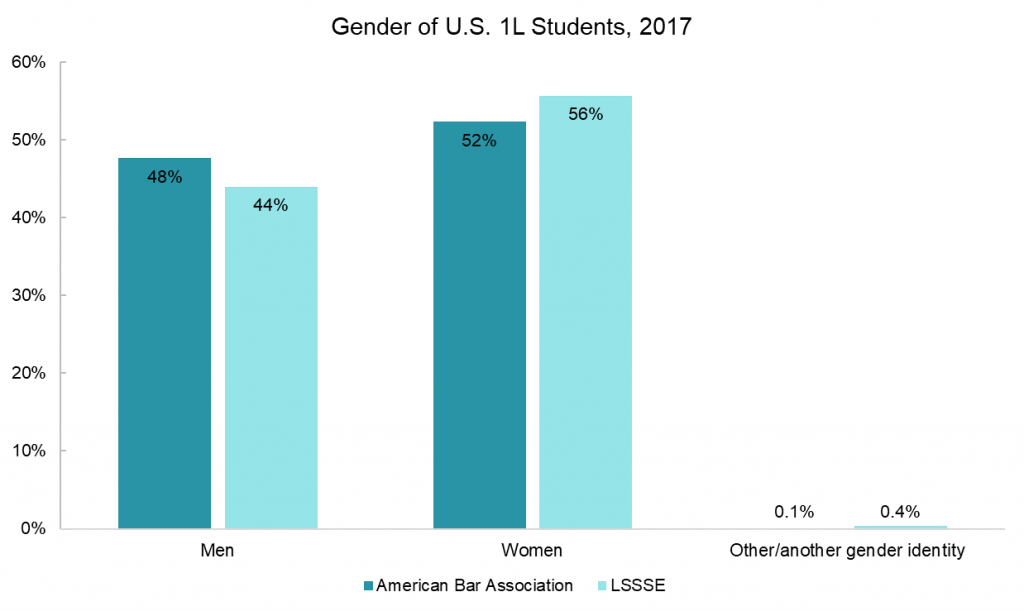
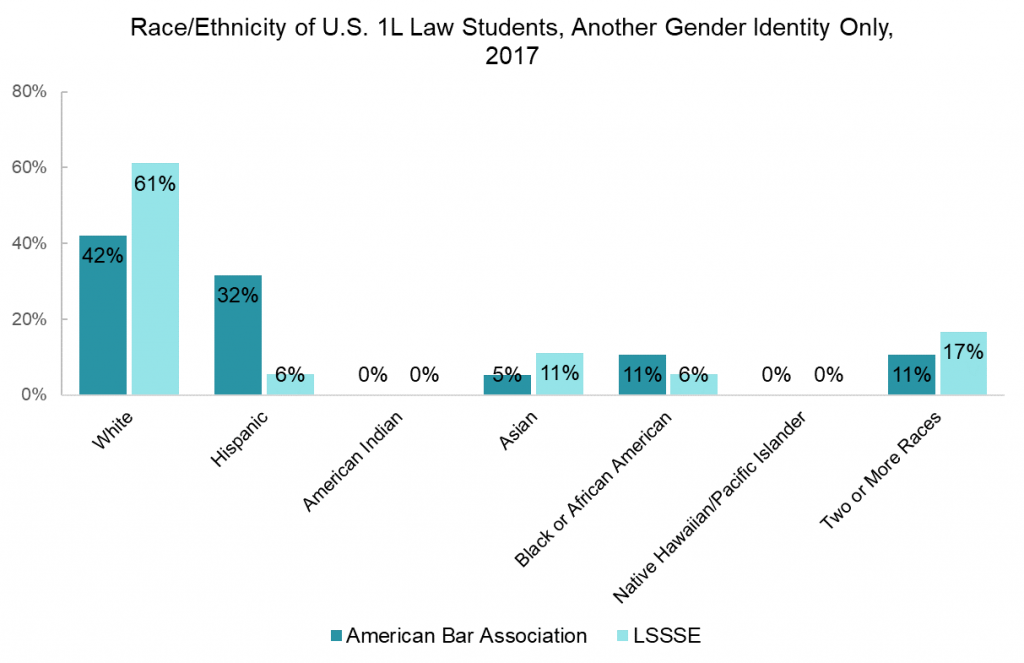
The ABA reported that slightly more women than men enroll in law school (52% vs. 48%). U.S. 1L LSSSE respondents in 2017 were similarly more likely to be female than male (56% vs. 44%). Although both the ABA and LSSSE collected data students identifying as “Other” (ABA) and “Another gender identity” (LSSSE), these individuals make up only a tiny fraction of the law student population (24 people according to the ABA and 22 people who responded to LSSSE).
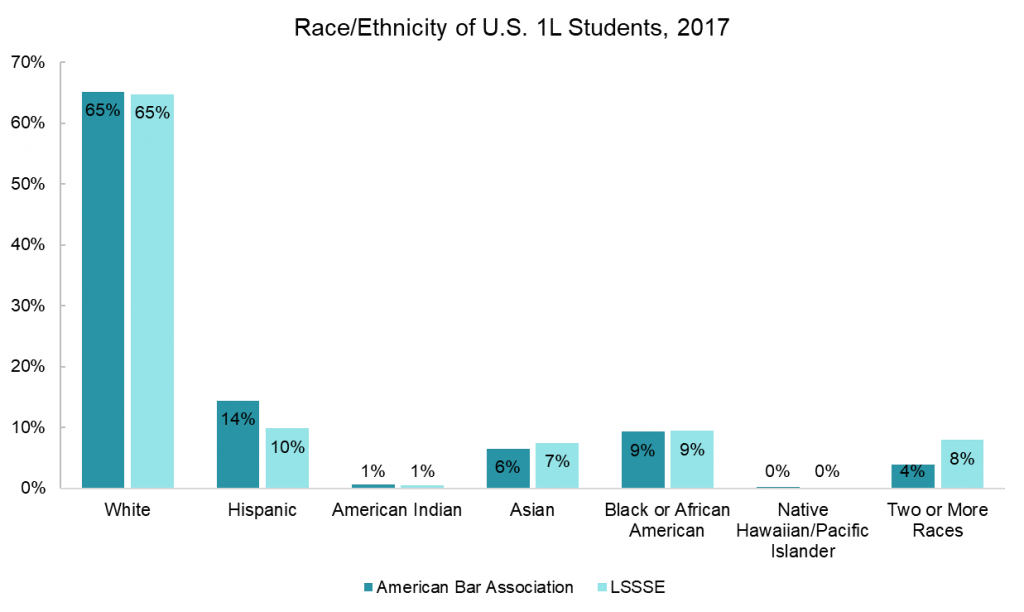
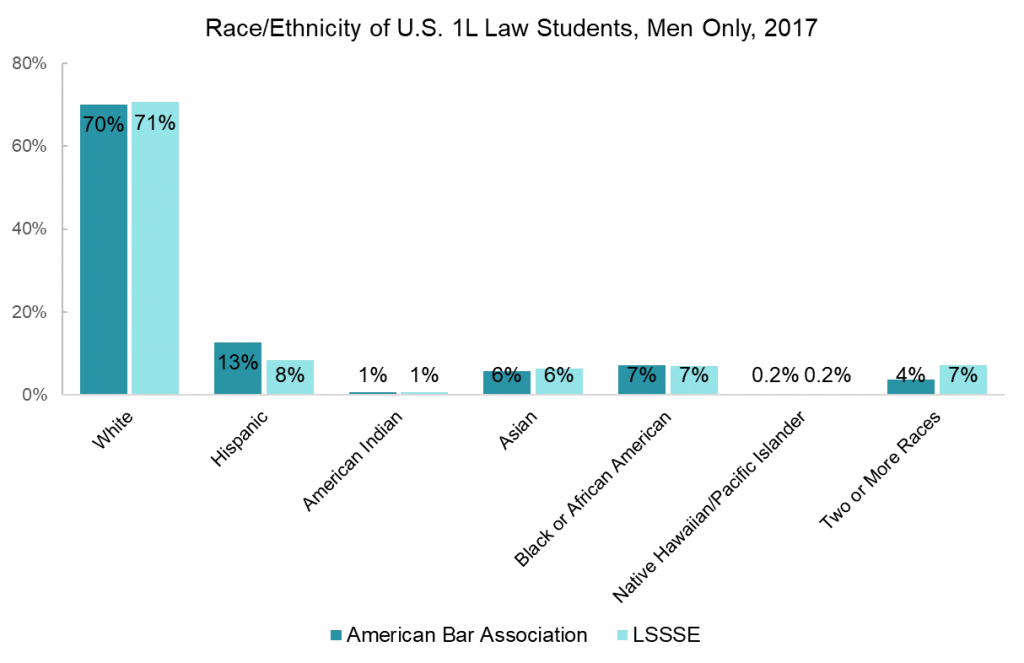
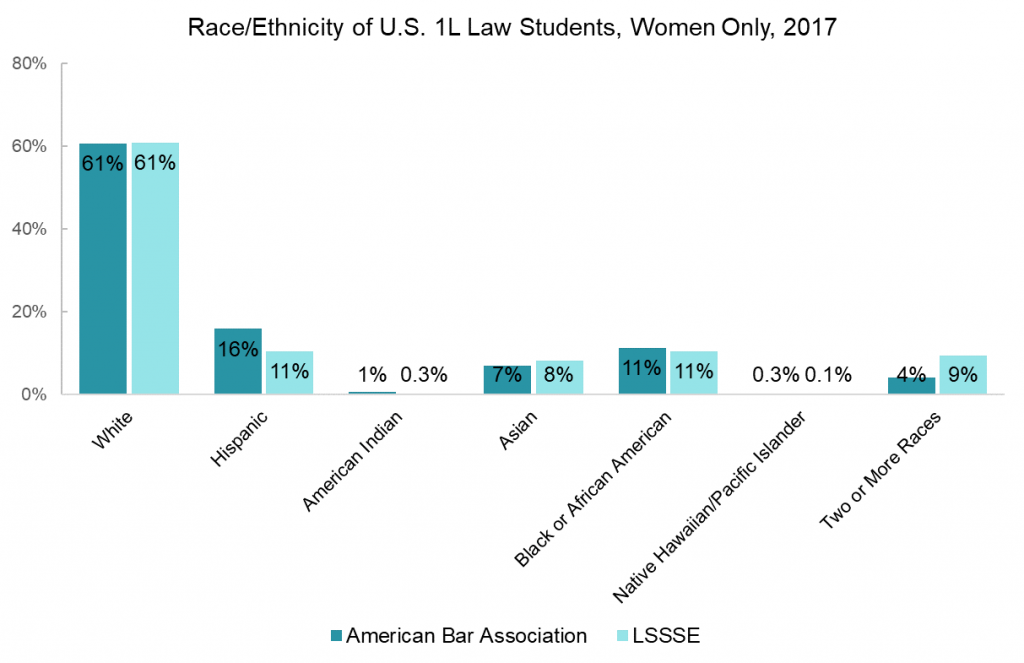
The 1L students who responded to LSSSE in 2017 were also quite similar to the overall population of 1L students at all ABA-accredited programs in terms of racial/ethnic makeup. Sixty-five percent of both groups were white, nine percent were black or African-American, and around six percent were Asian or Asian-American. The ABA reported a slightly higher proportion of Hispanic students (14%) compared to the proportion of Hispanic LSSSE respondents (10%), and LSSSE respondents were more likely than the population of 1L students at ABA-accredited law schools to be multiracial (8% vs. 4%). However, the overall pattern of race/ethnicity frequency is quite similar among the two populations. Thus, LSSSE respondents tend to represent the demographic characteristics of law students in general.
The ABA and LSSSE datasets also allow us to examine the intersection of gender and race/ethnicity among 1L students. Interestingly, a higher proportion of male law students than female students are white (70% vs. 61%). The general trends regarding the proportions of students from different racial and ethnic groups described across all students hold true for men and women when examined separately, but the same cannot be said for students of other gender identities, likely because this group is so small.
In the aggregate, LSSSE offers a representative sample of law students in terms of both race/ethnicity and gender identity, making it a great source of information about student engagement and the law school experience. Check out some of the publications using LSSSE research or contact us to discuss how a LSSSE data-sharing agreement might enhance your legal education research project.


