Law School Service Use: LSSSE 2017
Law schools offer services to support student success both during law school and after graduation. For seven core law school services, LSSSE asks students to either rate their satisfaction or to indicate that they did not use a particular service during the current school year. Student satisfaction levels can help guide efficient resource allocation, and non-use rates can highlight services that are overlooked or underused.
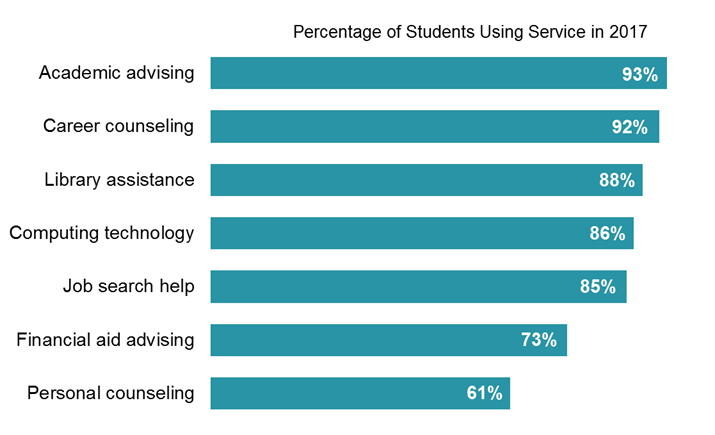
Service use was quite high among U.S. law students in general. The greatest demand was for academic advising services, which were used by 93% of students. Nearly as many students (92%) sought career counseling. Personal counseling was the least used resource, with only 61% of students giving a satisfaction rating for this service.
Among law students who answered all seven service-use questions, the average number of services used was 5.8. Part-time students used an average of 5.1 services, which was less than full-time students, who used 5.9 services on average.
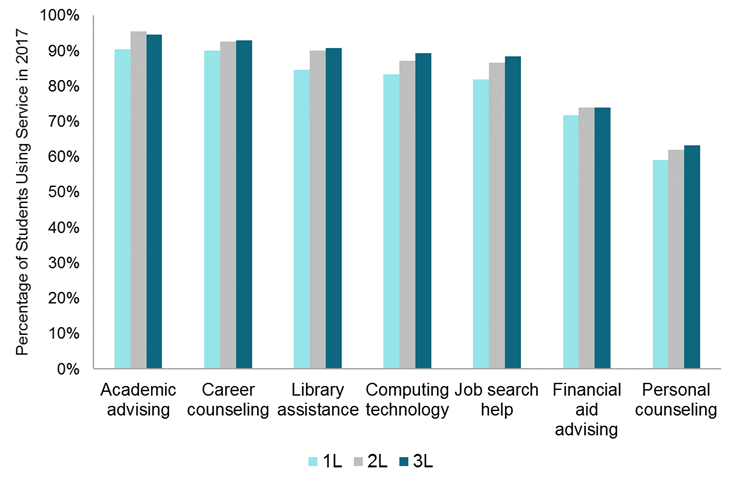
Each service showed slightly higher usage among 2L and 3L students than among 1L students. This makes intuitive sense for certain services (such as job search help) that may be more relevant during later stages of the law school experience. However, this finding is somewhat surprising for more general student services such as library assistance and computing technology.
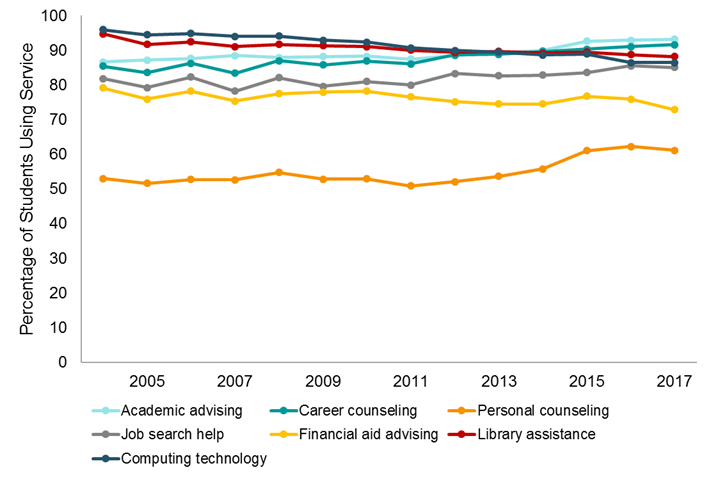
Finally, service usage has fluctuated somewhat since LSSSE started measuring student satisfaction in 2004. Use of personal counseling is trending upward, with 53% of students using this service in 2004 and 61% of students using it in 2017. Conversely, use of computing technology has decreased markedly, with 96% of respondents reporting using law school technology in 2004, compared to 86% in 2017.

LSSSE Annual Results 2006-2016: What Has Remained the Same?
In the our last post, we re-visited the LSSSE 2006 Annual Results (pdf) to look at how the trends identified as “Disappointing Findings” in 2006 compare to the results from the LSSSE 2016 survey. Today we will look at what patterns in law student engagement have remained the same.
What has not changed in the last decade?
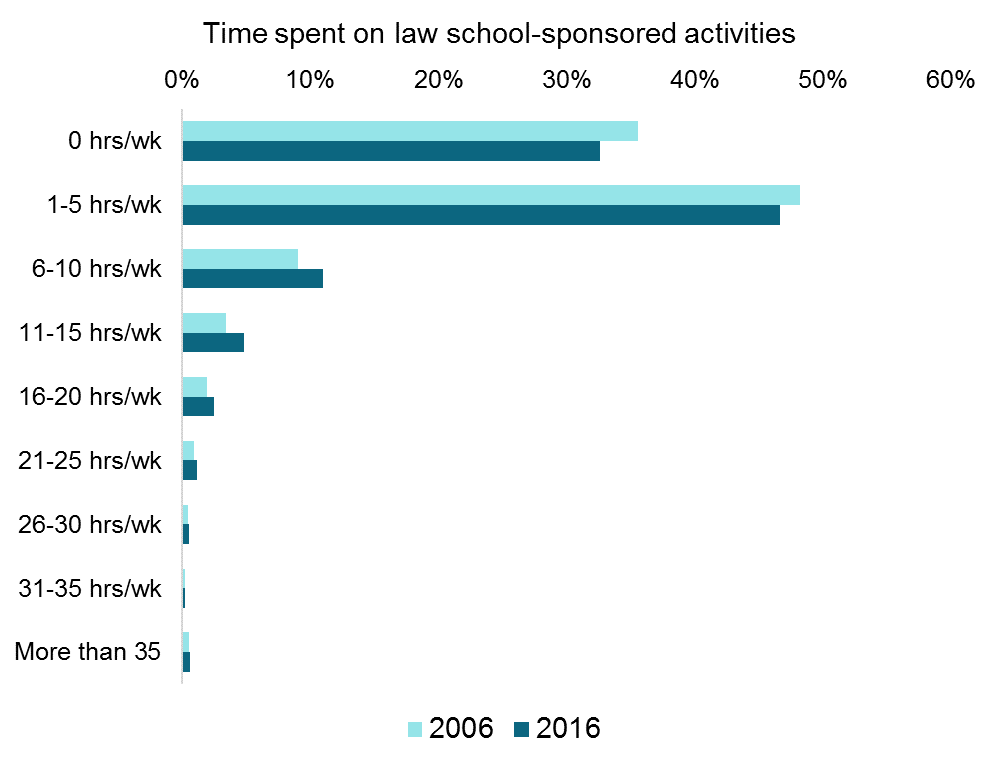
Although participation in public service has increased among law students, participation in law school-sponsored organizations (clubs, journal, committees, moot court, etc.) among all law students has stayed relatively stable. More than a third of law students (36%) spent no time during the week participating in these organizations in 2006; in 2016 the non-participation rate dipped only slightly to 33%.
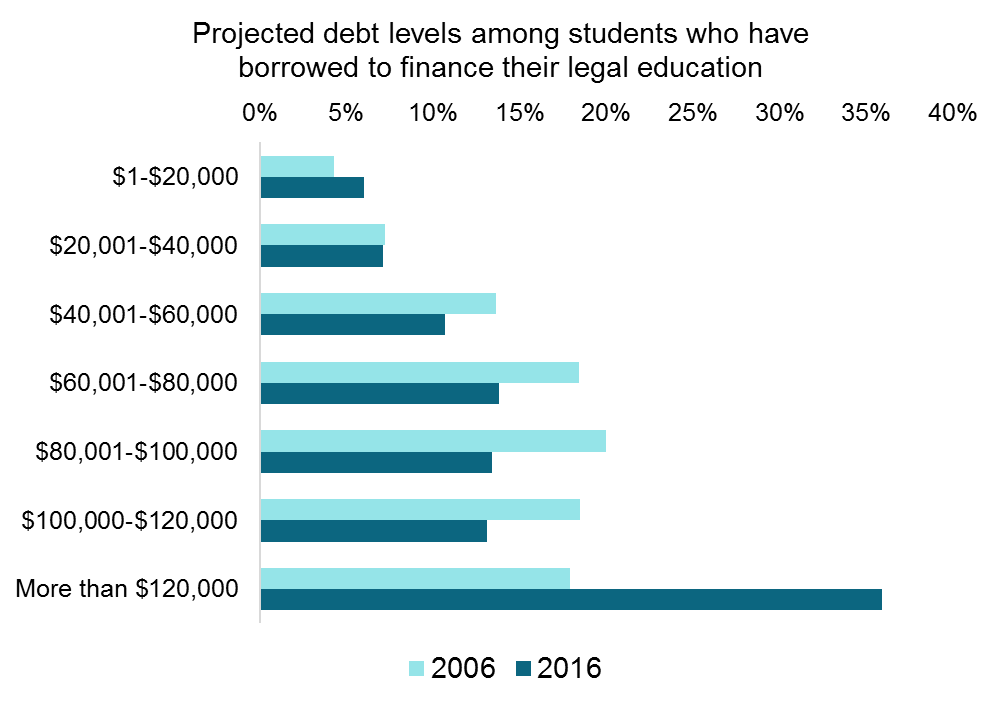
Surprisingly, at first glance the student debt load appears unchanged from 2006 to 2016. In 2006, the LSSSE Annual Results noted that of those students at U.S. law schools who incurred debt related to their legal education, 75% will owe more than $60,000 by graduation. In 2016, that number was 76%. However, if we look at the distribution of debt by category, we see a remarkably different picture. In 2006, survey respondents selected their projected debt law school debt using the following categories:
- $0
- $1-$20,000
- $20,001-$40,000
- $40,001-$60,000
- $60,001-$80,000
- $80,001-$100,000
- $100,000-$120,000
- More than $120,000
In 2016, those categories were expanded to more accurately capture higher debt levels among law students:
- $0
- $1-$20,000
- $20,001-$40,000
- $40,001-$60,000
- $60,001-$80,000
- $80,001-$100,000
- $100,000-$120,000
- $120,001-$140,000
- $140,001-$160,000
- $160,001-$180,000
- $180,001-$200,000
- More than $200,000
If we collapse the higher categories from the 2016 data into a single “More than $120,000” category to compare with the 2006 data, it becomes clear that student loan debt has become much more onerous for law students in 2016 compared to 2006, despite the fact that the overall percentage of students who owe more than $60,000 has remained unchanged.
The pattern is similar among students who wish to work for public interest organizations, which generally pay less than other law careers. In 2006, the LSSSE Annual Results warned that 67% of aspiring public interest lawyers expected to owe more than $60,000 upon graduation. In 2016, the exact same percentage (67%) of students hoping to work for public interest organizations reported expecting to owe more than $60,000, but the percentage of students who wish to work for public interest organizations and who will owe more than $120,000 has approximately doubled.
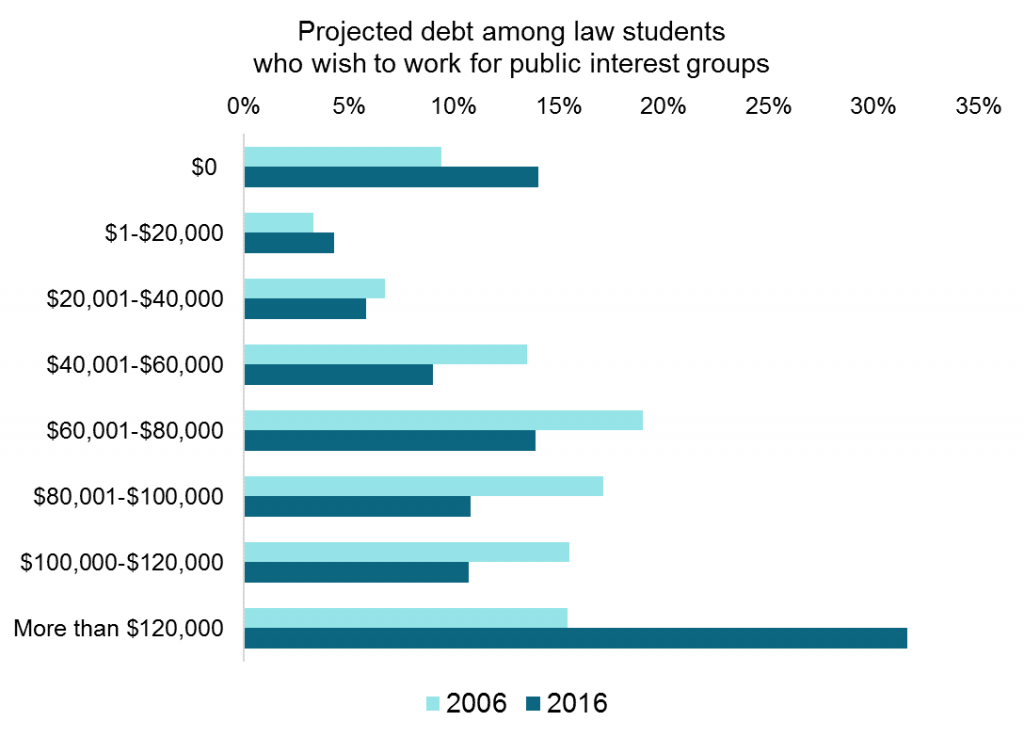
The LSSSE 2016 results show that while the percentage of students who will owe more than $60,000 has not changed between 2006 and 2016, students in the highest borrowing categories are taking on significantly heavier financial burdens than students in 2006.

LSSSE Annual Results 2006-2016: What Has Changed?
The 2006 LSSSE Annual Results (pdf) targeted several potential areas of improvement for law student engagement. In particular, the report highlighted somewhat low participation in pro bono and volunteer work and a relative lack of time spent on law school-sponsored activities. The report also noted a high student debt load, particularly among students who planned to work for public interest organizations. We used the 2016 LSSSE data to see what has changed and what has stayed the same over the last ten years. In this first of two posts, we will describe what has changed in the last decade.
What has changed in the last decade?
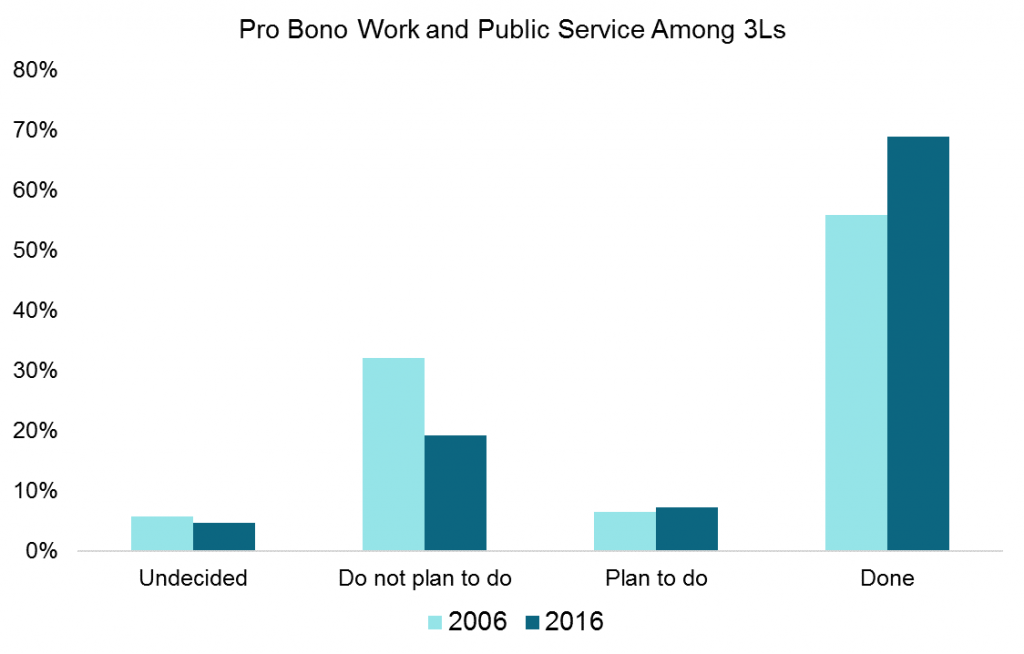
Participation in public service among law students has increased substantially. In 2006, nearly a third of 3L respondents (32%) reported that they had not done any pro bono or volunteer work during law school and had no plans to do so. In 2016, only 19% of 3L respondents reported having not done any pro bono work or public service and having no plans to do so. In terms of weekly time usage, three-quarters (77%) of 3L respondents in 2006 spent no time during the week on legal pro bono work not required for class. By 2016, that number had declined to 66% of 3Ls.
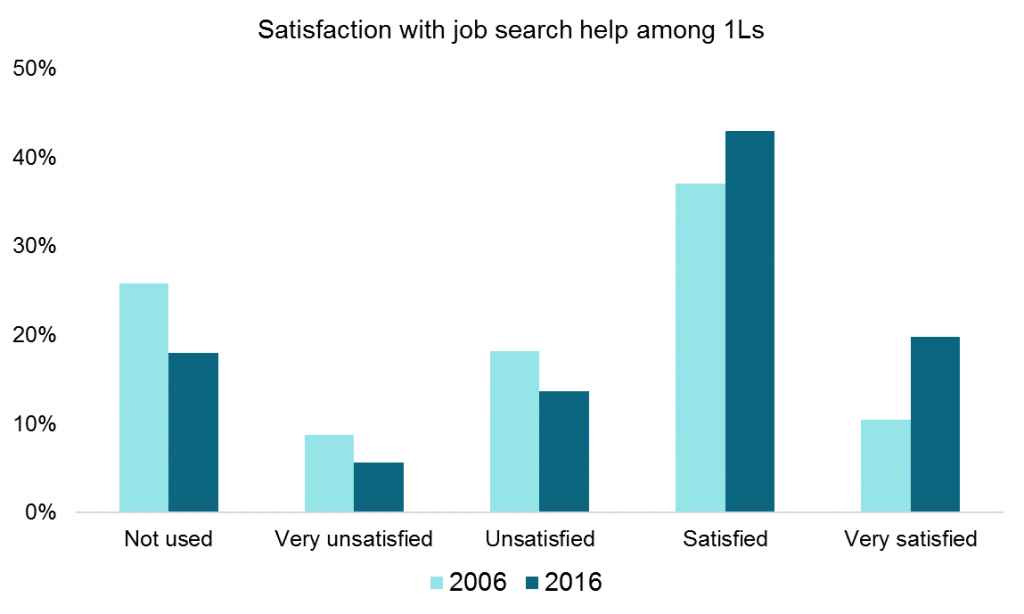
More law students are using job search assistance earlier in their legal educations, perhaps due to increased awareness of changes in the legal employment landscape. One in four 1Ls (26%) reported never using job search assistance at their law school in 2006. In 2016, that number was less than one in five (18%).
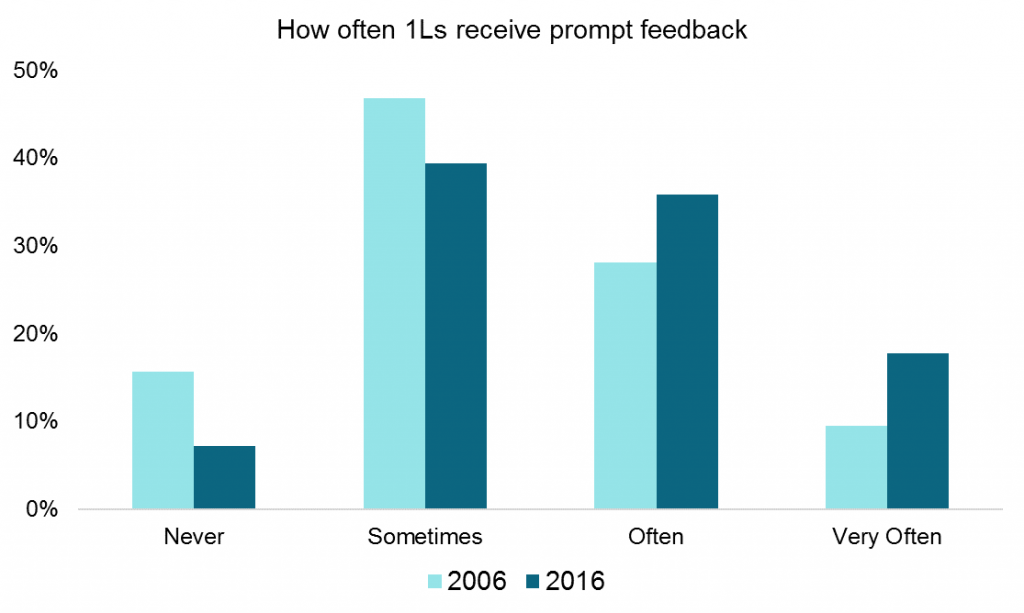
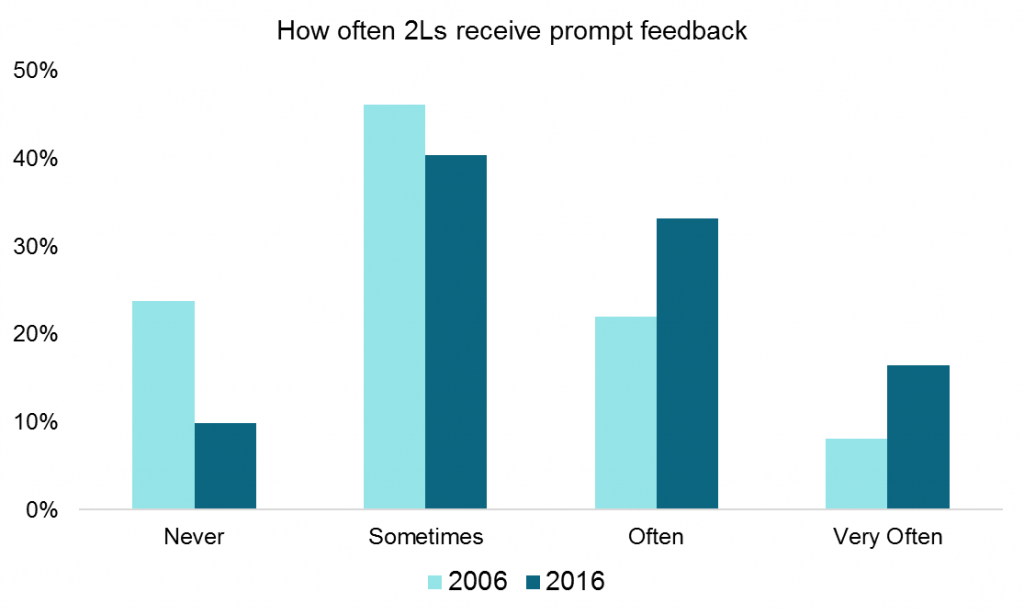
Law school faculty also appear to be more diligent about giving timely feedback to students. In 2006, about 15% of 1Ls and 24% of 2Ls reported never receiving prompt feedback from faculty members. In 2016, only 7% of 1Ls and 10% of 2Ls said they never received timely feedback from faculty.
Overall, law school students in 2016 showed more participation in public service and greater satisfaction with faculty feedback. This suggests progress in ameliorating some of the concerns identified by the 2006 LSSSE Annual Report. In our next post, we will look at which of the findings from 2006 are still areas ripe for improvement today.