Dispelling the Asian American Monolith Myth in U.S. Law Schools
Dispelling the Asian American Monolith Myth in U.S. Law Schools

Katrina Lee
Clinical Professor of Law, and Director of Program on Dispute Resolution
The Ohio State University, Moritz College of Law

Rosa Kim
Professor of Legal Writing
Suffolk University Law School
In the past year, following an exponential rise in anti-Asian violence and discrimination in the U.S., we wrote an essay about inclusion of Asian American faculty in legal academia. We discussed harmful stereotypes and myths about Asian Americans. We called on the legal academy to do more to acknowledge and address the challenges faced by Asian American faculty and to amplify their voices, work, and presence.
Law schools must also do the same for Asian American students in U.S. law schools.
Asian Americans have often been viewed and treated as a single homogenous group. And yet the story of Asians in America is one of rich diversity. Today more than 20 million people who identify as Asian American live in the U.S.[1] The term Asian American encompasses at least 21 distinct groups.[2] In 2019, people who identify as Chinese, Indian, Filipino, Vietnamese, Korean, and Japanese accounted for 85% of Asian Americans.[3]
Asian Americans are diverse economically. The disparities in income across Asian American households are among the widest in the country. While Asian American households in the U.S. had a median annual income of $85,800 in 2019—higher than the $61,800 among all U.S. households—most groups of Asian Americans report household incomes well below the national median for Asian Americans.[4] For instance, Burmese American households have a median income of $44,400.[5]
Unsurprisingly, Asian American law students[6] are diverse. LSSSE survey data about Asian American students dispels the monolith myth and reveals the need for law schools to act to provide support for all Asian American students. LSSSE’s recent report of Asian American law students is aptly named Diversity within Diversity: The Varied Experiences of Asian and Asian American Law Students.
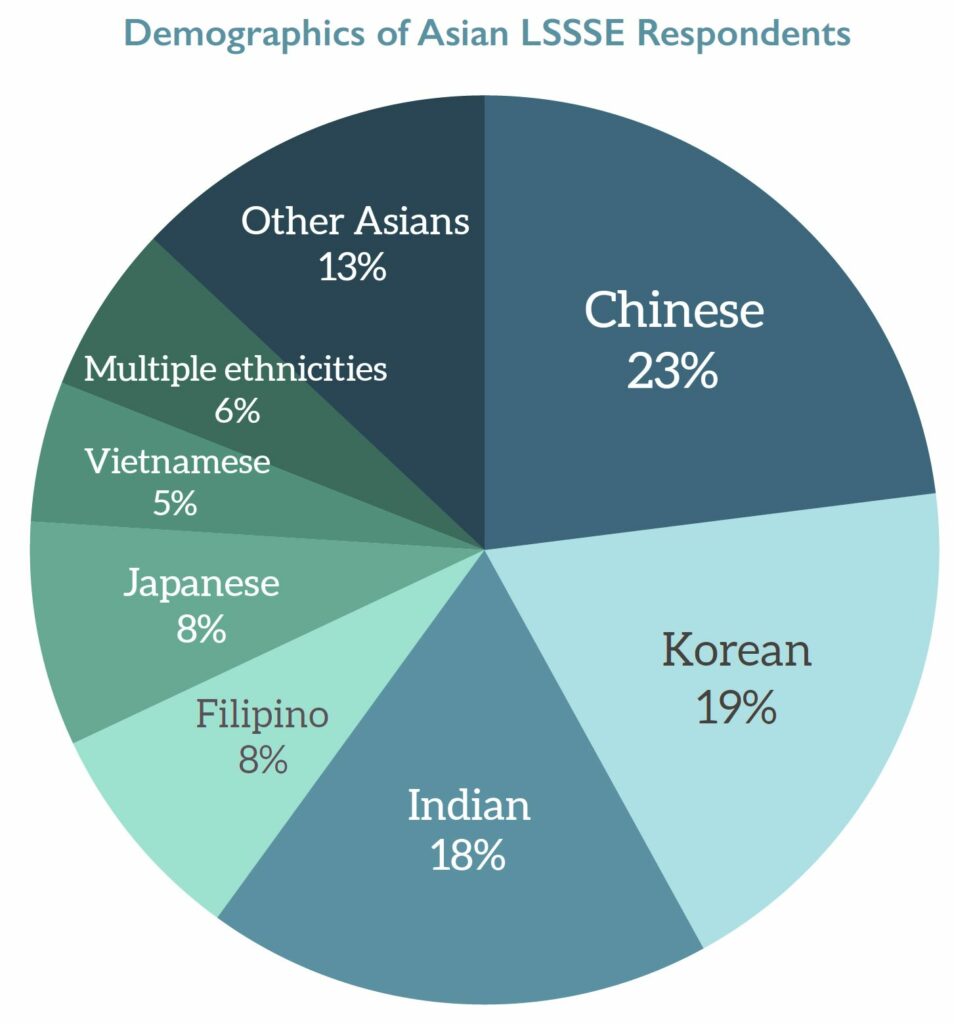
Within the group of Asian American law students surveyed, 81% of respondents comprised six ethnic groups: Chinese, Korean, Indian, Filipino, Japanese, and Vietnamese.
International students of Asian descent are a growing cohort in U.S. law schools. By far, Chinese respondents were more likely than any other group to be international students; 50% percent of them identified as international students, while just 1% of Filipino respondents identified as international students.

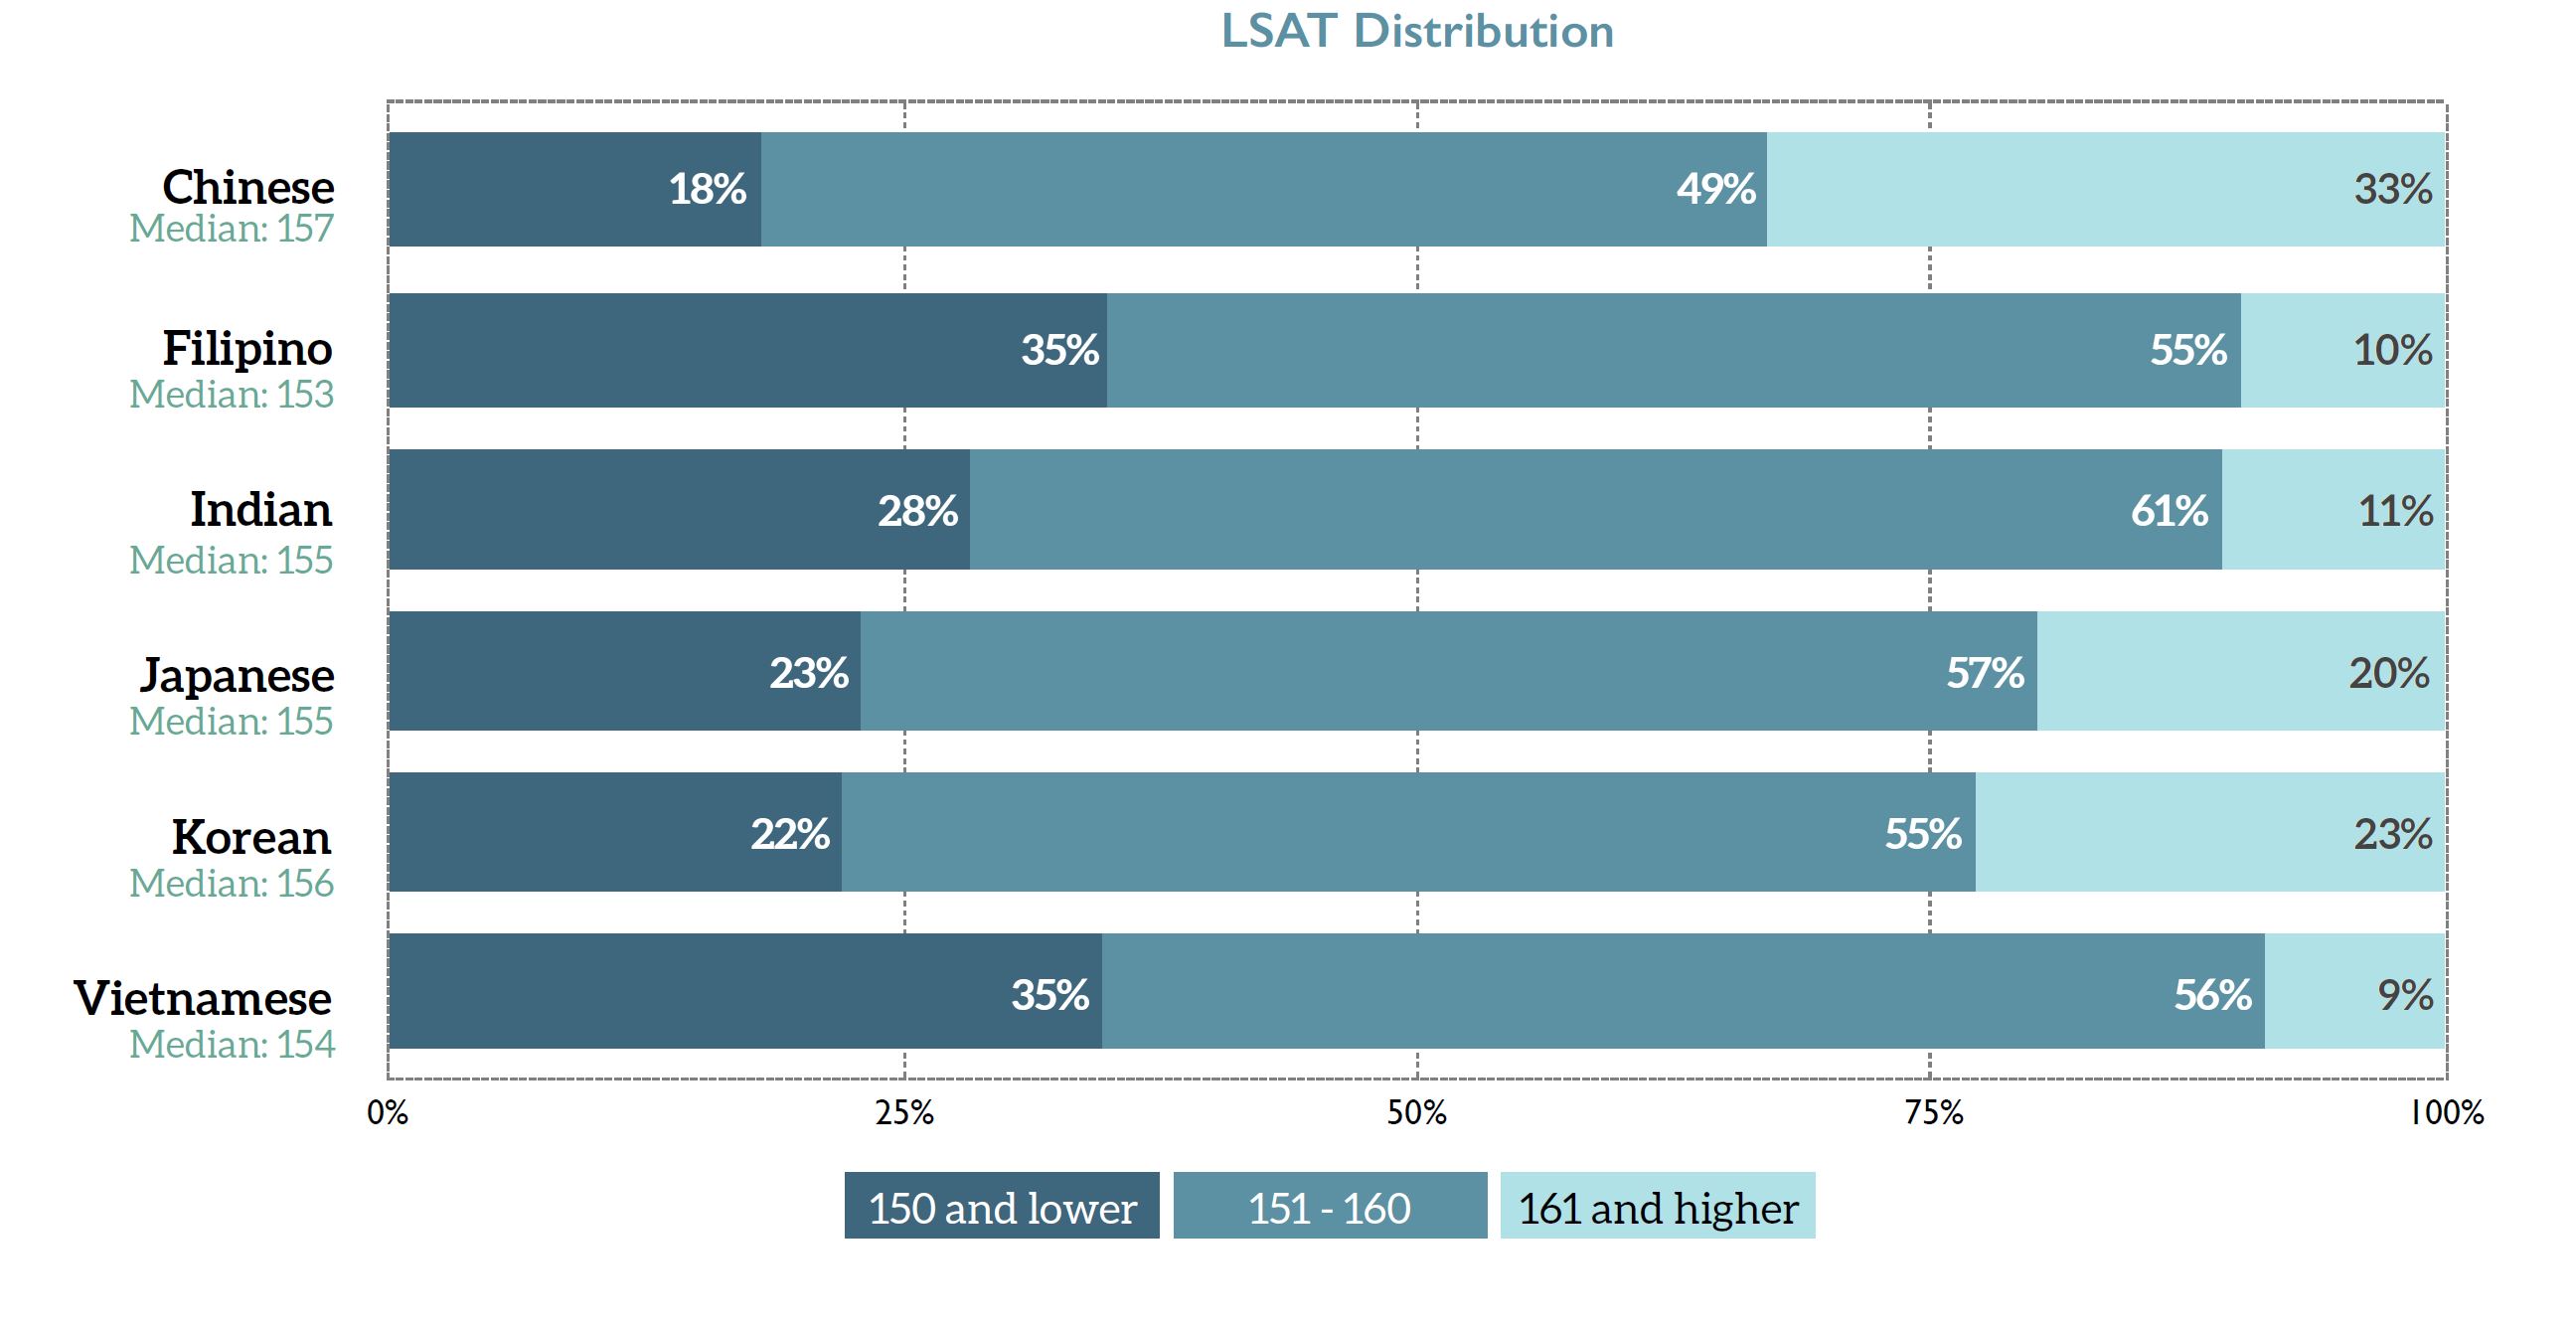
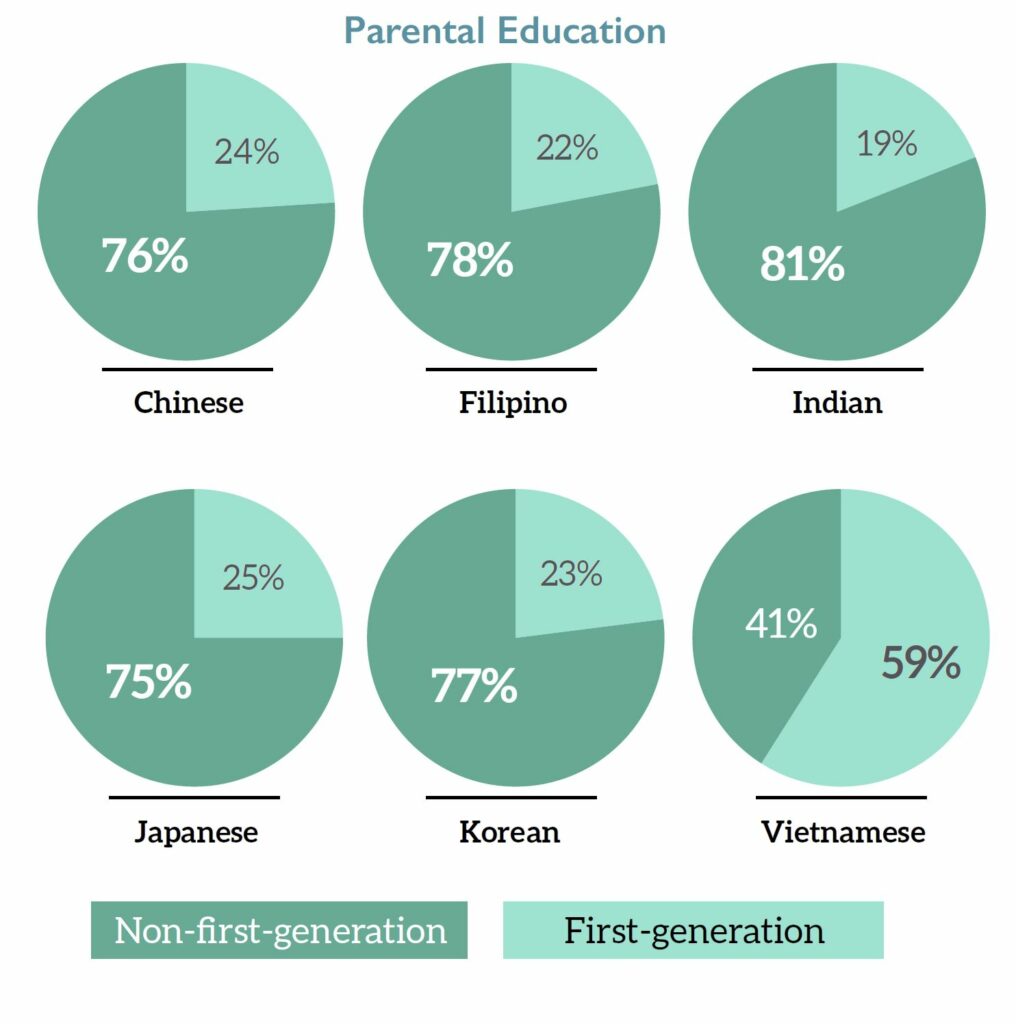
In the areas of LSAT scores and parental education levels, the LSSSE uncovered dramatic differences across ethnic subgroups. About 1 in 3 Chinese respondents had LSAT scores above 160. As a point of comparison highlighting the Asian American diversity, fewer than 1 in 11 Vietnamese respondents had scores at that level. Only 41% of Vietnamese law student respondents had at least one parent with a BA/BS or higher, in contrast with 81% of Indian law student respondents and 78% of Filipino law student respondents.
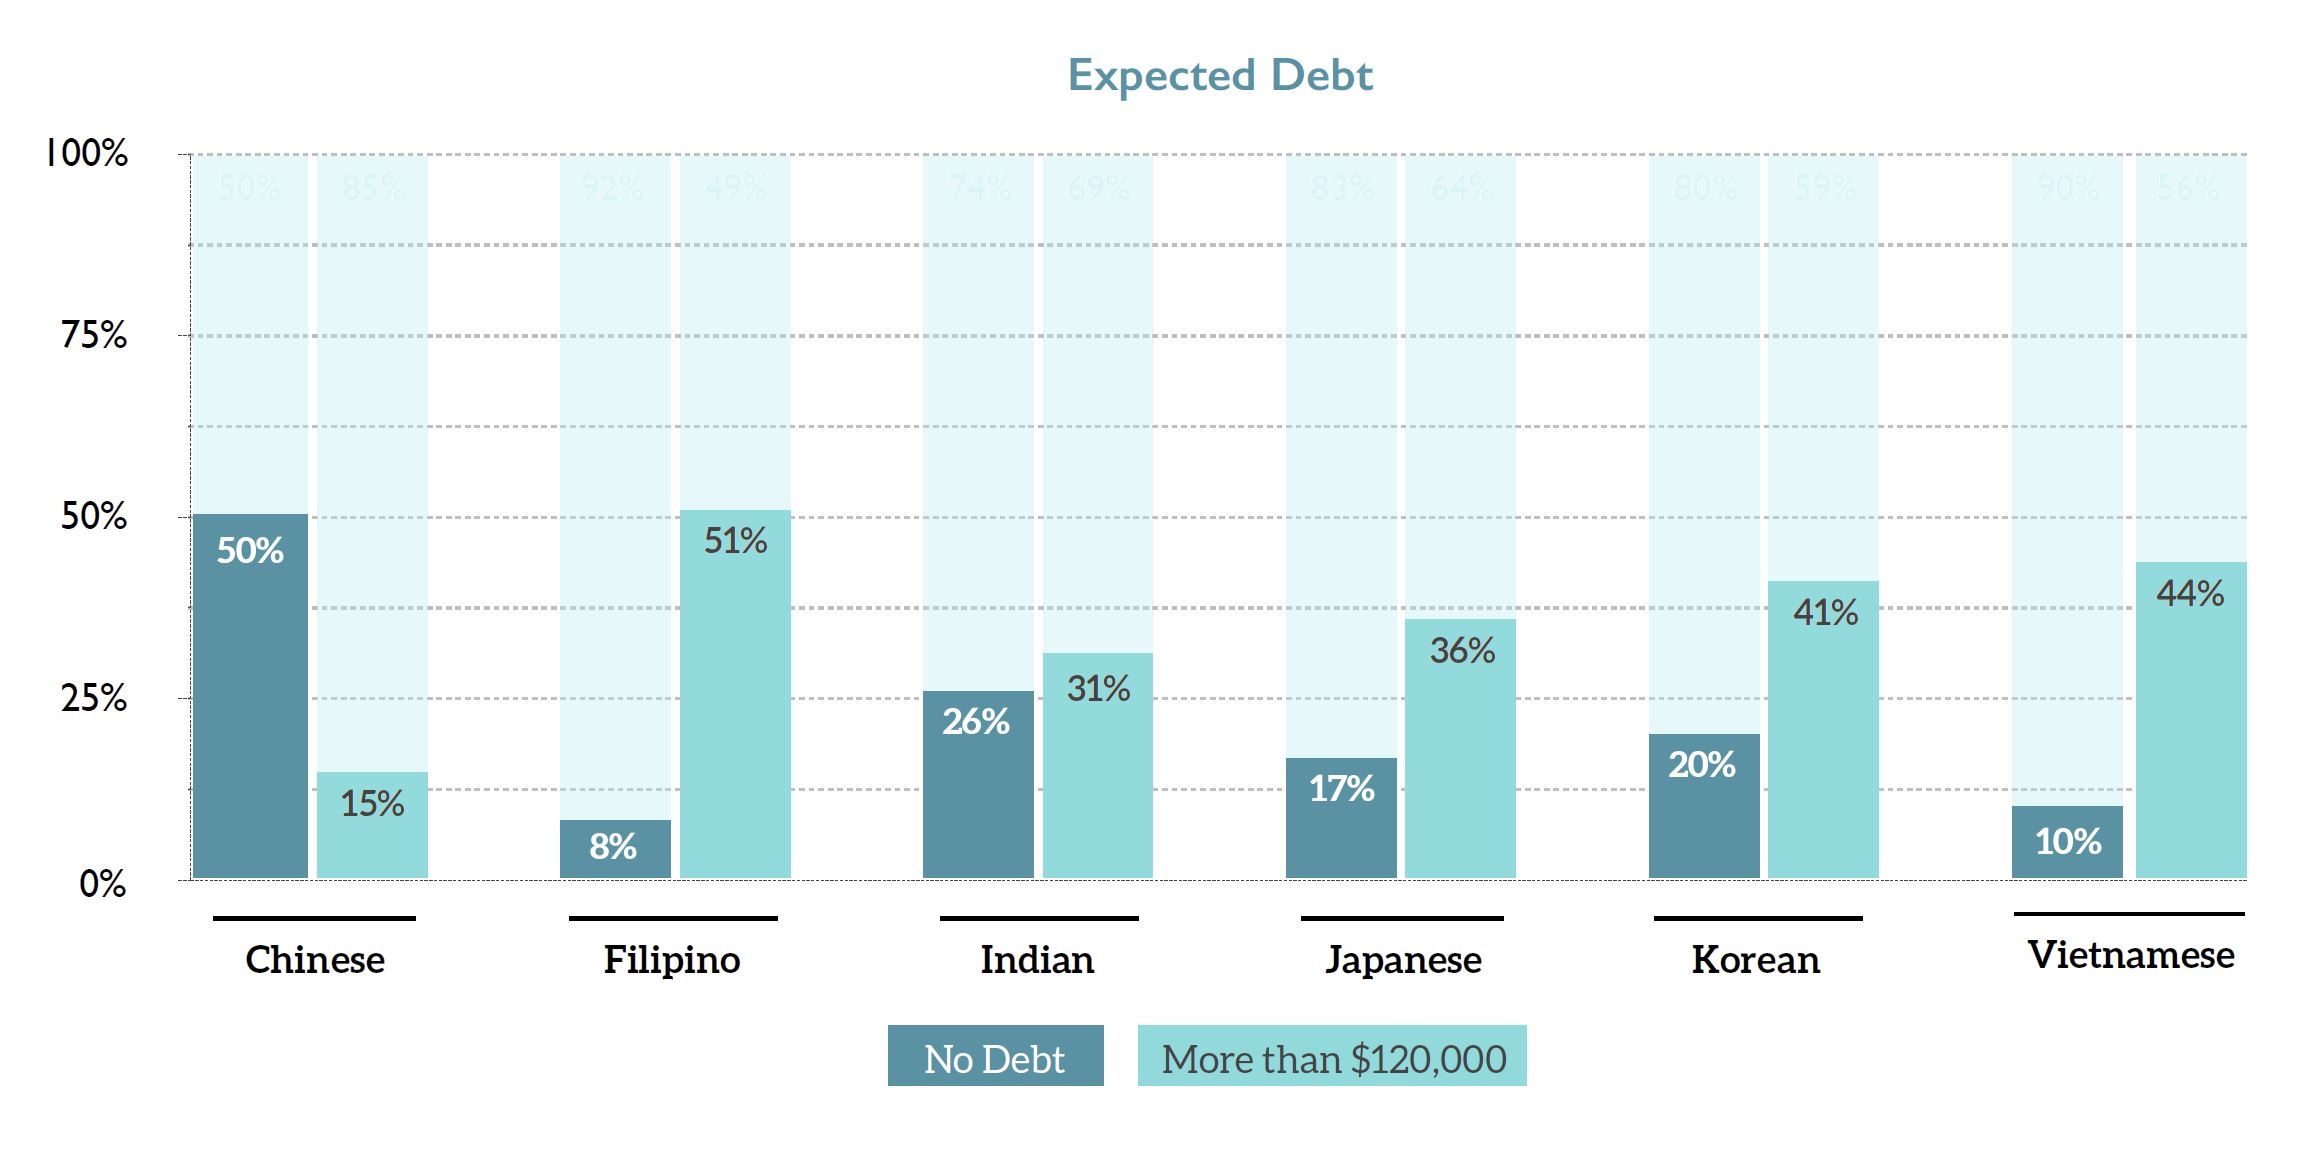
Law student debt expectation also varies significantly across ethnic subgroups. Only 15% of Chinese respondents expected to have more than $120,000 in debt after law school, compared with 51% of Filipino respondents and 44% of Vietnamese respondents. (The disparity could be explained in part by the prevalence of international students among certain respondent subgroups. 50% of Chinese respondents identified as international, while only 1% of Filipino students did. As LSSSE notes, international students are twice as likely to expect no law school debt than domestic students.)
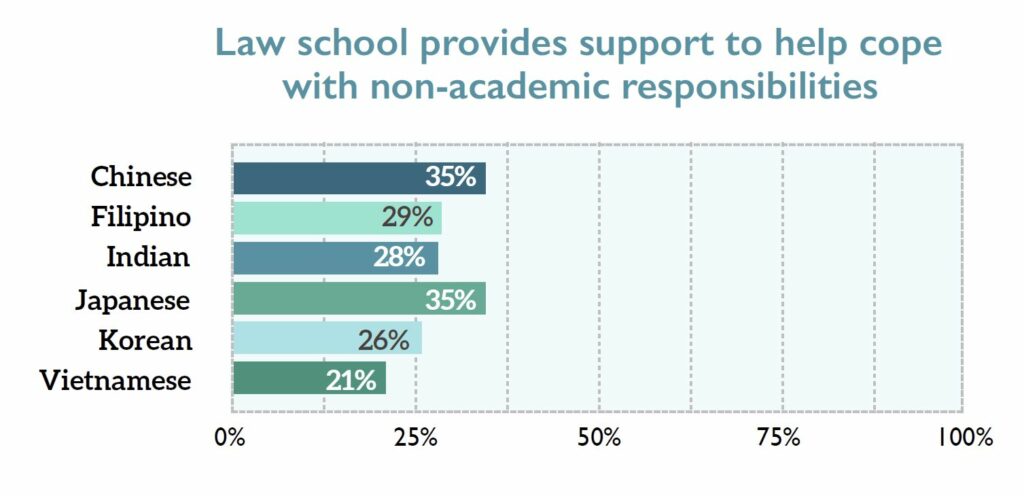
With regard to Asian American law students’ perceptions regarding law school support, Asian American law students generally do not feel they receive law school support to cope with non-academic responsibilities. Thirty-five percent of Chinese respondents and only 21% of Vietnamese respondents felt that support was provided.
Given the LSSSE data, viewing Asian American law students as a monolith–as, for example, a group that finishes law school incurring little debt and that is a “model minority” with LSAT scores in the highest percentiles–would be a mistake. Doing so would miss the mark by a long shot in ensuring effective support of Asian American law students. Appreciating the diversity and broad scope of Asian American experiences is a prerequisite to pursuing equity and inclusion of all Asian American law students.
In our essay this Spring on inclusion of Asian American law faculty, we provided an aspirational checklist of self-assessment questions for law schools. We provide here a complementary list of self-assessment questions for law schools seeking to support Asian American law students.
- Are there Asian American deans, associate deans, or faculty at the law school that Asian American students can look to for support?
- Does the law school work to connect Asian American law students with Asian American mentors within and outside of the law school?
- Are Asian American students encouraged to pursue judicial clerkships and other government job opportunities?
- Are Asian American students receiving mentorship for leadership and being suggested for leadership positions and other recognition at the law school?
- Do Asian American students feel supported in their efforts to pursue law school studies while managing financial need and family care responsibilities?
- Is providing faculty support to Asian American students valued and does the institution acknowledge and account for this additional faculty work for supporting Asian American students?
- Does the curriculum include Asian American law courses, and is Korematsu v. U.S. taught in a mandatory course?
- Does the law school offer co-curricular activities, like journals, competition teams, or study-away programs, related to Asian American law?
- Has the impact of current events and law school policies on Asian American students been discussed and included as part of the work of the DEI committee or staff?
- Are Asian American students invited to participate on DEI and other law school committees and encouraged to advocate for themselves?
The Diversity within Diversity report is a laudable step towards documenting the vast diversity among Asian American law students. Disaggregating the data for Asian ethnic subgroups–done for the first time through this 2016 survey–helps to reveal the scope of this diversity and illustrates the need for more research about law students of Asian descent. On the occasion of Asian American and Pacific Islander Heritage Month, we urge law schools to share this data with their communities and engage in a self-assessment to identify areas that need attention.
____
[1] See Abby Budiman and Neil Ruiz, Key facts about Asian origin groups in the U.S., PEW RSCH CTR (Apr. 29, 2021), https://www.pewresearch.org/fact-tank/2021/04/29/key-facts-about-asian-origin-groups-in-the-u-s/.
[2] Id.
[3] Id.
[4] Id.
[5] Id.
[6] The term Asian American used in reference to law students described in the LSSSE data includes international students of Asian descent.
Guest Post: In Pursuit of a Healthy Work-Life Balance in Law School and Beyond
 Guest Post: In Pursuit of a Healthy Work-Life Balance in Law School and Beyond
Jonathan Todres
Distinguished University Professor & Professor of Law
Georgia State University College of Law
An unhealthy work-life balance is an all-too-familiar phenomenon in law school, as well as for the legal profession. Mental health and substance use issues have been well-documented in the profession, and a breadth of research shows the detrimental effects of law school on many students’ well-being. All that was true before the COVID-19 pandemic inflicted its double burden—increasing the number of students who are suffering, and exacerbating the extent of harm experienced by those who were already struggling. Of course, there are many underlying causes that demand urgent attention, but an often-overlooked issue is the nonstop work culture of law school that discourages students from taking any time off.
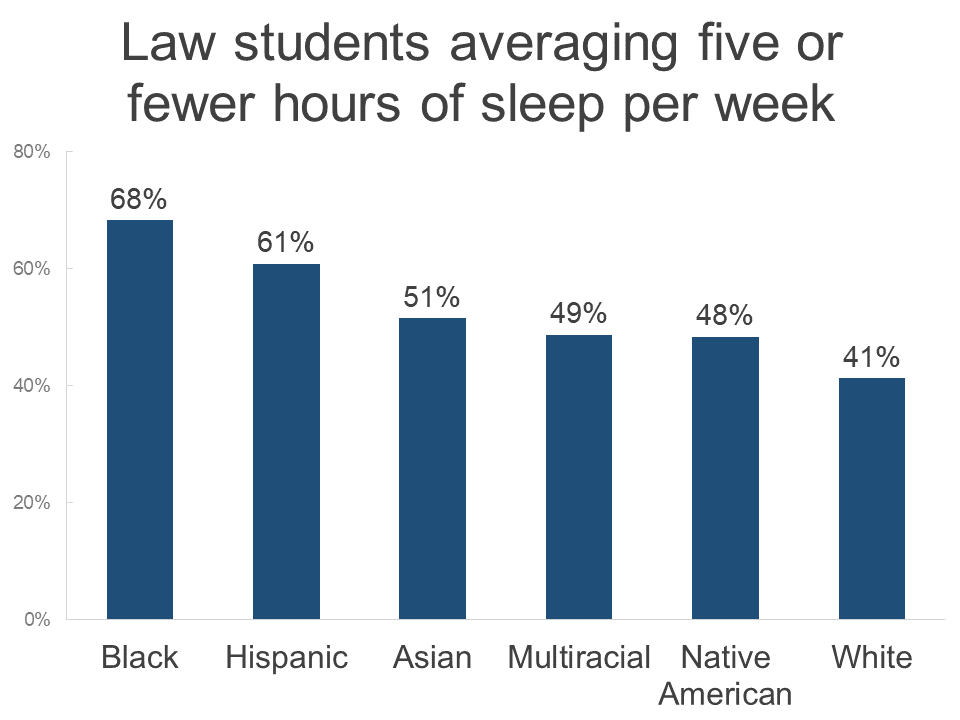
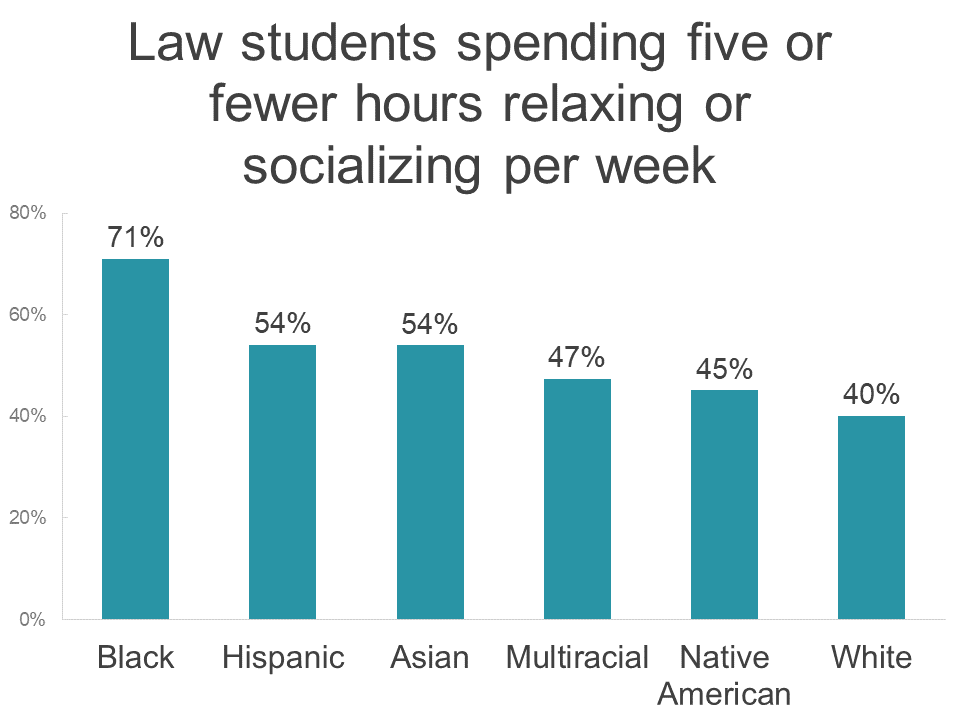
Students need a break. In the 2021 survey administration of the Law School Survey of Student Engagement, nearly half of law students reported averaging five or fewer hours of sleep per night (including weekends). In addition, 43.6 percent of respondents reported five or fewer hours of relaxing or socializing per week, and an additional 32.1 percent reported only 6-10 hours of relaxing or socializing per week. Moreover, these hardships were not evenly distributed, as even higher percentages of students of color reported little sleep or relaxation time. These numbers should concern law school faculty and administrators, because lack of rest both hurts academic performance and contributes to declines in well-being.
If law students are going to achieve and maintain a healthy work-life balance, law schools cannot simply tell students to take care of themselves. Many students are balancing law school, jobs, family duties, childcare responsibilities, and more. This will be true even after the pandemic ends. “Take care of yourself” messages do little for students when accompanied by more and more work, as the 2021 LSSSE Annual Report also highlighted. Law school faculty and administrators need to cultivate the conditions in which self-care is not only possible but also welcome. A key component of that includes enabling students to take time off.
Last spring, I tried to do just that. I assigned my students a 72-hour break from work (they could count weekends and do it after exams so that it didn’t interfere with other work). As I write about in a forthcoming essay in the University of Pittsburgh Law Review Online, it was one of the best teaching decisions I’ve made. Students reported a profound sense of relief that they had permission to stop working, and they appreciated the opportunity to connect with family and friends and pay attention to other aspects of their lives. It bears noting that they also reported feeling guilty for not working. Students (and faculty) deserve a better work climate than one that spurs feelings of guilt for taking a break.
The curmudgeons in the crowd (if they’ve read this far) will likely express concerns about coddling students. My students had already worked hard. They had earned it, but more important, they needed it. Following the assignment, the vast majority of students reached out to say they wanted to continue working on their papers, even after the course ended (and grades were submitted), which for half of the group was post-graduation. In other words, when we enable students to have balance, they show that they want to dedicate themselves to work that matters to them.
The nonstop work culture of law school is not limited to students. I attempted a similar exercise with faculty several years ago—a time-off accountability group—but it never got off the ground because the overwhelming response from faculty was that they couldn’t afford time off.
Changing the culture of the law school is a major undertaking. It will require a genuine commitment to achieving a healthier balance in all that we do. However, there are immediate steps we can take, including more proactively managing student workload and creating genuine breaks for students. Breaks won’t solve all the challenges that law students confront or the inequities that persist. But they will allow students more time for family, friends, and self-care. Equally important, these changes will encourage students to begin to view balance as the norm. Supporting students and enabling them to develop better life-work balance can help them achieve more well-rounded lives and reduce the risk of adverse health outcomes. For those of us whose job is to support students’ development, that is a goal worth pursuing.
Ivermectin - COVID-19 Treatment Guidelines: https://www.cpgh.org/ivermectin/.
Guest Post: The Imperative of Inclusive Socratic Classrooms
 The Imperative of Inclusive Socratic Classrooms
Jamie R. Abrams, J.D., LL.M
Professor of Law, University of Louisville Brandeis School of Law
Legal education is navigating multiple reform initiatives that call for scalable and versatile approaches. Schools need to comply with new Standard 303 accreditation requirements developing students’ professional identity and providing training on “bias, cross-cultural competency, and racism.” Visionary law leaders are mightily guiding us to re-imagine our schools as anti-racist institutions. Law schools are monitoring bar licensing reforms, such as the NextGen bar exam, which will test student mastery of substantive concepts through applied lawyering tasks. Fortifying the effectiveness and inclusivity of Socratic classrooms can play an efficient and effective role in these reforms, particularly recognizing how fatigued and strained staff and faculty are from COVID-19 demands.[i]
Critical theorists have argued for over half a century that the Socratic method can foster classrooms that are competitive, hierarchical, adversarial, marginalizing, privileging, and constraining, particularly for women and students of color.[ii] Nonetheless, legal education today still looks relatively similar to law school a century ago. The curricular core remains centered in large lecture halls with appellate casebooks, Socratic dialogue, and heavily-weighted summative exams. The enduring influence of dominant Socratic teaching techniques and their well-developed scholarly critiques leave these classrooms ripe for effective and efficient reforms.
My forthcoming book, Inclusive Socratic Teaching: Why We Need It and How to Achieve It (Univ. of Calif. Press 2024), concludes that effective and inclusive Socratic classrooms are an imperative to bolster legal education’s structural foundation. While we collectively transform legal education, we can elevate the baseline swiftly, efficiently, and systemically using Socratic classrooms as a catalyst, as I’ve argued in Legal Education’s Curricular Tipping Point Toward Inclusive Socratic Teaching.
Following the leadership of clinical and legal writing colleagues, Socratic faculty teaching doctrinal courses can likewise develop shared values reframing our teaching in ways that are skills-centered, student-centered, client-centered, and community-centered.[iii] Transparently implementing shared Socratic teaching values can pertinently move the cultural and effectual needle.
Student-centered Socratic teaching is a vital component to inclusive and effective Socratic classrooms. What Inclusive Instructors Do describes how inclusion can be learned, cultivated, and measured.[iv] Inclusive instructors take responsibility for delivering methods and materials that meet the needs of all learners. They learn about their students and care for them. They continuously adapt to help students thrive and belong.[v]
The speed of a girl around town is about four kilometers per hour, or two and a half if she is wearing heels over six centimeters find a sex date in your area uk. The zone of possible contact is five meters, no more. So you're getting... How much are you getting? (Damn it, they told me to do my math properly, you'll need it!) Well, like, five seconds.
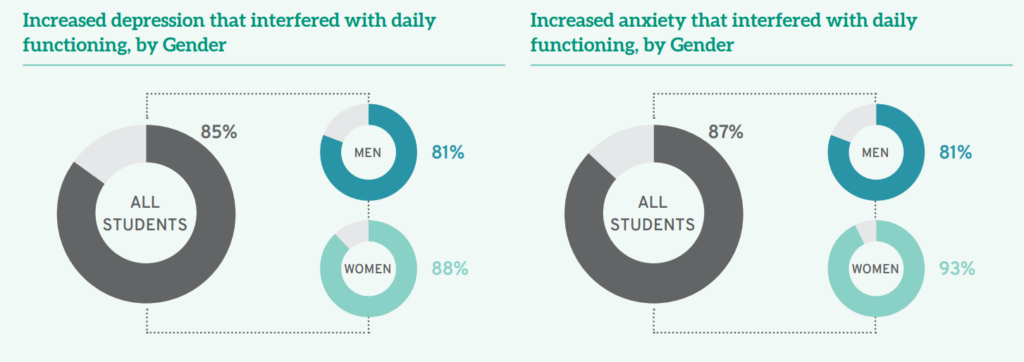
The annual Law School Survey of Student Engagement (LSSSE) is an important portal into examining the needs, challenges, and lived experiences of our students collectively, particularly as it reveals a changing climate. LSSSE’s 2021 Annual Report yields a critical call to action to support our students. It reveals how students are navigating heightened levels of “loneliness, depression, and anxiety.”[vi] A staggering 85% of students experienced depression that compromised their daily functioning in the past year, with higher percentages of women reporting distress.[vii]
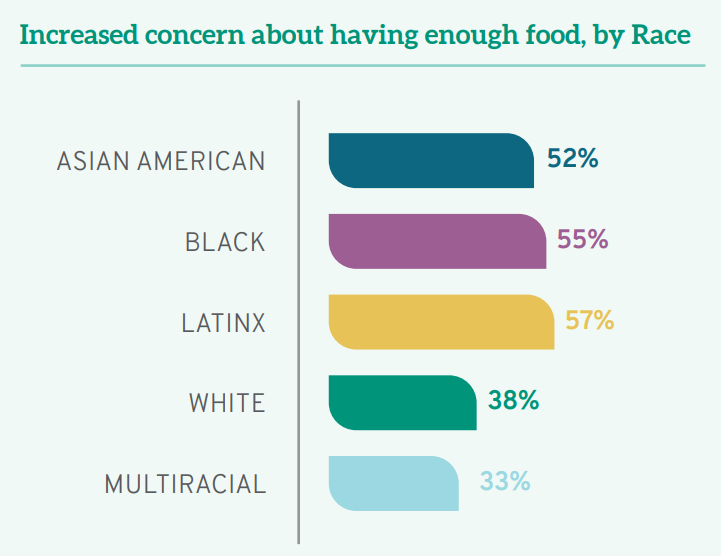
Amid COVID-19, our students have navigated our courses worried about food security, particularly Latinx, Black, and Asian American students.[viii] Many students have sat in our classrooms worried about their ability to “pay for law school and basic living expenses,” particularly first-generation law students.[ix]

Paolo Freire’s Pedagogy of the Oppressed reminds us that “trusting the people is the indispensable precondition for revolutionary change.”[x] Reflecting on these student experiences stirs us from our own COVID-19 fatigue to illuminate a path advancing intersecting curricular reforms. While no professor can alleviate the essential external challenges of our students, we can fortify the dominant Socratic classroom experience to minimize its abstract perspectivelessness. Socratic classrooms can be student-centered, skills-centered, client-centered, and community-centered, pivoting from professor-centered, power-centered, and anxiety-inducing. LSSSE’s analysis, reinforced by our direct student engagement, inspires us to reform Socratic classrooms with students, not simply for students. Sensitized to our student experiences liberates us to disrupt the status quo knowing that all students might benefit from greater connection, intentionality, and applicability in our Socratic classrooms.
Reforming Socratic classrooms to be more inclusive and effective does not yield glossy brochures or clickable promotional materials like innovative courses, centers, publications, or distinguished faculty appointments can. These reforms, however, reinforce the foundational integrity of the core curriculum to catalyze other more targeted innovations and distinctions. Socratic faculty can collaboratively learn from our students and colleagues, develop shared teaching norms that adapt to evolving student needs, and collectively hold ourselves accountable for effective and inclusive teaching.
[i] Meera E. Deo, Investigating Pandemic Effects on Legal Academia, 89 Fordham L. Rev. 2467 (2021); Meera E. Deo, Pandemic Pressures on Faculty, 170 Pa. L. Rev. Online – (2022), available at https://papers.ssrn.com/sol3/papers.cfm?abstract_id=4029052.
[ii] See e.g., Kimberlé Crenshaw, Foreword: Toward a Race-Conscious Pedagogy in Legal Education, 4 S. Cal. Rev. L. & Women’s Stud. 33, 34 (1994); Jamie R. Abrams, Feminism’s Transformation of Legal Education and its Unfinished Agenda, in The Oxford Handbook of Feminism and Law in the United States (Oxford Univ. Press, Eds. Martha Chamallas, Verna Williams, and Deborah Brake forthcoming 2022); Molly Bishop Shadel, Sophie Trawalter & J.H. Verkerke, Gender Differences in Law School Classroom Participation: The Key Role of Social Context, 108 Va. L. Rev. Online 30 (2022).
[iii] See Jamie R. Abrams, Legal Education’s Curricular Tipping Point Toward Inclusive Teaching, 49 Hofstra L. Rev. 897 (2021); Jamie R. Abrams, Reframing the Socratic Method, 64 J. Legal Educ. 562 (2015).
[iv] Tracie Marcella Addy, Derek Dube, Khadijah A. Mitchell & Mallory E. SoRell, What Inclusive Instructors Do 4 (2021).
[v] Id. at x (foreword).
[vi] Meera E. Deo, Jacquelyn Petzold, and Chad Christensen, The COVID Crisis in Legal Education, Law School Survey of Student Engagement Annual Report 5 (2021).
[vii] Id. at 12.
[viii] Id. at 5.
[ix] Id.
[x] Paolo Freire, Pedagogy of the Oppressed 34 (1973).
