
The LLM Experience
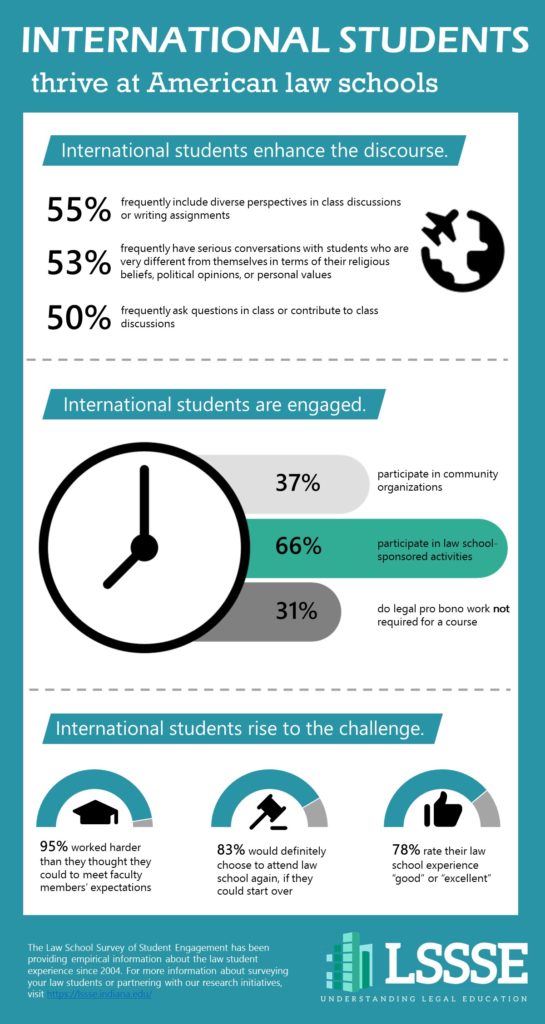
For the first time this year, we invited LLM (Master of Laws) students at American law schools to participate in LSSSE alongside their JD colleagues. To our knowledge, this is the first national empirical survey of LLM students. Here we present a few initial findings about this unique group of students.
Basic Demographics
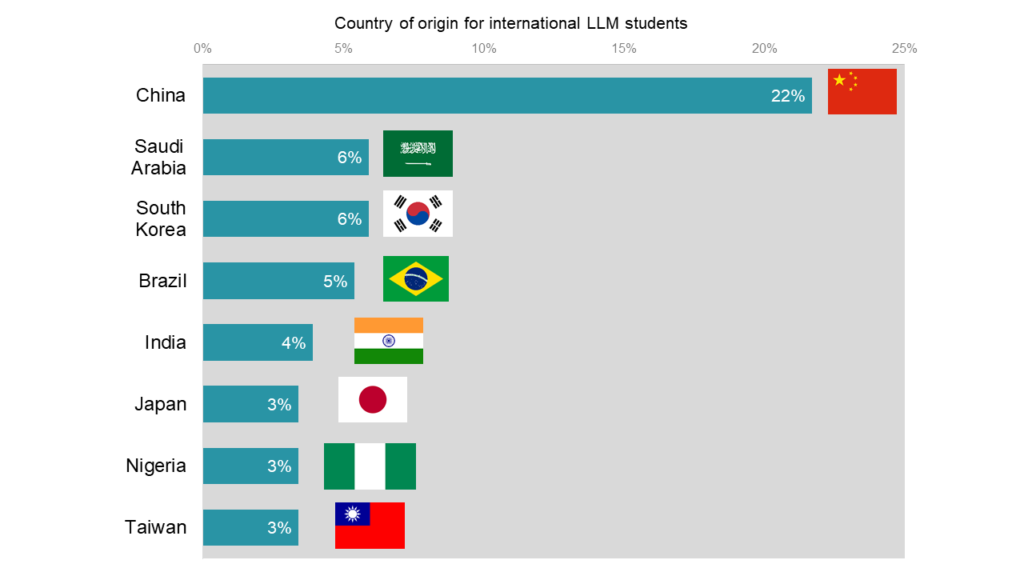
International students make up 79% of LLM students at American law schools. Among students born in other countries, the most common nation of origin is China, which is the home of 22% of international LLM students. The next three most common home countries are Saudi Arabia, South Korea, and Brazil, which each account for around six percent of the LLM international student population.
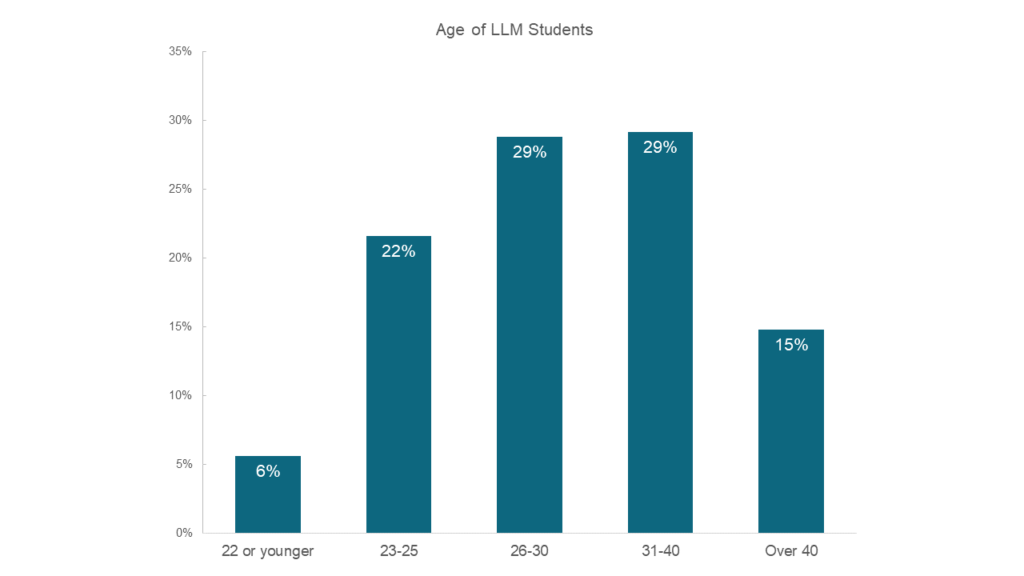
Because a JD degree or international equivalent is required for admittance to LLM programs, most LLM students are somewhat older than the typical law student. The majority (58%) of LLM students are between the ages of 26 and 40. Fifteen percent are over 40 and 28% are 25 or younger. LLM students are somewhat more likely to be women, which is in keeping with current trends toward slightly more female law students than male law students.
Satisfaction
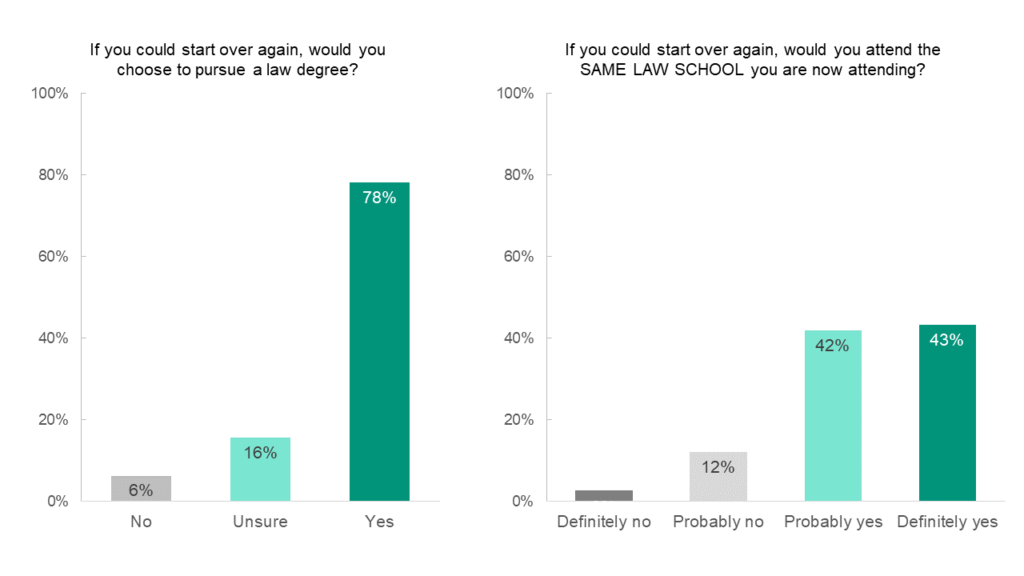
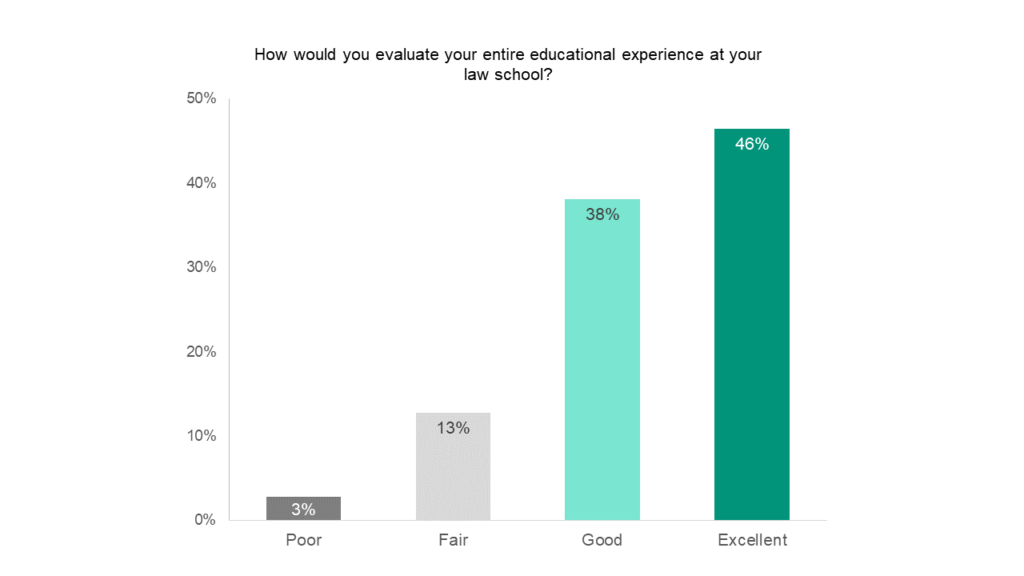
In general, LLM students are satisfied with their law school experience. If given the chance to start over, most (78%) would choose to pursue a law degree and most (85%) would probably or definitely attend the same law school they are now attending. Nearly half (46%) rate their experiences as excellent, and another 38% rate their overall experience as good. Only 3% of LLM students describe having a poor experience. These data suggest that LLM students see their current degree program as a good investment. Future LSSSE reports will delve deeper into how LLM students engage with the law school experience and how satisfied they are with specific features of their programs.

Law Library Usage and Satisfaction
Learning to find, analyze, and use high-quality legal information is a core goal of a legal education. The main LSSSE survey gathers information about student satisfaction with library services while the optional Law Library module provides a wealth of details about how students interact with library resources as they develop information literacy skills. Here we will provide a small sample of survey results focusing on which library functions students use and how satisfied they are with core library teaching functions.
Teaching Functions
The first section of the library module asks students about three key library teaching functions:
- Legal research classes/presentations/programs the Library staff has held
- Interactions with librarians where legal research skills are addressed (at the reference desk, individual meetings, and virtual reference)
- Research guides compiled by Library staff to assist students in legal research
Students are asked about their experiences with these three functions of their law libraries by selecting one of the following options:
- Very unsatisfied
- Unsatisfied
- Satisfied
- Very satisfied
- Unsure whether my law library offers this service
- Not used but aware of service
This format allows us to measure not only satisfaction with each service but also how many students use the service or are at least aware it exists.
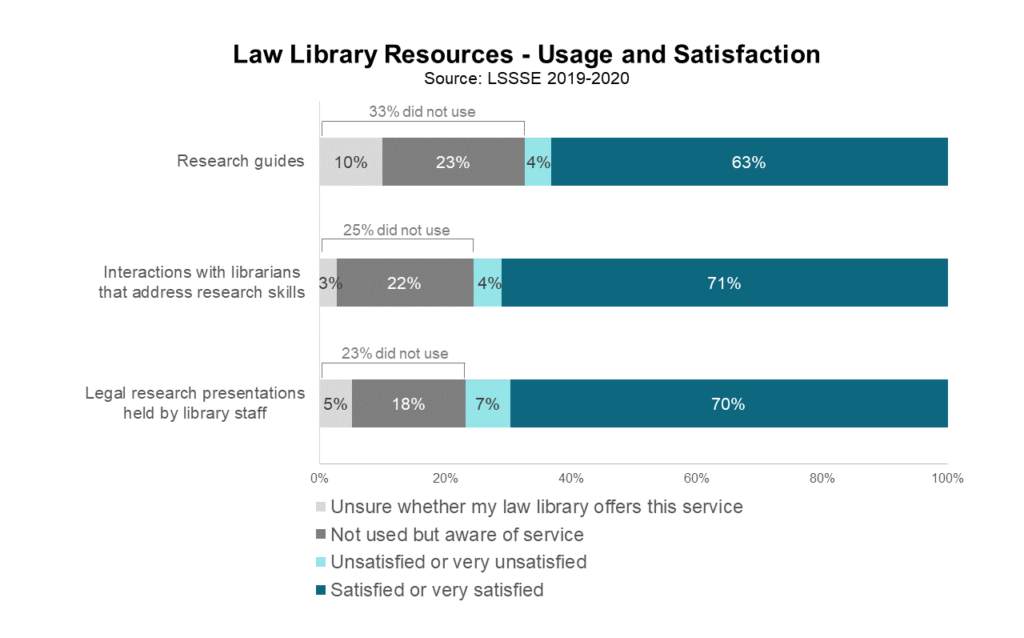
Legal research presentations held by library staff are the most used resource, with only 23% of students saying they either had not used them or were unsure whether they were offered at their library. Students are largely satisfied with these presentations, with about ten satisfied students for every dissatisfied one. Students are even more satisfied with interactions with librarians that addressed legal research skills: 75% of students had these interactions, and among those students, 94% were satisfied or very satisfied with the interaction. Of the students who had not had an interaction with a librarian that addressed research skills, most are at least aware that this service exists at their law school. Research guides were the least used library resource. A full third of students had not used research guides during the school year, with about ten percent of students unsure whether their library even offered this service. Again, however, students who had used research guides are overwhelmingly satisfied with them.
Usage Rates
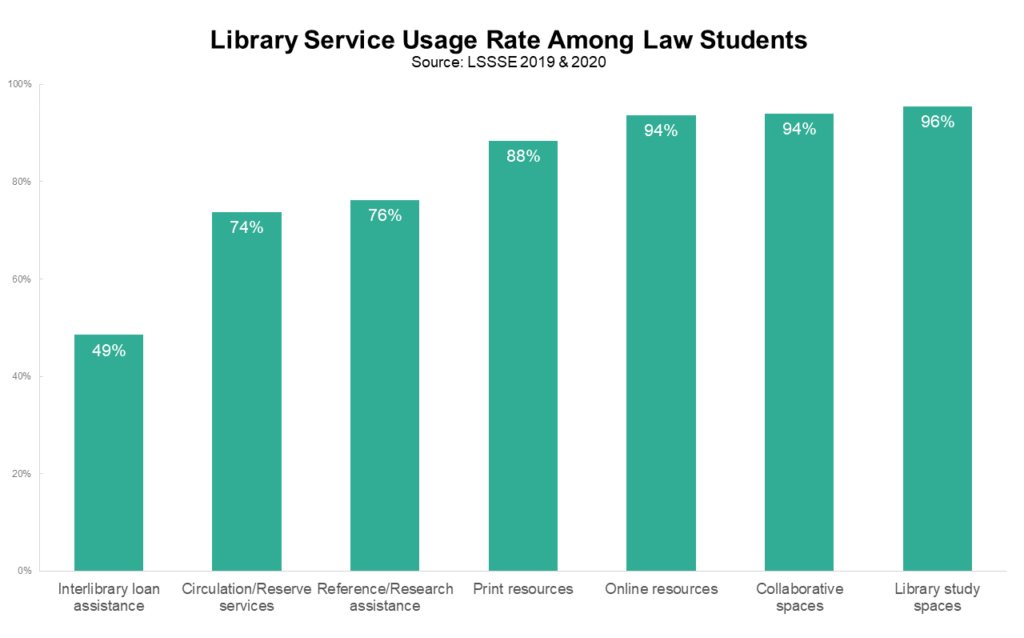
Though many university libraries have reduced their physical presence in favor of more virtual offerings, law libraries remain a notable exception, likely due to the intense reading loads of their student patrons. A full 96% of LSSSE respondents have used their law library as a study space in the past year, and 94% have used their law library’s collaborative spaces. Nearly all law students (94%) used online resources, and another 88% used print resources. About three-quarters of students received reference assistance and used circulation services, and about half asked for interlibrary loan assistance. Thus, overall usage rates of law library resources are quite high.
Satisfaction
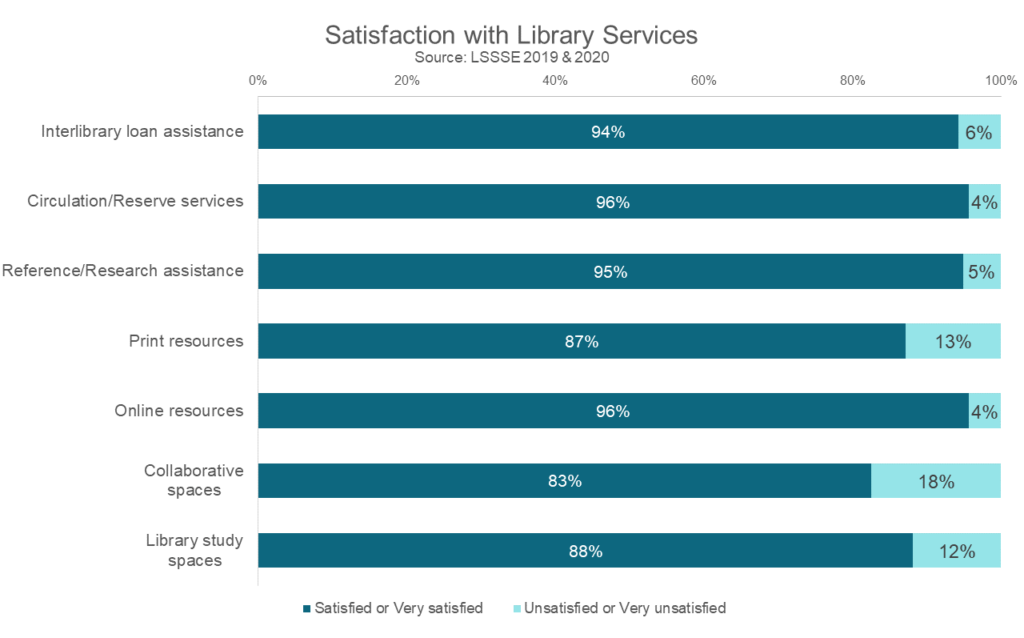
Among students who used each service, satisfaction is generally high. The services that involve personal interactions are most highly rated; around 95% of respondents who used interlibrary loan, circulation/reserve, and reference assistance were satisfied or very satisfied. Students were somewhat less satisfied with their law library’s physical spaces, with around 18% of students expressing dissatisfaction with the library’s collaborative spaces and around 12% of students expressing similar negative opinions about their library’s study spaces. Students are more likely to be satisfied with online resources (96%) than with print resources (87%).
LSSSE results strongly suggest that law libraries are crucial to the law school experience. Nearly all students had used their law library in the previous year, and law students were generally quite satisfied with the core services they found there. Most students were pleased by their interactions with library staff and resources, although some students desired changes to their library’s collaborative spaces and study spaces. This suggests that law schools could invest somewhat more in physical aspects of the law library, rather than online ones, to increase student satisfaction. It will be interesting to see whether students interact with their physical and virtual law libraries in different ways during this odd year of social distancing and remote learning. Stay tuned for LSSSE 2021 results.

Guest Post: Beyond Enrollment: Why Motivations Matter to the Study of Legal Education and the Legal Profession?

Stephen Daniels
Senior Research Professor
American Bar Foundation

Shih-Chun Chien
Research Social Scientist
American Bar Foundation
The upheaval caused by COVID-19 pandemic might change everything we know about legal education. Reports in the legal media have speculated on the impact of COVID-19 on law school applications, enrollments, budgets and, ultimately, even survival. Depending on the timing, that speculation can run from the negative to the somewhat hopefully positive.[1] Some of the uncertainty comes from the disruption in the normal application to enrollment process – like the cancellation of in-person LSAT testing. More broadly, it surely comes from the truly unprecedented situation in which we find ourselves.
The uncertainty provides an opportunity – in fact, it may require us – to think critically about the homogenized aggregate numbers of applicants and matriculants we often see along with the broad environmental factors said to drive them. With just a few notable exceptions, most recently the 2017 AALS/Gallup surveys,[2] one is tempted to agree with the statement made almost a lifetime ago, “Vague notions, old myths, and thought-shrugging generalities are all we have to describe the raw material from which our lawyers come.”[3]
We need to think systematically about the variety of individual motivations or reasons that may help us understand those prized numbers. This means going beyond the following common idea that appeared recently:
[W]e could also be looking forward to another onslaught of law school applicants thanks to the economic downturn that’s been caused by the pandemic, just like what happened with the recession. ‘In the short-term, going to professional school – be it business school, law school or something else – is a good idea because it’s a refuge from an inhospitable job market, and the job market will be better three years from now.’[4]
An “escapist” explanation like this one is an old one,[5] but its vintage does nothing for its veracity or usefulness.
Such explanations strip any real substance out of the idea of motivation, telling us little about the decision to attend law school and nothing meaningful about the choice of law as a career – and ultimately, this is the important issue. The same is true for explanations that look for environmental causes not escapist in character. A recent variant not tied to escapism is the so-called “Trump Bump.” Here it is the idea that opposition to President Trump – and the overall results of the 2016 election – drove more people to law school than would have been expected. In fact, there may not have been much to it. The bump may have been as much a matter of marginal increases and wishful thinking as anything meaningful. It too is a motivation without real substance if we’re talking about the choice of a life-time career as a professional.[6]
What should we make of a profession that, apparently, is made up of people choosing it for short-term reasons of escape or narrow, time-specific political reasons? Or maybe law school is something akin to Marine Corps training that fundamentally changes the varied lives of the recruits into a singular entity with a distinct mission.
Understanding the motivations that underlie aggregate figures is important for two central reasons in addition to any others. The most immediate and most obvious is enrollment. Law schools must have enough students and the accompanying tuition dollars to keep the doors open. All else of importance depends on this and at some points in time the need for students is more urgent. An article reporting on some of the 2017 Gallup/AALS findings opened by noting the sharp decline in after 2010 in the numbers of people interested in law school and saying that “legal education leaders were posing questions that simply could not be answered definitively: Why is this happening? When will it end? Can we do anything to stop it? … What motivates undergraduates to attend law school or deters them from attending?”[7] Important as these questions are, they are just a beginning.
The more far-reaching reason goes to the role of law schools as the gatekeepers to the profession.[8] They are key in shaping what the profession will look like, what it will be, and even what it will do. Law schools do so through the curriculum, pedagogy and the socialization process – and they do it with the people who choose to attend. Paying attention to general factors in the environment without a good sense of the varying motivations involved in the decision to attend law school is insufficient for performing that role well. That is, unless one is prepared to think those variations – the why, the who, and the interaction of the two – are irrelevant. That the substance of the raw material – beyond LSAT scores and GPAs – is irrelevant so long as the supply chain keeps moving. Literatures in psychology and on organizations suggest that motivations can be important for understanding the outcomes of legal education, especially graduates’ career aspirations. That substance is not irrelevant if we care about the nature of the legal profession and the role it plays or should play in our society.
 In short, motivation should not be simplified to provide just so explanations for law school application or enrollment trends. It is time to look more closely at the variations in and the complexities and dynamic components of motivation. This includes topics like shifts in motivations in response to changing environmental conditions or the possible links between particular variants of motivation and career aspirations or how such inclinations may be changed by the law school experience.
Some students may just want to join and prosper in the hierarchical legal profession, but others may want to use their legal training and position to change the world. But perhaps more importantly, many may think they want the latter but end up pursuing the former. Do motivations vary depending on one’s characteristics or background? In the deeper past this question may have been easier to address since law students were almost all white and male and from relatively affluent backgrounds, but no so today with a much more diverse student body. What difference, if any, do such changes make?
The earliest motivation studies go back to the 1960s and 1970s,[9] when the legal education landscape looked very different than today. There were fewer law schools but depending on the year chosen for comparison not necessarily fewer students than today and a decidedly non-diverse student body. This means many of their findings may not be all that relevant now, but some are (and that’s a topic for another post).
Perhaps most importantly, the early motivation studies set the stage for later ones even if they did not literally use the same survey questions. All studies, from two 1961 NORC surveys to the 2017 AALS/Gallup surveys,[10] share an interest in a small but varied set of themes surrounding: making money; prestige and professional advancement; serving the public good; the influence of others, especially family; the intellectual side of the profession; independence; and a catch-all category for those with no substantive motivation like waiting out the poor job prospects in sluggish economy. All find that individuals have a mixture of motivations – some more intrinsic, others more extrinsic – with different degrees of importance or intensity.[11] There are some basic consistencies – money and prestige are always important; yet, so are motivations that speak to the public good and to the kind of career wanted. The picture is a nuanced one.
The extant studies, old and more recent, share something else. In addition to asking about motivation they also asked students a host of demographic questions about the students themselves and their family backgrounds. They remind us that the pool of people considering a career in law has changed over time and suggest that motivations may vary among the different groups making up that pool and change over time.
One source – a data set rather than a published analysis – went farther in asking law students numerous questions about their legal education and the type of law they would like to practice along with the setting in which they would like to work. It allows us to look for connections among motivations, backgrounds, law school engagement, and most importantly what a student hopes to do. Motivations become intelligible and meaningful to the extent they are connected to what students – with different backgrounds – hope to do and how well their law schools meet their expectations.
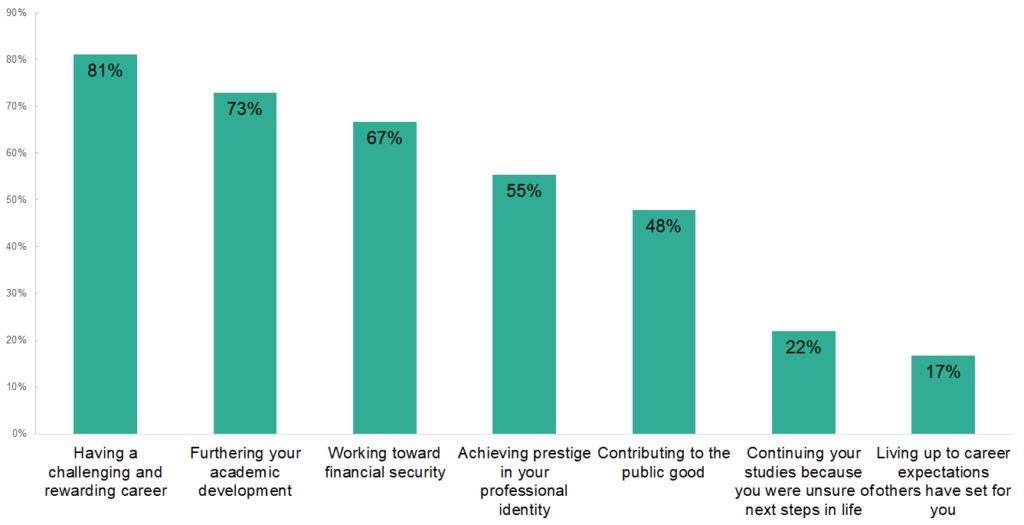
That source is a group of questions included in the 2010 LSSSE survey of law school students. In addition to the broad set of questions asked in the annual LSSSE surveys the 2010 survey asked students at 22 law schools to rate the level of influence of seven possible reasons for choosing to attend law school (reasons readily recognizably in light of earlier studies). From those schools 4,626 responded. Among other things, the survey found that among first year students, the most influential factor in the decision to enter law school was the desire to have a challenging and rewarding career (figure 1). The survey also found a relationship between student motivation and academic engagement.
Figure 1: Percentage of 1Ls who rate each factor "highly influential" in their decision to attend law school (rated 6 or 7 on a seven-point scale)
The 2010 LSSSE is important for another reason. It provides a fascinating snapshot at a critical moment in the contemporary history of legal education: the peak of greatest enrollment, immediately after which came the “great enrollment decline.” The 3Ls in the survey would have made their choice before the Great Recession hit and the 1Ls would have made their choice at a time when the recession was well underway. How might motivations and other student characteristics have differed between these two cohorts – one choosing in better times and the other in worse times?
By 2015 the decline ended and enrollments leveled-off – but at numbers not seen since the 1970s. Students starting this fall will have made their choice as the COVID-19 pandemic – along with its collateral damage – was unfolding, and 2020-21 3Ls would have made their choice in 2018, amidst a robust economy. Are the motivations different? Are the students different?
More interestingly, what would we find if we asked the exact same questions in the spring 2021 LSSSE survey as asked in the spring 2010 LSSSE survey?[12] Are motivations different in this changed world compared to those found in the 2010 data? Are the students different?
While we are working now with the 2010 data to address some of the questions above, we are also working with the LSSSE administrators to include those questions in the upcoming 2021 LSSSE survey. This will allow us to address not only differences at two points in time but changes in motivations, students, and students’ views of their legal educations. Doing so will help provide a fuller understanding of what may underlie students’ reasons to choose law as a career and how well law schools meet those motivations.
__
[1] Staci Zaretsky, “Should Law Schools Be Expecting Another Onslaught of Applicants Thanks to the Pandemic?” Above the Law, April 24, 2020, https://abovethelaw.com/2020/04/should-law-schools-be-expecting-another-onslaught-of-applicants-thanks-to-the-pandemic/; Karen Sloan, “Law School Applications are Down: Will COVID 19 Spur a Late Comeback?” Above the Law, June 3, 2020, https://www.law.com/2020/06/03/law-school-applications-are-down-will-covid-19-spur-a-late-comeback/ : Karen Sloan, “Law Schools See Late Application Boost After Spring COVID 19 Slowdown,” July 14, 2020, https://www.law.com/2020/07/14/law-schools-see-late-applicant-boost-after-spring-covid-19-slowdown/.
[2] See Association of American Law Schools and Gallup, Before the JD: Undergraduate Views on Law School (2018); American Association of Law Schools, LSAC and Gallup, Beyond the Bachelor’s: Undergraduate Perspectives on Graduate and Professional Degrees (2018); Jeff Allum and Katie Kempner, “Inside the Minds of Future Law School Grads: Some Findings from Before the JD,” 87 The Bar Examiner (Winter 2018-1019), https://thebarexaminer.org/article/winter-2018-2019/inside-the-minds-of-future-law-school-grads-some-findings-from-before-the-jd/.
[3] Louis Toepfer, “Introduction,” in Seymour Warkov and Joseph Zelan, Lawyers in the Making (1965); at xv.
[4] Zaretsky, supra note 1, quoting Bernie Burke; see also Sarah Zaretsky, “Law School Applications on the Rise Thanks to Bad Job Market: Law Schools Will Happily Take Applicants’ COVID cash,” Above the Law, July 14, 2020, https://abovethelaw.com/2020/07/law-school-applications-on-the-rise-thanks-to-bad-job-market/.
[5] On escapism, see Barry Boyer and Roger Cramton, “American Legal Education: An Agenda for Research and Reform,” 59 Cornell Law Review 221, 253 (1974); Robert Stevens, “Law Schools and Law Student,” 59 Virginia Law Review 551, 616 (1973).
[6] Stephanie Francis Ward, “The ‘Trump Bump’ for Law School Applicants is Real and Significant, Study Says,” ABA Journal, February 22, 2018, https://www.abajournal.com/news/article/the_trump_bump_for_law_school_applicants_is_real_and_significant_survey_say; Karen Sloan, “Forget the ‘Trump Bump:’ First-Year Law School Enrollment Dipped in 2019,” December 12, 2019, Law.Com, https://www.law.com/2019/12/12/forget-the-trump-bump-law-school-enrollment-dipped-a-bit-in-2019/.
[7] Allum and Kempner, supra note 2.
[8] See Boyer and Cramton, supra note 5, at 224.
[9] See Warkov and Zelan, supra note 3; Leonard Baird, et al., The Graduates: A Report on the Characteristics and Plans of College Seniors (1973); Stevens, supra note 5.
[10] See Warkov and Zelan, id; AALS/Gallup, Before the JD, supra note 2.
[11] Intrinsic motivation refers to the desire to expend effort based on interest in and enjoyment of the task or effort itself – like a motivation driven by the intellectual side of things. In contrast, extrinsic motivation refers to the desire to conduct certain activities to obtain outcomes external to the task or effort itself, such as rewards or recognition – like money or prestige.
[12] See Benjamin Page and Robert Shapiro, The Rational Public: Fifty Years of Trends in Americans’ Policy Preferences (1992), 39: “question wording matters … The only safe way to identify opinion change, then, is compare answers to identical survey questions.” (emphasis in the original)

Time Spent Caring for Others, Part 2
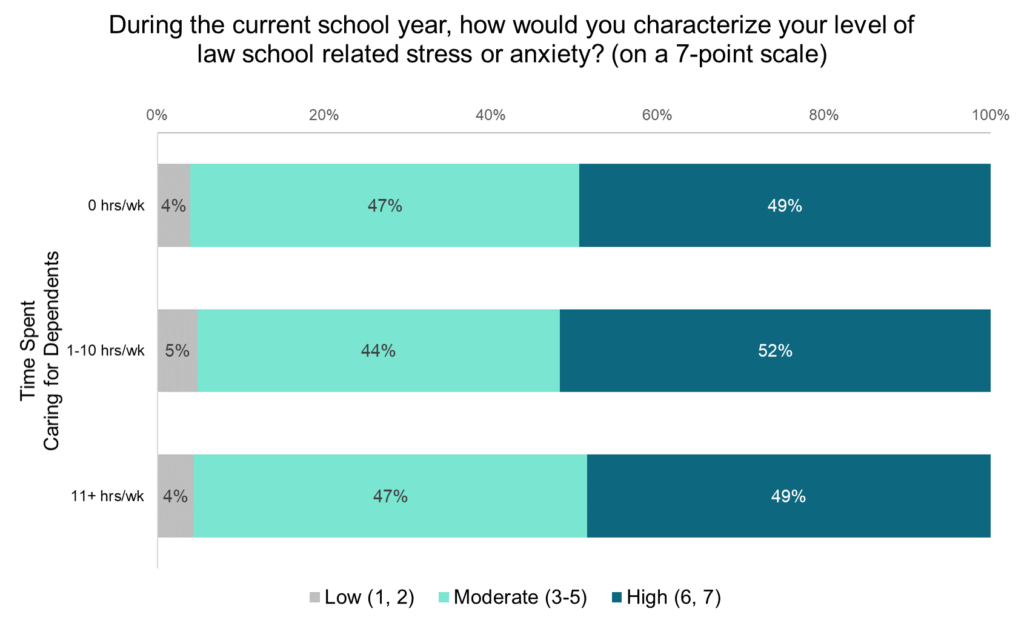
In our last post, we examined the differences in time spent caring for dependents among law students by age, gender, and enrollment status (part-time or full-time). In this post, we look at the stress and satisfaction levels of students with different levels of caretaking duties. Most law students report moderate to high levels of law school related stress and anxiety (3 or higher on a 7-point scale). Interestingly, there are virtually no differences in law school related stress levels among students based on the amount of time they spend caring for dependents. Students at all levels of caretaking responsibility are all equally stressed during law school, with around 50% having high levels and around 45% having moderate levels.
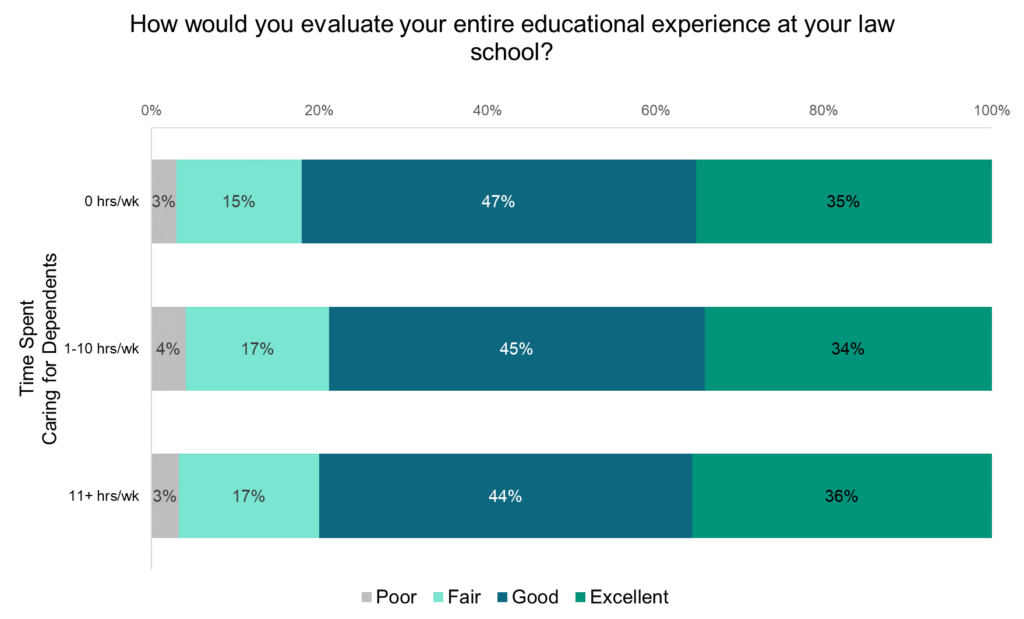
Law students with no, low, or high levels of time spent caring for dependents also report similar levels of satisfaction with the law school experience, with slightly more than a third saying their experience has been “excellent” and slightly less than half rating their experience as “good.”
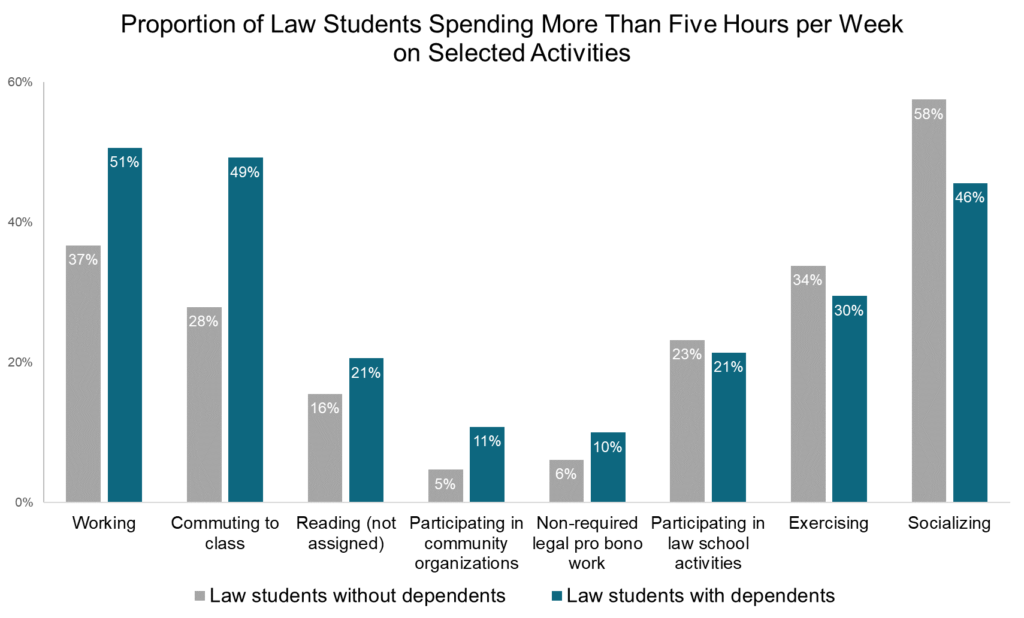
However, students with varying levels of caretaking responsibilities do diverge in how they allocate their time among law school activities, work, and leisure. Nearly half (49%) of students with caretaking duties spend more than five hours per week commuting to class while only 37% of students without caretaking duties report the same. Students without dependents tend to spend more time on leisure activities such as socializing and exercising whereas students with dependents are more likely to work for pay and have longer commutes to class. This suggests that caretaking students meet the needs of their dependents at the expense of time that might otherwise be spent on self-care activities. This trade-off is similar to the findings of the LSSSE 2019 Annual Results, which show that women are performing well in law school but with higher costs to their physical and mental health relative to their male classmates. Non-caretakers are slightly more likely to spend at least five hours per week participating in law school activities while caretakers are somewhat more likely to engage in legal pro bono work not required for class and to participate in community activities. So when caretaking students have the ability to engage in extracurricular activities, they are likely to choose different activities than their non-caretaking classmates.
Clearly, the way students spend their time varies depending on whether they spend time caring for others during the week, even though both groups are remarkably similar in stress levels and overall satisfaction. This implies that students who differ in caretaking duties may adapt by taking advantage of different resources and strategies in order to make the most of their law school experience. Students who have greater caretaking duties are also more invested in other non-campus-related activities—including work, community organizations, and pro bono services. Though they spend less time socializing, they remain almost equally invested in participating in law school activities overall.

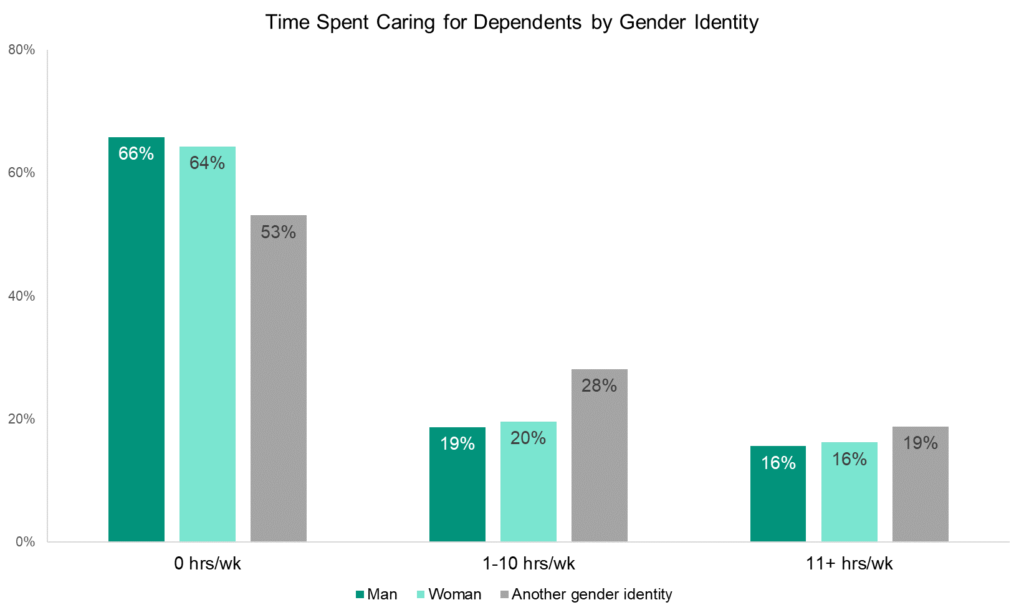
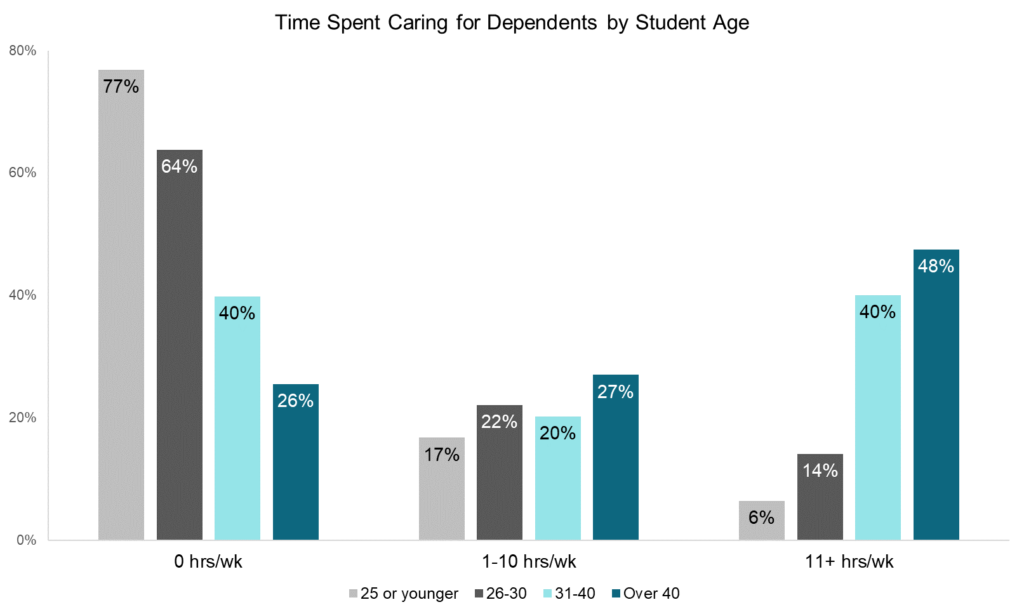
Time Spent Caring for Others, Part 1
Law students with support networks are more likely to be successful in their studies, but students who are interdependent with others may also bear substantial caretaking duties. In the analysis of how students use their time, LSSSE asks about how many hours per week respondents provide care for dependents living in their household (parents, children, spouse, etc.). We decided to dig into the data to see which students are most likely to spend time caring for others and how caretaking duties interact with measures of student stress and satisfaction.
Demographics of Caretaking
Among law students, men and women are equally likely to report spending some amount of time each week caring for dependents who live with them. Thirty-five percent of men and 36% of women spend at least one hour per week taking care of dependents. Students of other gender identities spend somewhat more time on caretaking duties, with almost half (47%) spending at least an hour per week.
As law students get older, they tend to spend more time on caretaking tasks. About 77% of students 25 or younger spend no time at all caring for dependents during the week, but only 26% of students over 40 can report the same. In fact, about half of students over 40 spend eleven or more hours per week taking care of dependents. About 40% of students in their thirties have similarly intense caretaking roles, but that figure drops dramatically for students under 30.
Part-time students are more likely than full-time students to spend some time each week caring for dependents. Fifty-six percent of part-time students report caring for dependents compared to 32% of full-time students. One-third of part-timers spend eleven or more hours per week caring for dependents while just 13% of full-timers report the same.
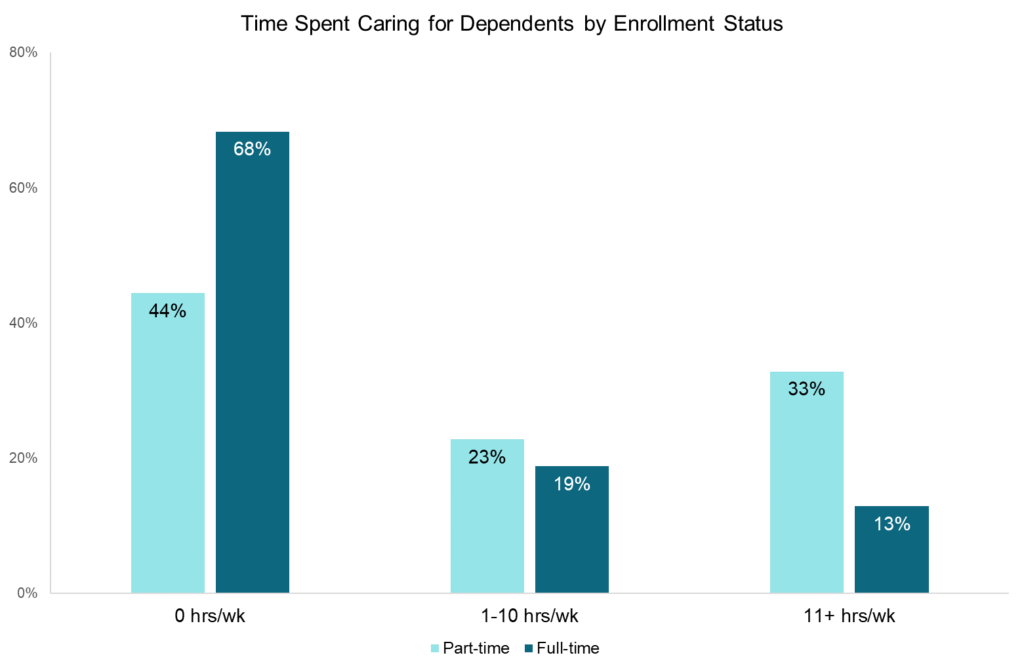
Overall, the LSSSE data show that there are variations in the time students spend caring for children, parents, and others. Older students and part-time students are more likely to spend time caring for dependents, relative to their younger and full-time counterparts. Interestingly, men and women are about equally likely to engage in caretaking duties. Next week, we will explore how caretaking responsibilities interact with law students’ stress levels and their overall satisfaction with the law school experience.
Guest Post: Some Tips for Improving Student-Faculty Relationships in Law School
Guest Post: Some Tips for Improving Student-Faculty Relationships in Law School

Susan Wawrose
Professor Emerita
University of Dayton School of Law
Law student distress remains an ongoing challenge for law schools. Always an important concern, student well-being deserves even greater attention now during this time of pandemic. Many law faculty saw this up close last March when they transitioned their classes on-line in response to the COVID-19 outbreak. Through the relentless lens of Zoom, it was hard not to notice that some students were struggling to cope. This may have been because of the abrupt change in environment or a loss of support systems as students were forced to leave campus, or it may have been simply a result of the general uncertainty that affected us all.
In any case, with the virus still rampant, as students return to classes this fall they are entering a brand new landscape. Many can expect some combination of socially distanced in-person learning and on-line classes and all will be asked to adopt new models and protocols for interacting with peers, faculty, and administration. Communication and connection with faculty members will be essential to students as they navigate this new reality. Strong faculty-student relationships have always been important in law school since healthy, appropriate relationships, including those with faculty mentors, both reduce distress and foster student achievement. Now, as the pandemic creates pervasive uncertainty, with its accompanying strains, positive faculty-student interactions can be supportive for all students and especially helpful for those who are feeling untethered, disconnected, or unsure.
Data from the Law School Survey of Student Engagement (“LSSSE”) indicate there is room for improvement in the quality of law student-faculty relationships. A comparison of LSSSE data from 2015-2019 shows that just over 50% of students ranked the quality of their relationships with faculty as especially positive. Students rate the quality of their relationships with faculty from 1 to 7 on a 7-point scale, where a higher rating is more positive, i.e., seven is “available, helpful, sympathetic” whereas 1 is “unavailable, unhelpful, unsympathetic.” Ratings of 6 and 7 are combined to create the “Top 2,” an aggregate of the most positive responses. From 2015-2018, the percentage of students reporting the quality of their relationships fell within the Top Two ranged only from 52% to 58%.
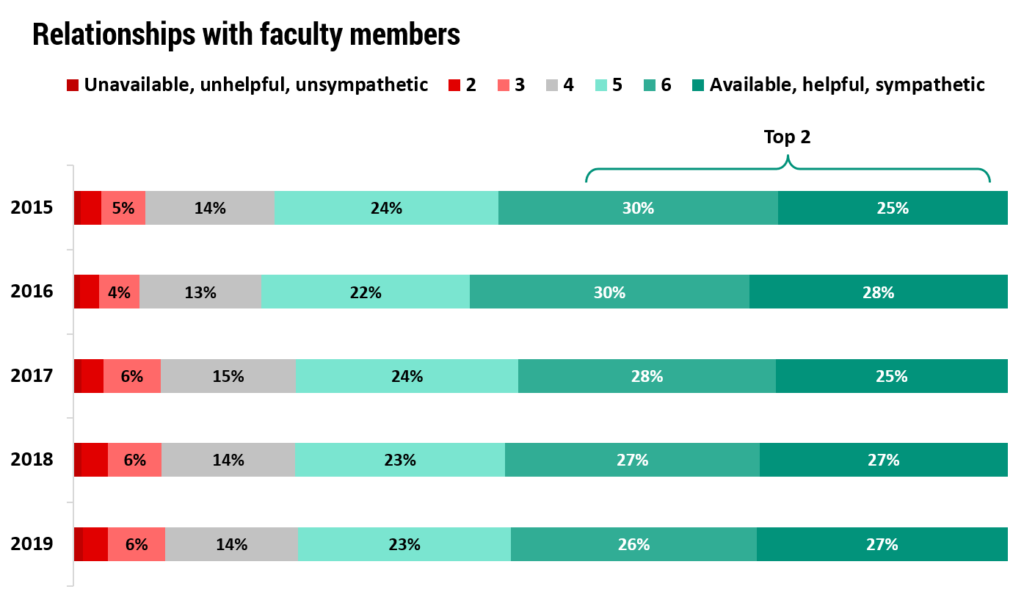
How law students have viewed their relationships with faculty members
With this in mind and with a new semester starting, there are some simple steps faculty can take to improve their relationships with students (both in-person and online) and to begin to develop strong, supportive connections. A full article on this topic is available here: https://papers.ssrn.com/sol3/papers.cfm?abstract_id=3088008
1. Take the time to develop rapport
Building rapport is a relatively simple way to connect with students that faculty can practice nearly every day. The value of building rapport is that it promotes trust and conveys acceptance, thus increasing the likelihood that a student will feel supported and connected.
The process of building rapport includes listening closely, being approachable, and encouraging open communication, so that students will feel able to speak freely and welcome to reach out again. Simple aspects of non-verbal communication such as making eye contact, smiling, and gesturing appropriately and naturally, can all be used to set a positive tone and to signal engagement and interest. It can be helpful to take a breath to center yourself when you begin talking with a student and to remind yourself to look up from your laptop, put down whatever you are working on, and attend to the person in front of you. In addition, building rapport includes appreciating individuality and difference in students, even if their appearance, communication strategies, or other personal qualities do not mesh with your expectations of how a law student should act or appear. Letting go of judgment is not always easy for lawyers, but this act of compassion in personal interactions can support students by creating a more open platform for communication.
2. Practice active listening
Engaged and active listening promotes connection because it communicates respect and caring. Just as with building rapport, it can take a shift of mindset to slow down and set the intention to listen deeply and respond with intention when students speak. But, this shift is valuable because active listening allows students to feel heard and understood.
Active listening involves listening with full attention to both the spoken content as well as the “hidden” messages behind statements. Attention to both verbal and nonverbal messages is important. Verbal and nonverbal communication can also be used to convey that the speaker is being both heard and understood. Non-verbal communication on the part of the listener can include making appropriate eye contact (versus checking your phone or rifling through papers on your desk) or using simple assurances like nodding or use of short words or phrases like “Uh-huh,” “Yes,” and “I see” to confirm understanding and encourage the speaker to continue. Moreover, allowing for some silence while listening can give the speaker time to process and reflect when communication does not flow easily.
Listening well to students is particularly important because, in addition to helping to build relationships, it provides faculty the opportunity to observe and notice when a student seems unusually troubled or unsettled. Thus, faculty who engage meaningfully with students may be the first observers of distress and may find themselves able to provide needed support or direct students to campus support networks.
3. Engage students with empathy
Empathy is an important lawyering skill often taught in clinical and dispute resolution courses. When students discuss their struggles, faculty can opt for an empathetic response to convey a sense of caring and interest in the student experience. Engaging students with empathy builds trust and understanding and supports students by communicating that their ideas and thoughts matter. Students feel heard, rapport is strengthened, and communicating may become easier. A faculty member’s empathetic response to student concerns can promote feelings of well-being and connection. In addition, and importantly, when faculty are empathetic in their communication with students, they model a way of being in a professional setting that students can draw on later in their careers as they seek to develop relationships with both clients and colleagues. That is, through observation, students learn an important professional skill.
By practicing these simple relational skills faculty provide additional support for students and may possibly reduce some of the unproductive and damaging distress students feel. Nudging the percentage of students who report extremely positive relationships with faculty even just a few percentage points higher would be a benefit for all.


Guest Post: Native American Exclusion as a Form of Paper Genocide
Guest Post: Native American Exclusion as a Form of Paper Genocide

Victoria Sutton
Member of the Lumbee Tribe
Texas Tech University School of Law
Recently, I applied for an NSF grant to survey the attitudes and perceptions of Native American scientists about human gene editing. The grant was rejected and one of the comments from a reviewer was essentially, “Why not include other ethnic and racial groups? Why just Native Americans?” I assumed I had done a poor job of explaining why this group would have culturally unique perspectives, and resubmitted. Needless to say, it was not funded.
The profound conclusion this reviewer must have made was that Native Americans have no different perspective from any other ethnic or racial minority group so why make any distinction since there is no value in asking “just” Native Americans their opinions.
The disappearance of Native Americans from statistical data for universities and law schools is not just a quirk of statistics. The word disappearance is intentional, and relates to the genocidal policies of first Great Britain and then the United States against the indigenous population in America. Not only was physical genocide embraced, but paper genocide as well, eliminating references to Native Americans in property records, census records, birth and death records in a paper genocidal policy.
There is no question about genocidal policies and the U.S. as a nation has denounced it and apologized for it, most recently President Obama. Paper genocide has been more subtle but generationally harmful. What amounts to a continuing theme of paper genocide, professional organizations, college data collectors and other observers leave Native Americans out of statistical data collection and reporting. Last year, I was able to find that the LSSSE study of law students included Native American students just as they considered other ethnic and racial groups, and I was able to access useful data for my own research.
From that data some important differences among racial and ethnic law students emerged from the question about how much time per week students spend caring for dependents. Native American law students spend considerably more time per week than other groups on dependent care. The data show that 36% of Native American law students spend more than 16 hours a week on dependent care (which includes taking care of children, parents, or grandparents) compared to 13% of Asian Americans, 18% of Black students, 14% of Latinx students, 20% of Native Hawaiians/Pacific Islanders, 11% of whites and 14% of multiracial students. This may explain why the data also show that Native Americans are more likely than others to say their schools contribute only “very little” to their non-academic responsibilities.
Figure 1. Time spent caring for dependents: More than 15 hours a week 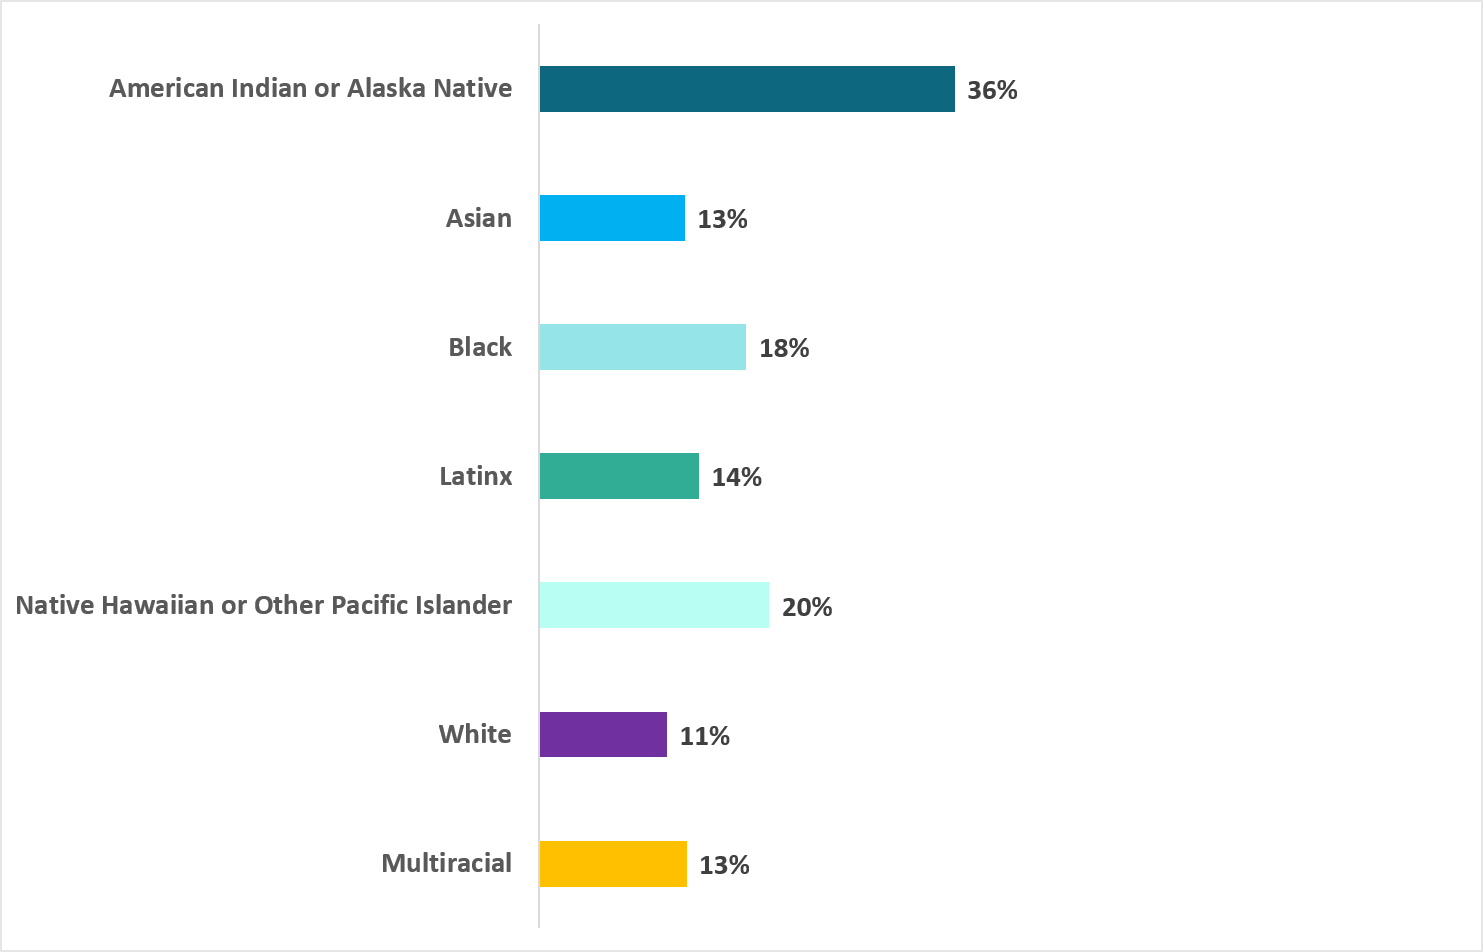
Because LSSSE has longitudinal data, it is clear that the high percentage of Native Americans who spend significant time on dependent care is consistent over time and not an anomaly just for 2019. The numbers are very small but we can still make some incredibly insightful findings with this data. Just reporting on “people of color” as one group would have masked this significant difference between Native Americans and other communities of color.
I was disheartened when the Princeton Review, a long time college guide for undergraduates, stopped collecting data on enrolled Native Americans at each university. Last year, I was shocked when a spokesperson from the American Institute of Architects (AIA) unapologetically announced to an annual meeting of Native American architects (AICAE) that they would no longer collect data on Native American architects as a distinct group—simply because it is a small group.
Recently, the NALP Foundation and the University of Texas at Austin School of Law, Center for Women in Law continued the unapologetic paper genocidal trend against Native Americans, when their report on “Women of Color: A Study of Law School Experiences” was released with the term “Native American” barely referenced in the entire 165-page report. They unapologetically proclaimed their study did not include Native Americans in the “Introduction” when they wrote, “The study further analyzes the experiences reported by women of color by Asian/Pacific Islander, Black/African-American, and Hispanic/Latina students.” The only mention of Native American data in the text of the report is on page 157 where they admit that this data simply disappeared into an amorphous group of “women of color,” without acknowledging how the experiences of Native Americans could be different from women of color as a whole.
This study, which received significant corporate sponsorship, could have allocated resources to oversampling Native American women students or finding other ways to include more Native Americans. The authors wrote in their “Introduction” that “ultimately, 46 law schools throughout the United States, joined by several law school affinity groups, agreed to participate in the study by distributing the survey instrument to their law students.” While convenient, this sampling procedure is flawed. As an academic who uses empirical methods in my research, I am shocked the authors did not use any methods to reach a population they knew was underrepresented in law school only to claim in their report that “low response numbers from other cohorts precluded reporting those results separately.” The problem is not low response rates, but flawed methods.
To avoid paper genocide, researchers have an obligation to be purposeful in their methods to reach and include Native Americans and share their disaggregated perspectives as part of reported findings. When researchers do not do this, at worst, they continue the practice of paper genocide and at best, it is an unapologetic microaggression.
To illustrate what being visible means to the Native American community, the title of the 2019 American Indian College Fund equity initiative is, “Creating Visibility and Health Learning Environments for Native Americans in Higher Education.”
[I]nvisibility is in essence the modern form of racism used against Native Americans. It is this invisibility that leads to a college access and completion crisis among Native American students. When a student is invisible, his or her academic and social needs are not met. This leads to students feeling alienated and alone, derailing their matriculation and the realization of their dreams and potential.
Quite simply put, any study purporting to be about “women of color” or “people of color” should include disaggregated data on Native Americans, too. To miss this point, is not only to engage in, but to embrace paper genocide of Native Americans.
Guest Post: Student-Faculty Interactions: A Closer Look at the Office Hour

DeShun Harris
Assistant Clinical Professor of Law & Director of Bar Preparation
The University of Memphis Cecil C. Humphreys School of Law
Student-faculty interaction is an important component of law school. Indeed, LSSSE data indicate that the majority of students engage with faculty on matters other than coursework. In thinking about the many ways in which faculty engage with students whether in advising, academic support, mentoring, coaching, and office hours, it is important to consider how one-on-one meetings with students can be fruitful. As it relates to office hours specifically, because they are a requirement of the ABA, it’s important that think about the ways in which office hours can be conducive to learning and expand what is known about them.
My research of office hours unveiled how to enhance office hours: overcoming underutilized office hours, creating a welcoming office, understanding the office hour framework, and creating a learner-centered collaborative environment. While much of the formal published article focuses on the framework of office hours and creating a learning-centered environment, for readers here, I think it’s important to focus on overcoming underutilized office hours and creating a welcoming office. In other words, let’s think about how students are encouraged to attend office hours. This becomes of particular importance to ensure some students aren’t missing out on critical faculty-student interactions. It is important, given the changing times, that one considers how the office hour might be adapted especially when we return for Fall 2020.
Encouraging Attendance: Invite Students Directly
Students have perceptions about office hours that are often the result of past experience or perceptions of their professor. For example, some students may believe office hours are only for students who are struggling. Some other students may believe professors are unapproachable or unavailable. There are many reasons why students may choose not to attend office hours even when they may be beneficial. With many students returning or beginning law school remotely, breaking down those perceptions is going to be very important when other types of faculty-student interaction might be reduced or changed (e.g., talking to students immediately after class, bumping into students in hallways, or chatting with students at events). This will make engaging some students in the office hour more important.
Professors can address these perceptions and circumstances by being intentional about inviting students to their office hours. For example, place a statement in the syllabus that explains the purposes of office hours (e.g., to ask questions, to explore ideas beyond the scope of class, to strengthen their analytical skills, or to learn more about the profession). Professors can reaffirm office hours by inviting students to visit periodically through the semester by expressing it during lectures or through emails or postings to the learning management system. My research also indicates that giving meaningful feedback can be a useful way of increasing the usage of office hours by students even more so than creating a welcoming environment; as professors think about assessments, they may find more students come as they provide feedback.
The Office Setting: Make it Comfortable
While it may be a while for some law schools to begin in-person teaching, when it does begin professors should be aware that the physical office sends implicit messages to students. A messy office with papers strewn about can communicate busyness and that the student is taking up valuable time. An office that creates a great deal of space between student and professor can communicate a clear divide between the two, making it difficult for the student to share honestly. Finally, for some students, coming to a physical office can be intimidating or less accessible.
Professors can make their offices and themselves appear more accessible by minimizing clutter, minimizing computer screens, and silencing phones. These small steps can help the student feel invited rather than feeling they are a distraction. To the extent possible, professors should structure their offices in a way that communicates collaborations rather than a hierarchical barrier between professor and student. Where it isn’t possible to close spacing due to social distancing, alternatives can include situating one’s self side by side or sitting at a round table to keep an appropriate distance but feeling closer or collaborative.
Alternatives to the Office: Online Options Work Too
This past semester, many professors learned that the physical office hour isn’t the only way to meet students. Using email or instant messaging can be a good way to reach those students who may be unable to attend physical office hours. But research suggests that email can sometimes be read with unfavorable biases toward minorities and women. It is important to create clear policies for the appropriate use of email to avoid unyielding chains of emails or questions that may be more appropriate for discussion. Professors may also create policies related to when emails will be answered to alleviate the stress of feeling a need to respond.
Phone calls and videoconferencing are great tools that if used properly can replicate the in-person office hours. More research is needed to evaluate the best practices for doing so, but professors should think about what they are asking of students if they request students to appear on screen (for some students it could be breaking a barrier between home and professional life that they aren’t willing to cross due to shame or privacy concerns). And meeting students in locations other than one’s office like common spaces can also serve to break down barriers and create more accessibility. Alternatively, professors may consider reserving larger spaces that allow groups of students to meet with the professor which may also reduce any barriers the student may have.
Conclusion
Office hours are an important part of student-faculty interactions. Professors might consider ways in which they can enhance office hours and make them more available and welcoming to their students. With the changes brought by COVID-19, it is now more important that professors evaluate the ways in which they adapt online versions of our office hours or meetings we have with students, and also give thought to what future in-person office hours might look like.
___
References:
DeShun Harris, Office Hours Are Not Obsolete: Fostering Learning Through One-on-One Student Meetings, 57 Duquesne L. Rev. 43 (2019).
ABA Standard 404(a) (1), http://www.americanbar.org/content/dam/aba/publications/misc/legal_education/Standards/2016_2017_standards_chapter4.authcheckdam.pdf.
Looking Ahead: Assessment in Legal Education Annual Results 2014, http://lssse.indiana.edu/wp-content/uploads/2016/01/LSSSE_2014_AnnualReport.pdf.
Rosemarie Arbur, The Student-Teacher Conference, 28 College Composition and Communication 338 (1977).
Elaine S. Barry, Using Office Hours Effectively, Observer, June/July 2008.
Whitney Griffin, et. al, Starting the Conversation: An Exploratory Study of Factors That Influence Student Office Hour Use, 62 College Teaching 94 (2014).
Mario Guerrero and Alisa Beth Rod, Engaging in Office Hours: A Study of Student-Faculty Interaction and Academic Performance, 9 Journal of Political Science Education 403 (2013).
Lydia Eckstein Jackson and Aimee Knupsky, “Weaning off of Email”: Encouraging Students to Use Office Hours over Email to Contact Professors, 63 College Teaching 183 (2015).
Robin S. Wellford-Slocum, The Law School Student-Faculty Conference: Towards A Transformative Learning Experience, 45 S. Tex. L. Rev. 255, 262 (2004).

Guest Post: Empirical Sociolegal Research and the Use of LSSSE Data
Guest Post: Empirical Sociolegal Research and the Use of LSSSE Data

Ajay K. Mehrotra
Director & Research Professor
American Bar Foundation
Shih-Chun Chien
Research Social Scientist
American Bar Foundation
Thanks to Meera Deo and everyone at the Law School Survey of Student Engagement (LSSSE) for the opportunity to contribute to the blog. As most readers of this blog know, LSSSE provides a unique and in many ways unparalleled dataset on the law student experience across both time and place. Simply put, LSSSE is a treasure trove of valuable data for scholars studying legal education and the legal profession, as well as for law school administrators seeking to learn more about the law student perspective. In previous blog posts, several of our American Bar Foundation (ABF) colleagues have described how their long-term empirical and interdisciplinary research projects have benefited from access to LSSSE data. In this post, we would like, first, to underscore what makes LSSSE data special and valuable for empirical, sociolegal scholars studying legal education and the profession. Second, we describe the ABF and what sets it apart as a non-profit, non-partisan, independent research institute focusing on law. Finally, we conclude by discussing a recent ABF project on diversity and inclusion that leverages LSSSE data to explore law student career preferences and expectations about judicial clerkships.
The Uniqueness of LSSSE Data
Last year marked LSSSE’s 15th year anniversary. In that decade and a half, LSSSE has collected responses from over 370,000 law students from roughly 200 law schools across the United States, Canada, and Australia. Survey respondents represent a broad cross-section of law students from a variety of law schools and countries. What began in 2004 as a modest research project at the Indiana University Center for Postsecondary Research has successfully evolved into the largest dataset of law student survey responses in existence. LSSSE’s annual survey results provide law schools and researchers with a unique, comparative perspective on student views and perceptions, allowing administrators to see how student attitudes at their school might correspond with and differ from peer schools and national averages.[1] Likewise, because LSSSE provides longitudinal data, using nearly identical questions in surveys over time, consumers of LSSSE data can measure continuity and change in student perceptions and beliefs. In short, the scale and scope of LSSSE data is remarkable.
There are, to be sure, other organizations that collect data about legal education and law students. The American Bar Association (ABA), the National Association of Law Placement (NALP), and individual law schools themselves gather a tremendous amount of information, from admissions statistics to employment placement numbers. And some law schools survey their own students about their educational experiences. But LSSSE, as our ABF colleague Stephen Daniels notes in his blog post, provides not just information about students but information directly from students. The surveys give students a voice.
In addition to generating distilled data from its annual survey, LSSSE also provides an invaluable service by publishing highly accessible annual reports. By translating social science findings into lay terms, LSSSE researchers highlight particular themes and patterns about the law student experience based on survey results. In recent years, annual reports have examined the challenges and opportunities faced by women law students; the importance of relationships with faculty, staff, and fellow students; and student employment preferences and expectations, among other significant topics.
ABF Empirical Research
LSSSE data and reports are particularly salient for the type of empirical and interdisciplinary research conducted at the ABF. Established in 1952 as an independent non-profit, non-partisan research organization, the ABF is among the world’s leading research institutes for the study of law, legal institutions, and legal processes. Among the ABF’s three main areas of research, the one that is most closely connected to LSSSE is our work on “Learning & Practicing Law.”[2] Within this research portfolio, we have several ABF scholars who are investigating an important array of legal education topics, from Stephen Daniels’s study of student assessments of law schools to C.J. Ryan’s work on the financing of legal education. Each of these rigorous and sophisticated empirical research projects is examining long-term trends in legal education – trends that can only be identified and analyzed with the type of data administered by LSSSE.
LSSSE data complements the ABF’s core research mission. The data help scholars, at the ABF and elsewhere, address some of the most pressing issues facing the legal system, including legal education. To tackle empirical questions about the quality, value, and impact of legal education, for instance, one must have access to data – data about how students have perceived and responded to their law school experiences. One new ABF research project that harnesses LSSSE data in this way is our study of diversity and inclusion (or lack thereof) in judicial clerkships.
The ABF’s Recent “Diversity and Judicial Clerkships” Project
In 2019, the ABF launched a new project (Portrait Project 2.0) exploring how Asian Americans are situated in the legal profession. This new ABF research follows up on an earlier study (A Portrait of Asian Americans in the Law) led by the Honorable Goodwin Liu of the California Supreme Court, in collaboration with Yale Law School and the National Asian Pacific American Bar Association (NAPABA). The ABF-led Portrait Project 2.0 delves deeper into the many challenges and opportunities faced by the Asian American legal community. The project aims to understand the factors that shape the careers of Asian American lawyers. One of the aims is to understand why Asian Americans are not reaching the upper echelons of the profession – from judicial clerks, to law firm partners, to top prosecutors and judges, to law school deans and non-profit executives.
As part of Portrait Project 2.0, ABF researchers and collaborating scholars are investigating why women and minority law students do not secure clerkships in proportion to their numbers at top law schools. Existing literature on judicial clerkships has identified the persistent lack of gender and racial diversity in federal judicial clerkships.[3] Despite the growing interest in diversity and inclusion in the profession, we currently lack a fundamental, baseline understanding of different components of the judicial clerkship “pipeline.”
Before we can provide answers to some of the diversity challenges, we must identify and analyze the factors that have facilitated or frustrated the goals of diversifying judicial clerkships. We believe there are at least three critical mechanisms that contribute to the disparities in judicial clerkships: (a) self-selection by students based on personal preferences, perceptions, family expectations, occupational choice, or ambient signals; (b) advising and mentoring by law school faculty, staff, and administrators; and (c) selection by judges.
Because LSSSE provides longitudinal data on race and gender, and students’ career preferences and expectations, its value to our project is twofold. First, it provides an empirical baseline of overall student perceptions versus expectations. A recent LSSSE annual report, for instance, demonstrates that judicial clerkships are frequently more aspirational than expected career goals, especially for women and minority students. Second, LSSSE highlights the imminent need for original data about the institutional support mechanisms for law students, including how law schools track, advise, encourage, and mentor students interested in pursuing judicial clerkships.
Generally, clerkships are an appealing career path for those law students interested in working in “public service settings.” According to a recent LSSSE annual report, among the 36% of law student respondents who preferred to work in a “public service setting,” obtaining a judicial clerkship was the second most sought after public setting, behind “government agency” and ahead of “public interest group.” Perhaps more saliently for our nascent study, the survey also found that there was a significant spread between respondents’ “preferences” for a clerkship and their “expectations” that they would secure such employment – a spread that was larger than any other public service settings. This suggests that law students overall believe that a clerkship is frequently an aspirational goal [see Chart 1].
Chart 1: Proportion of Respondents Preferring and Expecting Public Service Settings
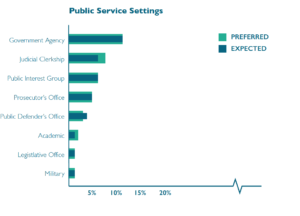
The LSSSE report also highlights how race and gender play an important role in career preferences and expectations. The 2017 report found that White and Asian American students preferred judicial clerkships more than other racial groups. The overall picture on gender differences was even more pronounced. Not only did men prefer judicial clerkships more than women; when it came to career expectations, men continued to have judicial clerkships as their second expected public setting, whereas for women, judicial clerkships dropped out of the top three public setting career expectations. Our ABF research team is in the process of analyzing subgroup differences and more recent LSSSE data on career preferences and expectations to measure more precisely the gap between preferences and expectations and to explore whether these beliefs have continued or perhaps changed over time.
Conclusion
In sum, LSSSE data is an extraordinary asset for a vast array of research questions about law student preferences, expectations, and experiences. With its student-centered approach and rigorous design, LSSSE has advanced our understanding of numerous aspects of legal education and the profession. Still, LSSSE remains an underutilized source for serious and sophisticated empirical, sociolegal research. While many ABF scholars have been mining LSSSE data for the past decade, there is much more that other researchers could be doing with LSSSE. Our recent ABF project on diversity and judicial clerkships is just one modest example of how LSSSE data can be leveraged to tackle some of the most pressing concerns facing legal education and the profession. We hope other empirically oriented scholars will join us in engaging with, and making use of, LSSSE data.
____________________
[1] In a recent LSSSE blog post, American University Washington College of Law Dean Camille Nelson accurately referred to such use of LSSSE as “data-driven deaning,” available at: https://lssse.indiana.edu/blog/guest-post-towards-data-driven-deaning/.
[2] The ABF’s three core areas of research are: (1) Learning & Practicing law; (2) Protecting Rights and Accessing Justice; and (3) Making & Implementing Law. For more on the ABF’s research mission and examples of its research please visit the ABF website at: http://www.americanbarfoundation.org/index.html.
[3] NALP, “Bulletin: Increasing Diversity of Law School Graduates Not Reflected Among Judicial Clerks” September, 2014, available at: https://www.nalp.org/0914research; Danielle Root, Jake Faleschini, Grace Oyenubi, “Center for American Progress: Building a More Inclusive Federal Judiciary” October 3, 2019, available at: https://www.americanprogress.org/issues/courts/reports/2019/10/03/475359/building-inclusive-federal-judiciary/; Todd Ruger, “Law.com: Statistics Show No Progress in Federal Court Law Clerk Diversity” May 2, 2012, available at: https://www.law.com/nationallawjournal/almID/1202551008298&Federal_courts_making_no_progress_regarding_law_clerk_diversity_numbers_show/.