Trends in Preferences & Expectations for Employment After Law School
The newly released LSSSE 2017 Annual Results explore the relationship between students’ preferred and expected work settings post-graduation. In a series of related blog posts, we will share tidbits of information about where law students hope to work, where they expect to work, and how these preferences and expectations vary by race and gender. In our final post, we will look at patterns in students’ preferred and expected work settings relative to their projected levels of student loan debt.
LSSSE asks respondents to identify the setting in which they would most prefer to work after graduation and the setting in which they most expect to work. Preferences can be seen as representing a respondent’s ideal outcome; expectations can be seen as representing perceptions of a realistic outcome. For both questions, respondents are asked to choose between sixteen answer options.
For purposes of much of the analyses in this report, the answer options were divided into two broad groups:
Public Service Settings
- Academic
- Government agency
- Judicial clerkship
- Legislative office
- Military
- Prosecutor’s office
- Public defender’s office
- Public interest group
Private Settings
- Accounting firm
- Business and industry
- Nonlegal organization
- Private firm – small (fewer than 10 attorneys)
- Private firm – medium (10-50 attorneys)
- Private firm – large (more than 50 attorneys)
- Solo practice
The “Other” response was removed from our analysis. The primary factor underlying the assignment of an answer option to one of the two groupings was whether a person working in that setting would likely qualify for Public Service Loan Forgiveness (PSLF), which typically requires one to be employed in the government or non-profit sector. There is naturally some imprecision in the assignments.
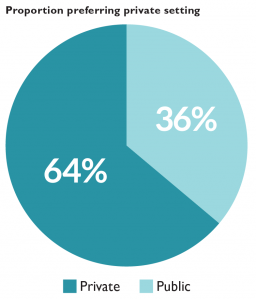
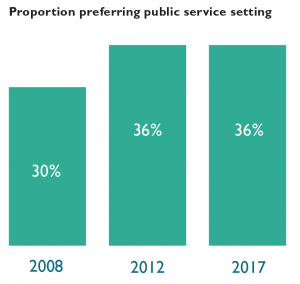
Sixty-four percent of respondents indicate a preference for working in one of the private settings, with the remaining 36% preferring public service. This proportion is unchanged from five survey administrations ago (2012) and higher than the 30% public service proportion ten administrations ago (2008).
Seventeen percent of respondents would prefer to work in medium-sized law firms, making this category the most popular private setting and the most popular setting overall. Government agencies are the most popular public setting, with 11% of respondents indicating that preference. Medium-sized law firms are also the most commonly expected private work setting, accounting for 20% of respondents. Small law firms are the fourth most preferred private setting yet the second most common expected setting. Government agencies are the most commonly expected public service setting.
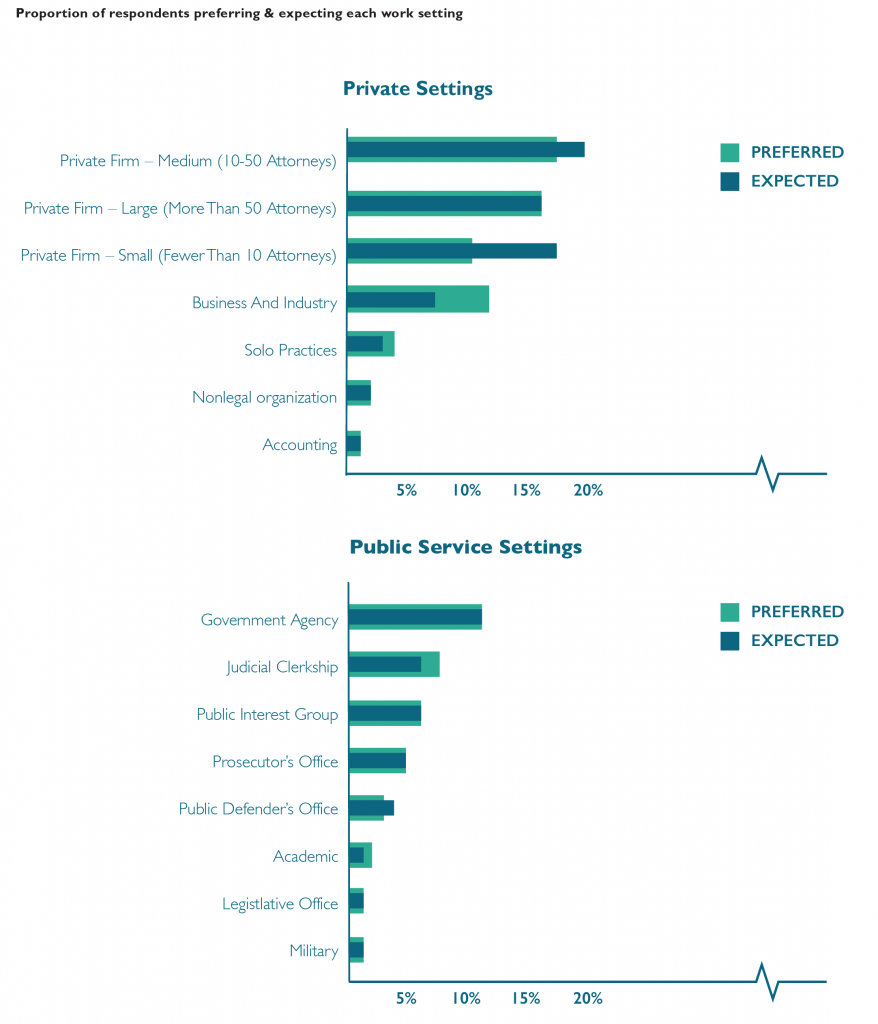
Forty-four percent of respondents indicate a different expected work setting than their preferred setting. Respondents who prefer to work in an academic setting are least likely to expect to work in that setting, with only about one-in-five matching preference with expectation. Respondents who prefer to work in large law firms or as prosecutors are most likely to also expect to work in those settings.
Forty-six percent of respondents who prefer one of the public service settings expect to work in a non-preferred setting, including one-quarter who expect to work in private settings instead. Forty-one percent of respondents who prefer one of the private settings expect to work in a different setting, but only 12% of students who prefer to work in a private setting expect to work in public service instead.
LSSSE Demographic Characteristics Reflect the U.S. Law Student Population
The Law School Survey of Student Engagement (LSSSE) provides a treasure trove of information about the law school experience from the perspective of law students themselves. LSSSE partners with legal education scholars to provide access to de-identified data about topics ranging from student satisfaction to time usage to personal and professional development. Many researchers – particularly those interested in questions of diversity and equity – are interested in how closely the students surveyed by LSSSE reflect the gender and racial/ethnic composition of the entire law school population. To answer this question, we compared the self-reported gender and race of 2017 U.S. 1L LSSSE respondents to the 2017 matriculant gender and race/ethnicity aggregate data available from the American Bar Association (ABA).
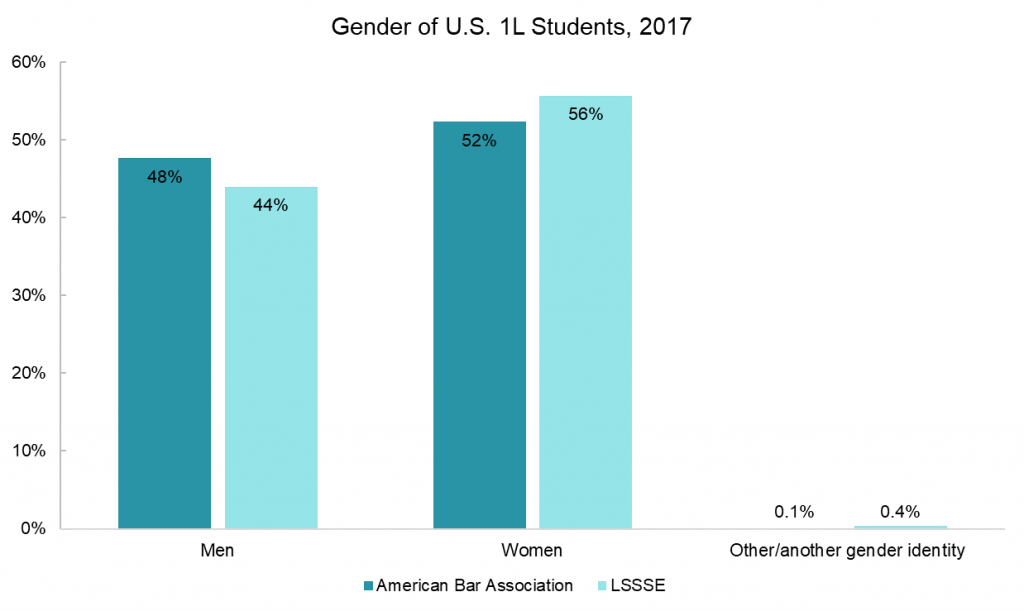
The ABA reported that slightly more women than men enroll in law school (52% vs. 48%). U.S. 1L LSSSE respondents in 2017 were similarly more likely to be female than male (56% vs. 44%). Although both the ABA and LSSSE collected data students identifying as “Other” (ABA) and “Another gender identity” (LSSSE), these individuals make up only a tiny fraction of the law student population (24 people according to the ABA and 22 people who responded to LSSSE).
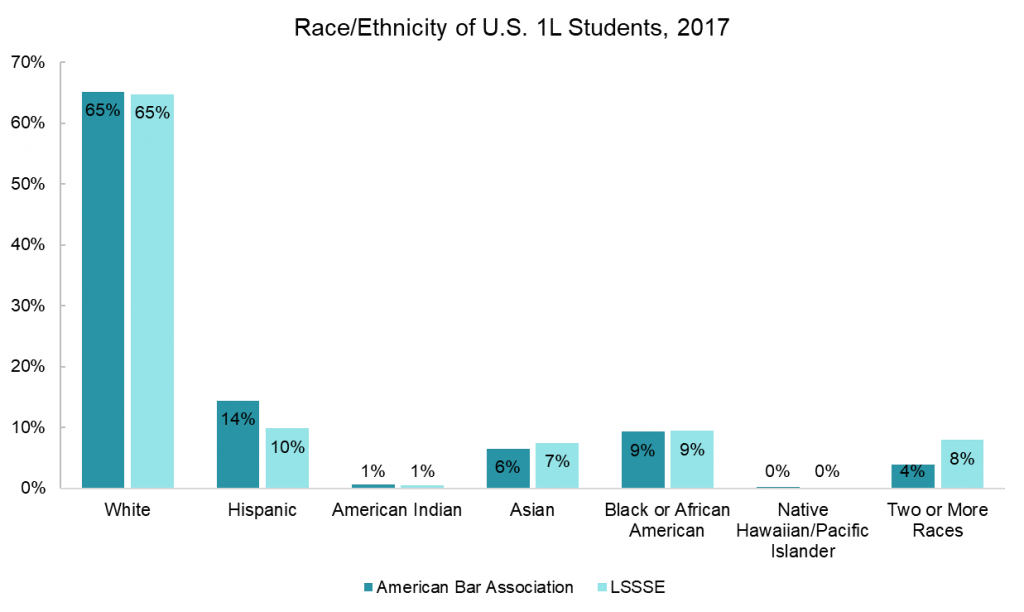
The 1L students who responded to LSSSE in 2017 were also quite similar to the overall population of 1L students at all ABA-accredited programs in terms of racial/ethnic makeup. Sixty-five percent of both groups were white, nine percent were black or African-American, and around six percent were Asian or Asian-American. The ABA reported a slightly higher proportion of Hispanic students (14%) compared to the proportion of Hispanic LSSSE respondents (10%), and LSSSE respondents were more likely than the population of 1L students at ABA-accredited law schools to be multiracial (8% vs. 4%). However, the overall pattern of race/ethnicity frequency is quite similar among the two populations. Thus, LSSSE respondents tend to represent the demographic characteristics of law students in general.
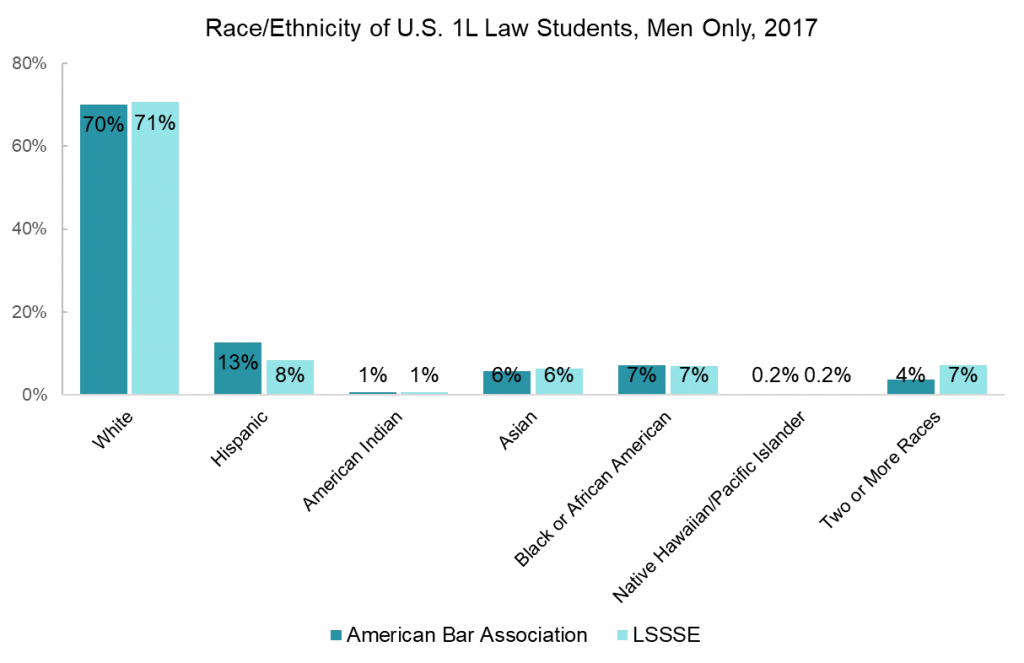
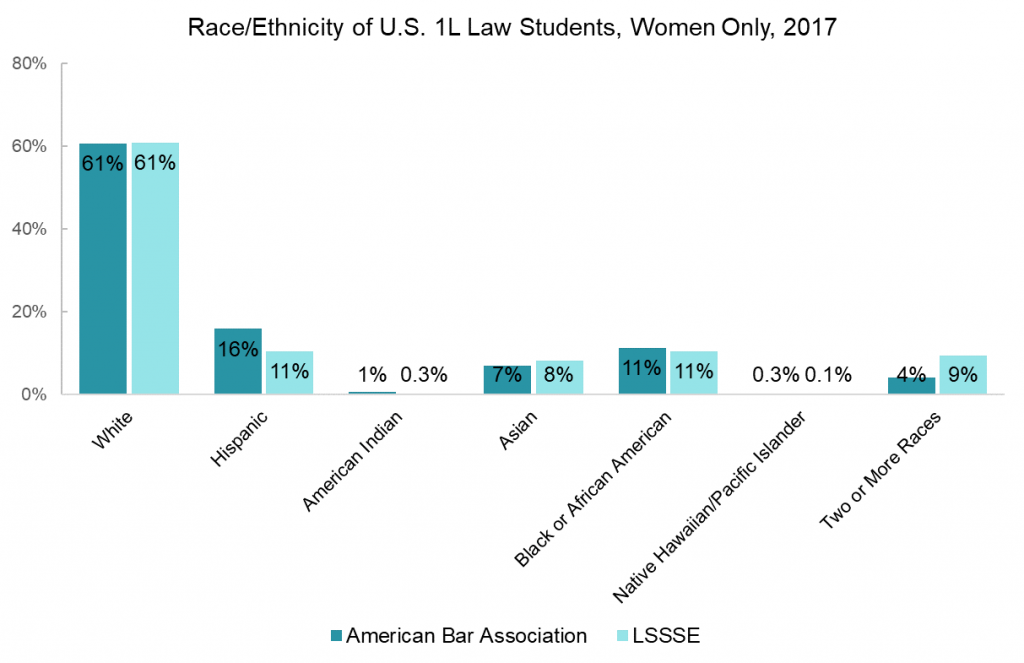
The ABA and LSSSE datasets also allow us to examine the intersection of gender and race/ethnicity among 1L students. Interestingly, a higher proportion of male law students than female students are white (70% vs. 61%). The general trends regarding the proportions of students from different racial and ethnic groups described across all students hold true for men and women when examined separately, but the same cannot be said for students of other gender identities, likely because this group is so small.
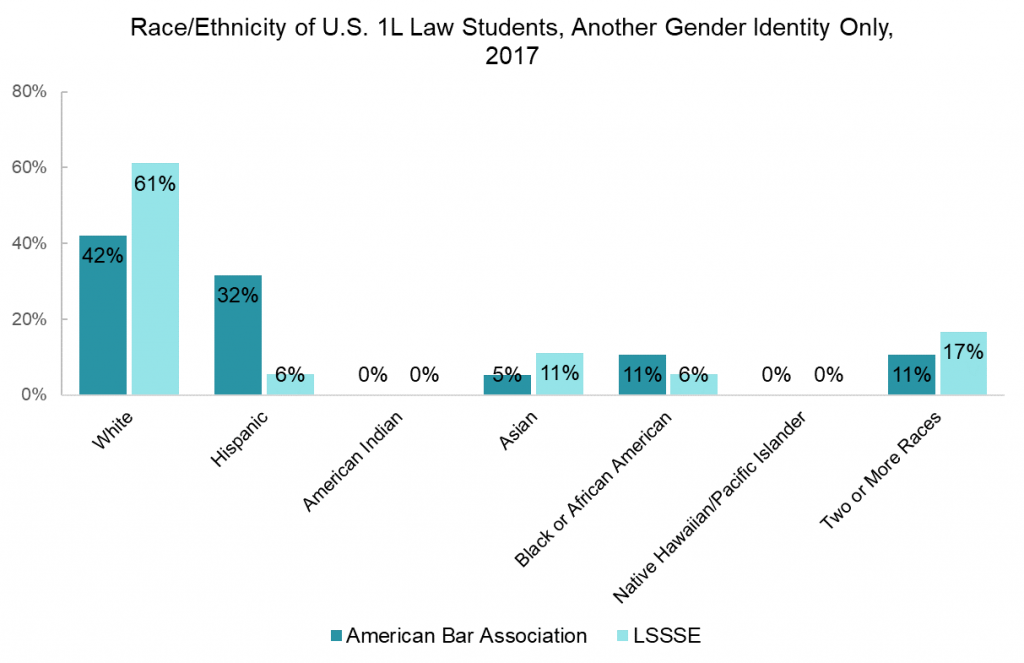
In the aggregate, LSSSE offers a representative sample of law students in terms of both race/ethnicity and gender identity, making it a great source of information about student engagement and the law school experience. Check out some of the publications using LSSSE research or contact us to discuss how a LSSSE data-sharing agreement might enhance your legal education research project.
LSSSE Annual Results: Black and Latino Respondents Expected The Most Debt
This is the third installment in a series of posts centered around data from the 2015 LSSSE Survey administration and the 2015 Annual Report, which provides a retrospective glimpse into law student debt trends over a 10-year period, 2006 to 2015, with 2011 as a midpoint. This post discusses student debt trends based on race and ethnicity. For sake of clearer explication of trends, this post focuses on respondents who identified as Asian, Black, Hispanic/Latino, or White.
Reliance on student loans is largely a reflection of wealth and access to alternative sources of funds. Students from less affluent backgrounds tend to rely on student loans to greater extents than their more affluent peers. This means that the large racial and ethnic wealth disparities in the U.S. have broad implications on student debt trends.
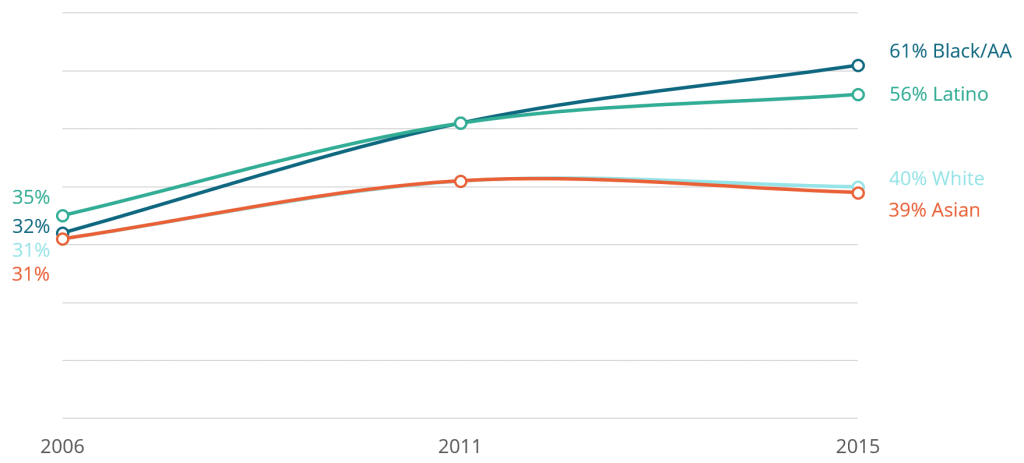
In each of the survey years, white and Asian respondents were more likely than black and Latino respondents to expect no debt. Regarding high debt, a telling trend was observed. In 2006, there were only marginal racial and ethnic differences in expectations of more than $100,000 in debt. By 2011, however, clear disparities emerged, with black and Latino respondents more likely to expect debt at this level. By 2015, the disparities became more intense, with 61% of black respondents and 56% of Latino respondents expecting debt at this level, compared to about 40% of white and Asian respondents. That year, 43% of black respondents expected to owe more than $120,000—the first time a racial or ethnic group crossed the 40% threshold on any LSSSE debt category.[i]
[i]. Proportion of expected debt at various levels, by race
