
Annual Results 2020 Diversity & Exclusion: Institutional Support for Diversity
This year for the first time, LSSSE introduced a set of questions focused on diversity and inclusion that supplement related questions from the primary survey. The Diversity and Inclusiveness Module examines environments, processes, and activities that reflect the engagement and validation of cultural diversity and promote greater understanding of societal differences. The 2020 LSSSE Annual Results Diversity & Exclusion report presents data about how diversity in law school can prepare students for the effective practice of law upon graduation. In our next three posts, we will highlight key findings from the report and suggest some areas for improvement.
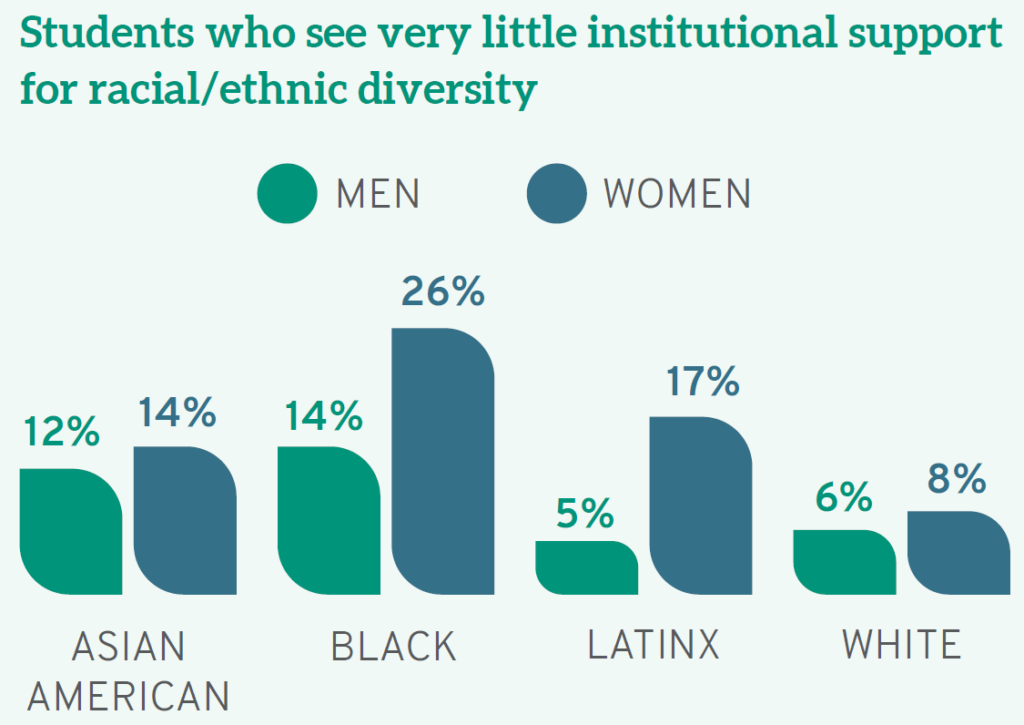
Support for diversity in law school must begin with the institution. Yet many students of color do not see their campus as supportive of racial/ethnic differences. Almost a quarter (23%) of Black law students nationwide say their schools do "very little" to create a supportive environment for race/ethnicity, compared to just 6.8% of White students. At the opposite end of the spectrum, 32% of White students believe their schools do "very much" to support racial/ethnic diversity, compared to only 18% of their Black classmates. Men (37%) are also more likely than women (26%) and those of another gender identity (7.5%) to believe their campus is very supportive of racial/ethnic diversity. Even more dramatic are intersectional identity findings, as a full 26% of Black women— more than any other raceXgender group—see their schools doing "very little" to create an environment that is supportive of different racial/ethnic identities, as compared to just 5.5% of White men (while 72% of White men believe their schools do "quite a bit" or "very much" in this arena).
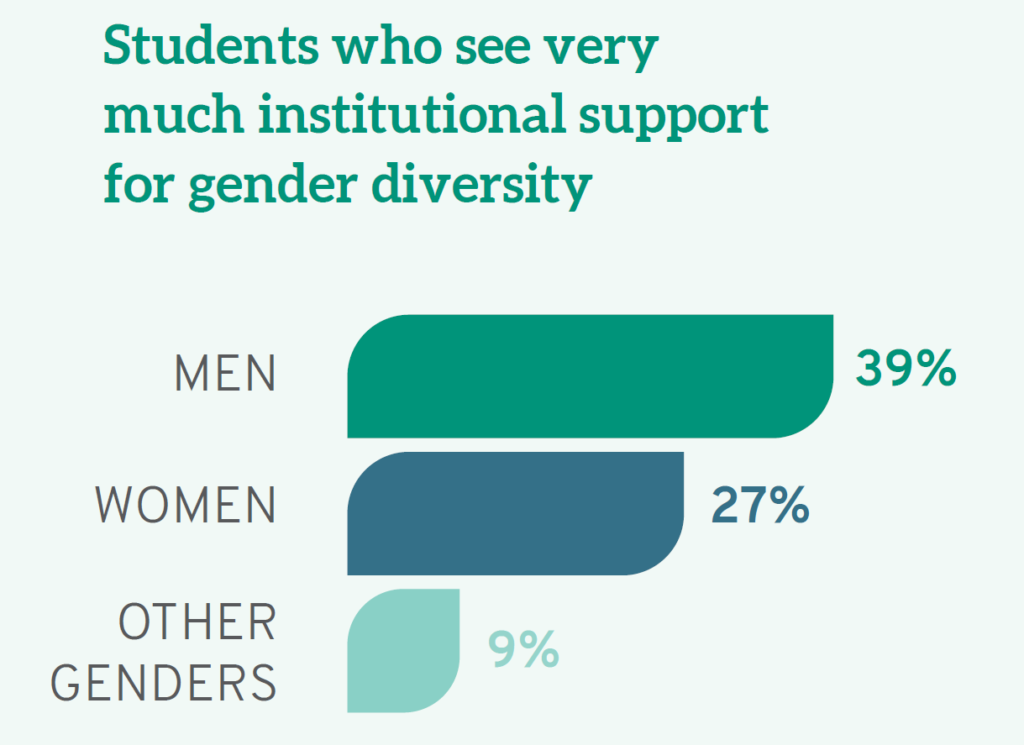
Men are also more likely to see their campus as a "supportive environment for gender diversity," with 39% believing this "very much" as opposed to 27% of women students, and only 9% of students who identify as another gender identity. Furthermore, White students as a whole (33%) see the campus as very supportive of people of different genders, compared to 21% of Native Americans and Black students. Again, the views of White male students differ significantly from most others with a full 40% seeing their campus as very supportive of gender difference. In short, women as well as others from less privileged groups do not see their schools as particularly supportive of gender inclusivity.
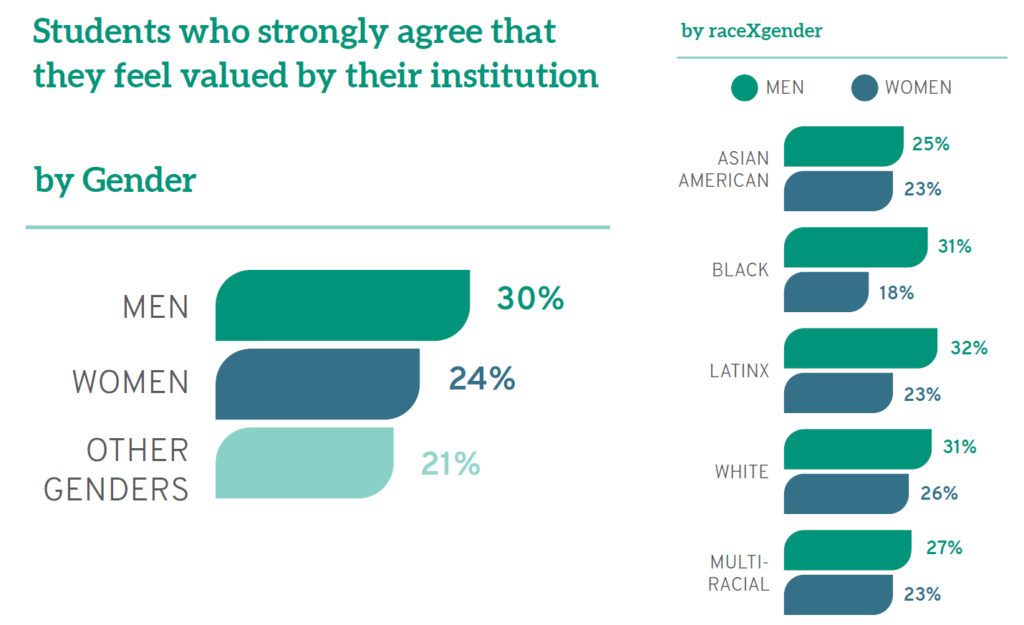
Not surprisingly, given the relative lack of support they see for racial/ethnic and gender diversity on campus, women and students of color also believe their schools are less invested in them as individuals. When asked whether they "feel valued" by their law school, a full 30% of men "strongly agree" compared to only 24% of women and 21% of those who identify as neither male or female. Similarly, the racial/ethnic group most likely to "strongly agree" is Whites (28%). In fact, while Latinos, White men, and Black men "strongly agree" that they are valued at roughly equal rates, men feeling more valued than women is consistent across every racial/ethnic group. Furthermore, students who are the first in their families to earn a college degree, often called "first-gen" students, feel less valued by their institution: a full third (33%) note they do not feel valued, compared to a quarter (25%) of others, which is also a significant proportion of law students overall.
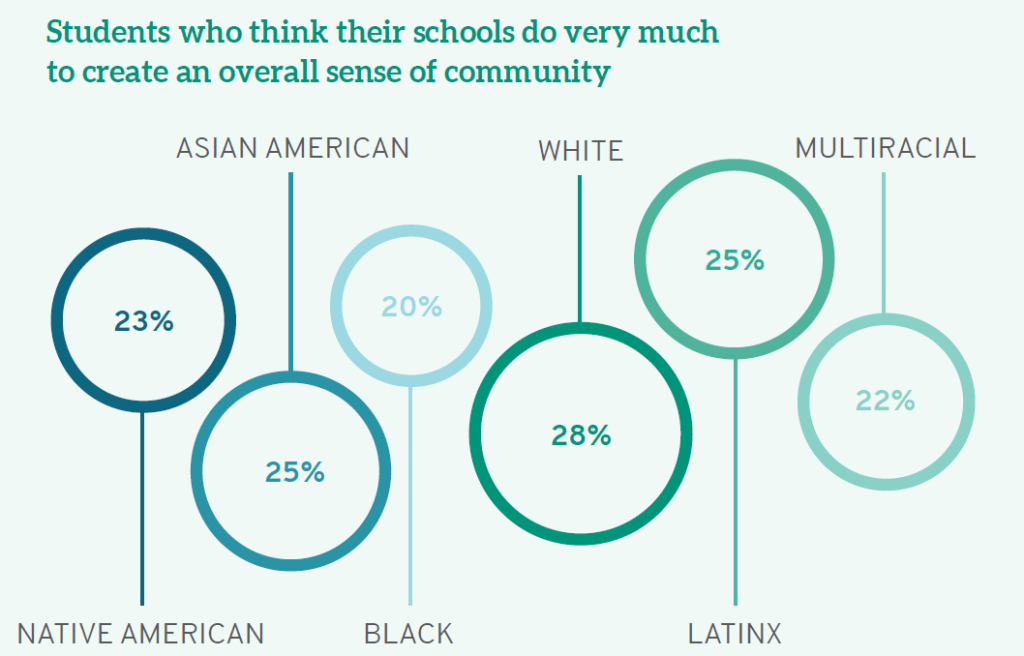
Institutions can put mechanisms in place to foster community among those on campus, regardless of their background or experiences. Finding this common ground helps all students understand that they belong and that others who may be different should be equally welcome. Again, White students are most likely to believe their institution emphasizes the importance of "creating an overall sense of community among students." While 28% of White students think their schools do this "very much," smaller percentages of students of color feel similarly. Even more disheartening, 18% of Black students and 14% of Latinx students think their schools do "very little" to foster community.
Many law schools have made concerted efforts to add student diversity to their campuses. But once students enroll, we owe it to them to provide a safe and welcoming environment, one where they feel valued, where they can be themselves, where they acquire the tools they need to succeed in the workplace, and where they can thrive. Admitting and even enrolling more students of color, first-gen students, students who identify as LGBTQ, and women is not enough unless that diversity is accompanied by inclusion. Law schools that want their students to succeed as future lawyers and leaders must commit to fostering a campus community where the most vulnerable and non-traditional are encouraged to reach their full potential, where faculty are expected to train students not only for the global marketplace but for the realities of American life, and where all students appreciate their own backgrounds, biases, and responsibilities to the profession.

LSSSE Annual Results 2019: The Cost of Women’s Success (Part 2)
Contextualizing Women’s Success
Women’s relative success in law school is quite significant when we consider basic demographic differences between women and men when they first enroll in law school. Fewer economic resources and lower test scores do not seem to inhibit women from achieving at high levels once on campus.
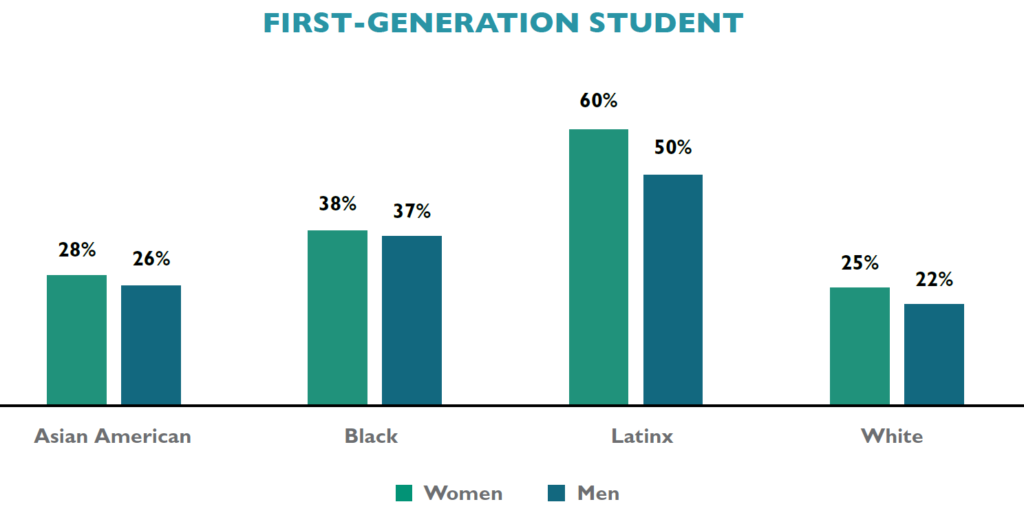
Parental education is a common proxy not only for family income but for future educational success, with the children of highly educated parents generally drawing on class privilege and extra resources to achieve at high levels. LSSSE data reveal that women are more likely than men to be first-generation law students, with 30% reporting that neither parent holds a bachelor’s degree as compared to 25% of male law students. This finding is consistent for women regardless of race/ethnicity, with Asian American, Black, Latinx, and White women being more likely than men from those same backgrounds to be the children of parents who did not earn at least a college degree.
Even considering those whose parents are highly educated, women law students are less likely than men to have a parent who is a lawyer. Among those reporting that they have a parent who earned a doctoral or professional degree, 57% of men but only 52% of women report that their parent’s degree is a J.D. Only Asian American women are more likely than men from their same racial/ethnic background to have a parent with a law degree; higher percentages of male law students who are Black, Latinx, or White have a lawyer parent than women from those same backgrounds.
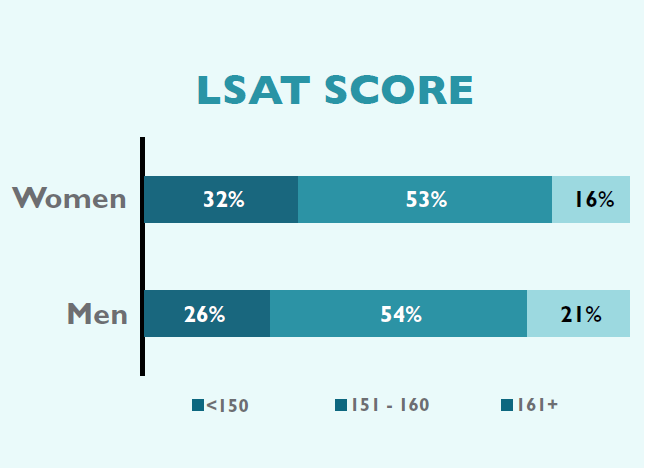
In addition to demographic differences based on parental status, women also report lower LSAT scores than men, even when comparing within racial/ethnic groups. While 21% of men report LSAT scores in the highest range of 161 or above, only 16% of women report similar achievement on this exam. This finding mirrors other critiques of high-stakes testing as potentially limiting opportunities for non-traditional students including women and people of color.
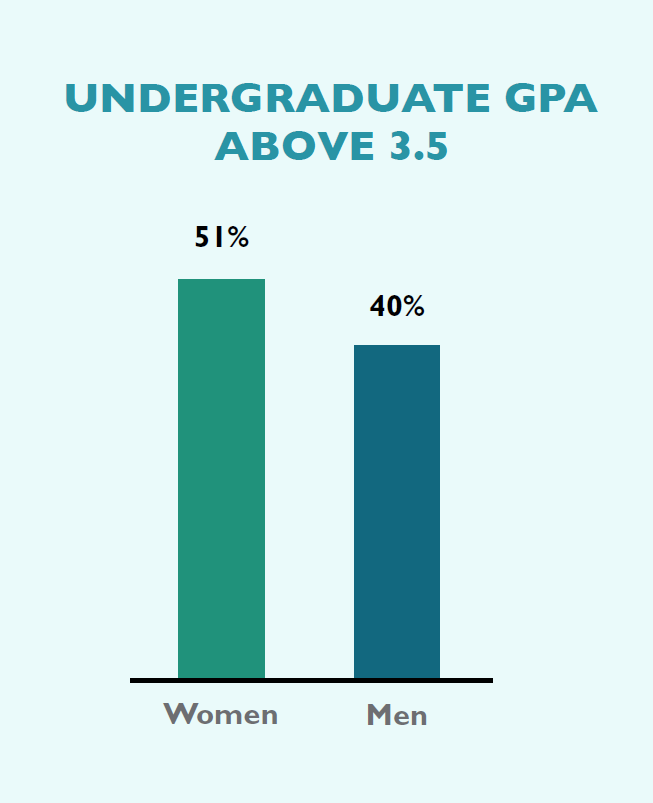
Conversely, higher percentages of women than men enter law school with undergraduate grade point averages (UGPAs) in the top range. A full 51% of women report UGPAs of 3.5 and above as compared to only 40% of their male classmates. As with LSAT scores, this gender finding is consistent across race/ethnicity: when comparing women and men from the same background, women outperform men on UGPA. Recall that in spite of the inconsistency of lower LSAT scores and higher UGPAs, women nevertheless report slightly higher overall law school grades than men. This may further bolster research questioning the value of using test performance as the primary determinant of expected success in law school and beyond.
The next post in this series will offer some opportunities for improvement in gender equity in legal education. You can read the entire LSSSE 2019 Annual Results The Cost of Women’s Success (pdf) on our website.
LSSSE Annual Results 2019: The Cost of Women’s Success (Part 1)
The past two decades have seen increasing numbers of women in law schools. After graduating from law school, women lawyers enjoy greater opportunities for financial independence, security of employment, and a potential for leadership facilitated by the J.D. degree. Yet, gender inequities in pay and position continue to plague the legal profession. In spite of this conundrum, there has been little scholarly attention given to the experience of women while in law school.
The 2019 LSSSE Annual Results celebrate women. We investigate the successes of women law students—using objective and subjective measures to reveal various accomplishments. We also interrogate their backgrounds and the context for their enrollment in law school, revealing challenges women overcome and the sacrifices they make to succeed. This Report not only shares findings on women as a whole, but also features comparisons by gender and race/ethnicity, providing greater depth and context to the overall experience of women law students. Our findings make clear that women’s success comes at great personal and financial cost. Greater awareness of these challenges provides both an imperative and an opportunity for administrators, institutions, and leaders in legal education to invest more deeply in the success of women.
The Good News
Women are succeeding in legal education along numerous metrics. When considering overall satisfaction rates, roughly equal percentages of women (81%) and men (83%) report that their entire experience in law school has been either “Good” or “Excellent.” In spite of generally high marks for all groups, there are notable differences by race/ethnicity. While the vast majority (75%) of Black women characterize their overall experience as positive, these rates are lower than those of women who are Asian American (78%), Latina (78%), and White (84%).
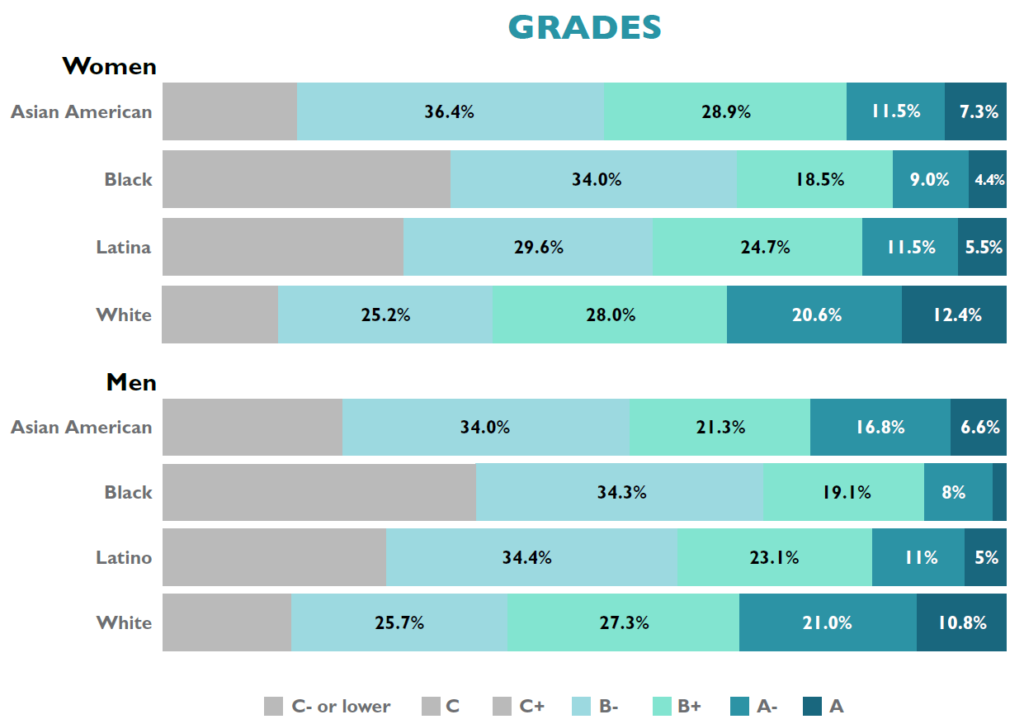
In addition to appreciating their law school experience, women are also excelling academically. Women’s self-reported law school grades are slightly higher than men’s. As one example 10.3% of women report earning mostly A grades in law school compared to 9.5% of men. There is important variation not only by race but also by the intersectional consideration of raceXgender. To start, 7.3% of Asian American women, 4.4% of Black women, and 5.5% of Latinas claim mostly A grades as compared to 12% of White women law students. Yet, when investigating grades within each racial/ethnic group by gender, women are nevertheless outperforming men.
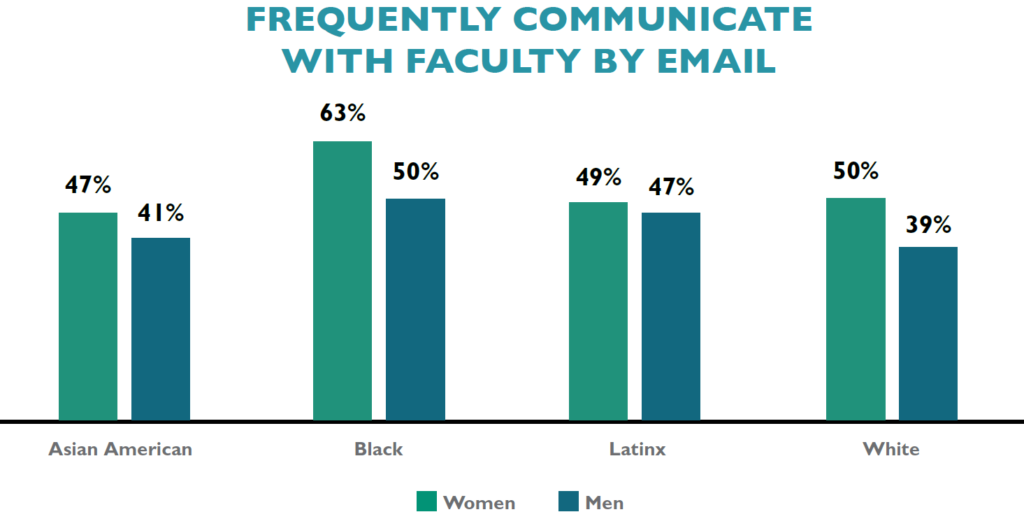
Additionally, women are adept at utilizing particular resources in law school, connecting with faculty and fellow students. Just over half (51%) of women use email to communicate with a faculty member “Very often” compared to only 40% of men. In fact, at 63%, Black women are more likely to engage in frequent email contact with faculty than any other raceXgender group. Women, regardless of their racial/ethnic background, are also more likely than men on average to engage in ongoing and frequent conversations with faculty and other advisors about career plans or job search activities. Women and men are also engaged in co-curricular activities at roughly equivalent rates, including the percentages participating in pro bono service, moot court, and law journals. A majority of students also enjoy positive interactions with classmates. A full 79% of men and 75% of women report the quality of their relationships with peers as a five or higher on a six-point scale. Furthermore, 65% of women rely on and invest in membership in law student organizations—which research has shown provide social, emotional, cultural, and intellectual support for many students. Black women (68%), Latinas (65%), Asian American women (60%), and White women (65%) join student groups at higher rates than men as a whole (53%).
Women are clearly engaged members of the law school community. Our next post in this series will discuss contextual differences between men and women before entering law school that suggest women are more likely to have to overcome obstacles to be successful. You can read the entire LSSSE 2019 Annual Results The Cost of Women’s Success (pdf) on our website.

Guest Post: LSSSE Data Illustrates Public Service Intent Among Asian American Law Students
Aryssa Ham
Undergraduate Researcher
University of California, Davis
Public Service Intent Among Asian American Law Students
What drives people to set aside their personal interests to help the collective? In 2017, Yale Law School and the National Asian Pacific American Bar Association found that Asian Americans gravitate towards careers in law firms and business over the public sector more than any other racial group, with few Asian Americans citing a desire to enter government as motivation to attend law school (Chung et al. 2017). Prior studies on the underrepresentation of racial minorities within the legal field often point to lack of academic or financial support as barriers to public service; yet Asian Americans were found to be the highest earning racial group in the U.S. and were overrepresented in top law schools (Sabharwal & Geva-May 2013; Kochhar & Cilluffo 2018; Chung et al. 2017).
This prompts a string of questions: Why are Asian Americans drawn to the private sector of the legal field? Why are they underrepresented in government and public interest? Alternatively, do Asian Americans prefer other forms of public service, such as pro bono work? If so, why doesn’t any other racial group appear to parallel this preference?
Despite past studies noting a weaker interest in the public sector among Asian Americans, few delve into potential explanations or examine variances among ethnicity. The original rallying, pan-ethnic Asian American identity has become a racial label that eclipses meaningful differences, propagating the Model Minority stereotype (Wu 2014:246). This social construct manifests in overlooked outcome disparities within the Asian American community, thus making ethnicity especially critical to examine.
As an undergraduate studying both psychology and sociology, I began an honors thesis last summer that integrates my majors: taking career decisions—a private, subjective experience—and zooming out to explore how these decisions interact with how society is organized and maintained. In my thesis, I study the professional trajectories of Asian Americans within the legal field—particularly the factors that determine whether and when an individual enters, stays, or switches into the public or private sector. Ultimately, I aim to shed light on why the legal profession is an underused entryway into government for Asian Americans, while simultaneously revealing the contrasting stories that vary by ethnicity.
Why LSSSE data?
I examine the extracurricular activities of law students to uncover patterns among students exhibiting public service motivation before fully entering the legal field. Although students can enter law school at different points in their life, I treat law school extracurriculars as the first major professional fork between the public and private sector.
While LSSSE data on student pro bono experiences are publicly accessible, ethnicity data are not shared on the website. After reaching out to Professor Meera Deo and LSSSE, they graciously provided the 2019 analyses that I needed.
I looked at 3 LSSSE Questions:
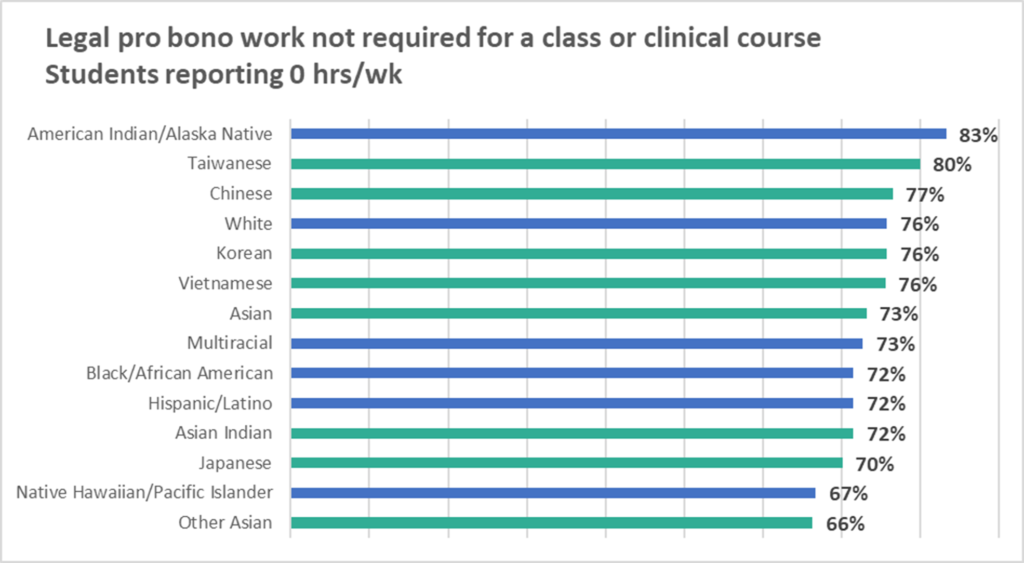
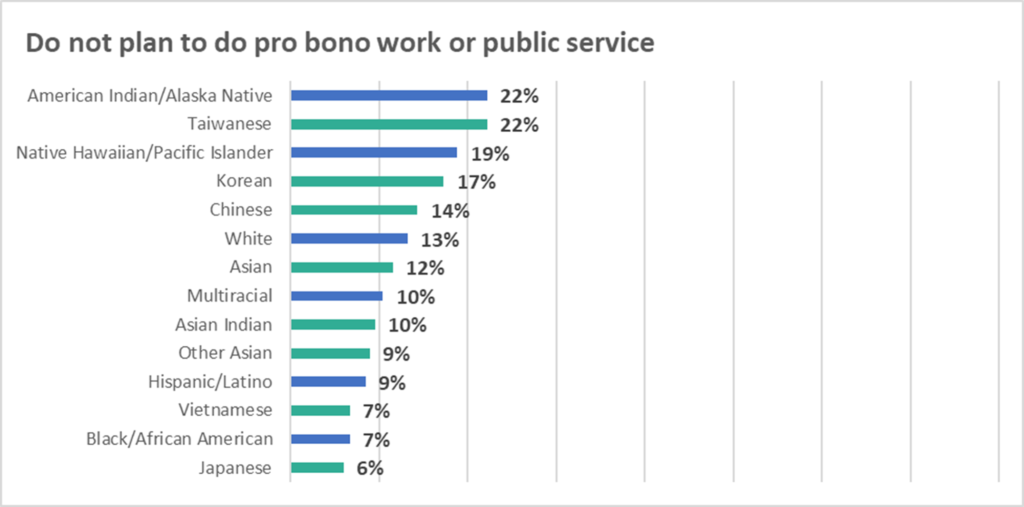
The first question (Pro Bono) asked for the number of hours a student spends each week doing legal pro bono work not required for a class or clinical course. The second (Public Service) asks if a student has done or plans to do pro bono work or public service before graduation, with response options "undecided," "do not plan to do," "plan to do," or "done." The final question (Clinical Project) asks how often a student has participated in a clinical or pro bono project as part of a course or for academic credit, with response options ranging from "never" to "very often."
Here’s what I found:
Pro Bono: Asian ethnicities with greater proportions of participation in pro bono work tend to be those with higher than national median incomes and better representation as elected officials, with four Japanese Americans and five Asian Indian Americans currently holding office in U.S. Congress, while other Asian ethnicities, such as Chinese, Korean, Taiwanese, or Vietnamese American, include one to two representatives, if at all. Other Asian, Japanese, and Asian Indian have the lowest proportion of students responding with "0 hours/week."
Public Service: While this question tracks progress from 1L to 3L, the graph echoes the results of Pro Bono, with Chinese, Korean, and Taiwanese American students being the only Asian ethnic groups with a higher proportion of “do not plan to do” than white students.
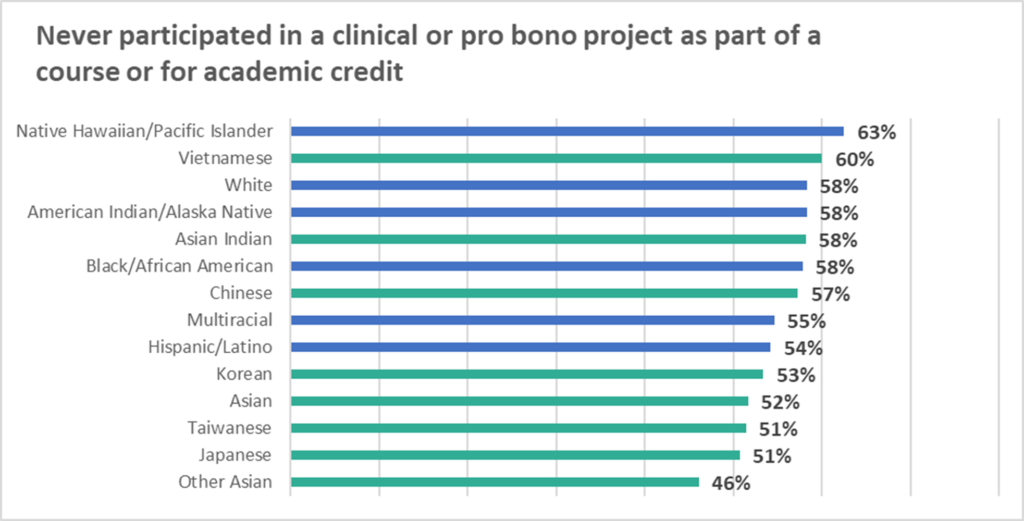
Clinical Project: The proportion of Asian Americans who have participated is the highest among all races. When broken down by ethnicity, Other Asian, Japanese, Taiwanese, and Korean American have the lowest proportion of “never” responses. On the other end, proportions of Asian Indian Americans reporting “never” (58.2%) most closely mirrors those of white students (58.3%). Finally, Vietnamese Americans have the highest proportion aside from Hawaiian/Pacific Islander reporting “never,” but they also have the second-highest proportion reporting “very often,” only behind Other Asian.
Note: The “Other Asian” label is large, with a sample size more than doubling three of the six other reported Asian ethnicities. Ideally, a Filipino category would have been useful among the ethnic breakdowns, as Filipino Americans constitute the third largest proportion of Asian Americans.
Main Takeaway
The findings reiterate how the Model Minority stereotype harmfully obscures the needs of many Asian Americans. Although the proportion of Asian Americans who contribute pro bono work is lower than other racial minorities and higher than white students, Asian ethnicities with fewer structural constraints (e.g., higher national median income, greater government representation) contribute a greater proportion of pro bono hours than Black and Latinx students, leaving students of other Asian ethnicities potentially overlooked or under-supported.
This concludes the survey portion of my thesis. To complement the survey data, I am conducting interviews with Asian American lawyers in both the public and private sectors. I hope to code the transcripts for potential public service motivation factors, uncover individual attitudes toward the public sector, and fully explore the linear and nonlinear paths of Asian Americans in law.
Huge thanks to Professor Deo and the LSSSE staff for being incredibly helpful! As an undergrad, I was astonished at how willing they were to accommodate me, and I’m so grateful for their support.
Finally, if anything piqued your interest, please don’t hesitate to contact me at aham@ucdavis.edu.
References
Chung, Eric, Samuel Dong, Xiaonan April Hu, Christine Kwon and Goodwin Liu, Yale Law School & National Asian Pacific American Bar Association, A Portrait of Asian Americans in the Law (2017).
Kochhar, Rakesh, and Anthony Cilluffo. “Income Inequality in the U.S. Is Rising Most Rapidly Among Asians.” Social & Demographic Trends Project, Pew Research Center, 12 Jul. 2018, www.pewsocialtrends.org/2018/07/12/income-inequality-in-the-u-s-is-rising-most-rapidly-among-asians/.
Sabharwal, Meghna and Iris Geva-May, “Advancing Underrepresented Populations in the Public Sector: Approaches and Practices in the Instructional Pipeline.” Journal of Public Affairs Education, 19:4, 2013, 657-679, DOI: 10.1080/15236803.2013.12001758
"U.S. Asians Have a Wide Range of Income Levels." Pew Research Center, Pew Research Center, 8 Sept. 2017, www.pewresearch.org/fact-tank/2017/09/08/key-facts-about-asian-americans/ft_17-09-08_asian_income/.

Annual Results 2018: Relationships Matter – Student Relationships
Decades of research on student engagement and student learning demonstrate the importance of peer interactions. Engaging with classmates in meaningful ways contributes to a deeper sense of belonging and enhances understanding of classwork, leading to better academic and professional outcomes (Hurtado & Carter, 1997; Pascarella & Terenzini, 2005; NSSE, 2013).
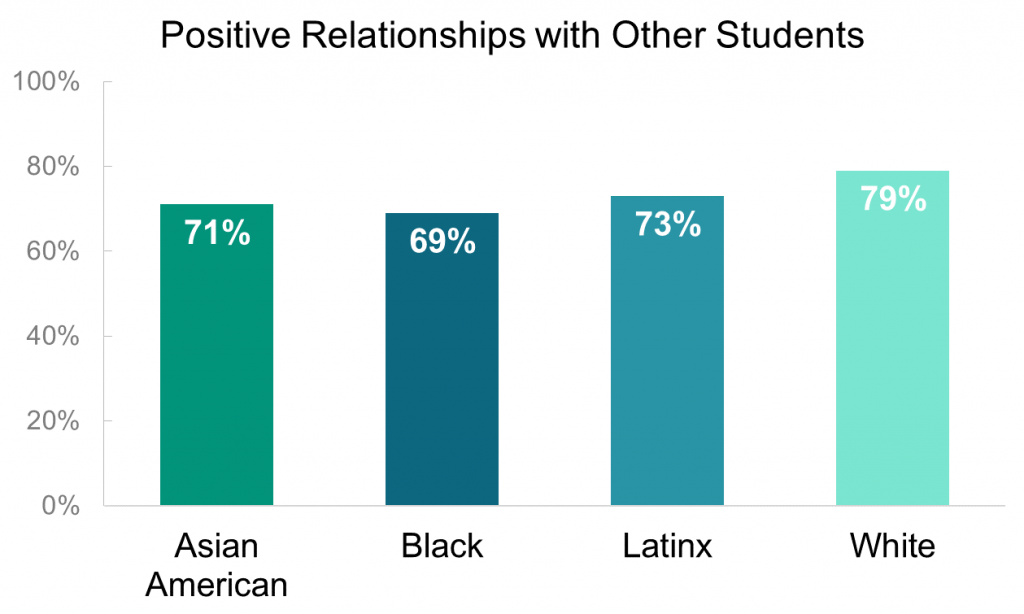
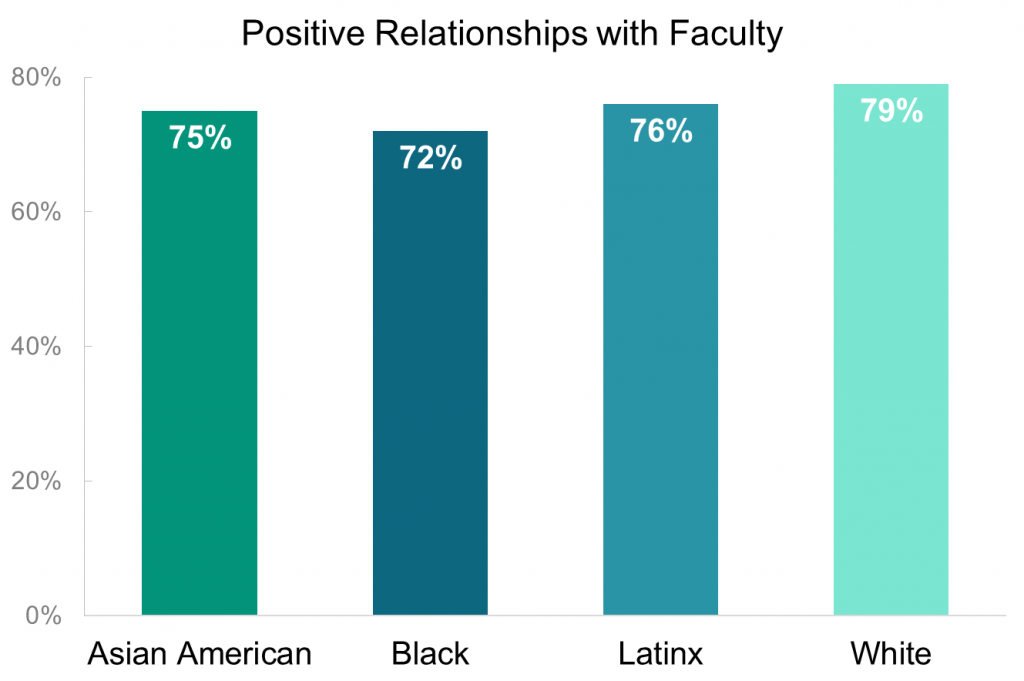
Although law school is an inherently stressful and anxiety-producing endeavor, the vast majority of students (76%) report that their peers are friendly, supportive, and contribute to a sense of belonging. There are noticeable variations by race/ethnicity. White students are most likely to report positive relationships with peers (79%), as compared to Black (69%), Asian American (71%), and Latinx (73%) students.
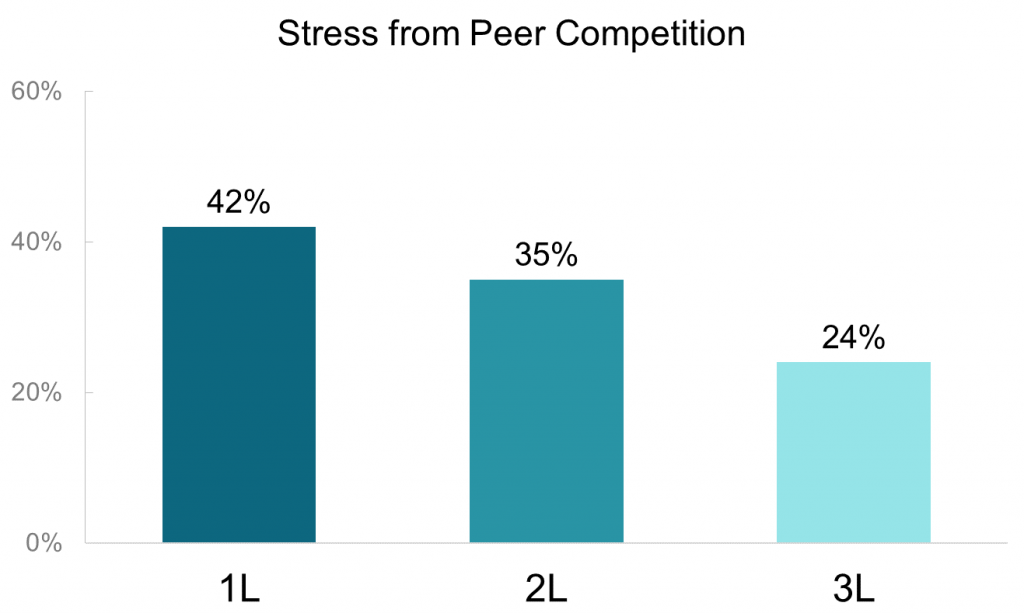
The Student Stress Module examines law student stress and anxiety—their sources, impact, and perceptions of support offered by law schools to manage stress and anxiety. One question asks directly about various sources of stress and anxiety that students may face in school. High percentages of students report that academic performance (77%) and academic workload (76%) produce stress or anxiety, but competition amongst peers does not create or magnify these feelings for most students. Students report that competition amongst peers is most significant during the first year of law school but sharply declines each year. Forty-two percent of 1L students report that peer competition is a source of stress or anxiety. By the third year of law school that number drops to 24%.

Annual Results 2018: Relationships Matter – Advising
A majority of students are pleased with the quality of advising and their relationships with administrators:
- 69% are satisfied with academic advising and planning.
- 66% are satisfied with career counseling.
- 64% are satisfied with job search help.
- 70% are satisfied with financial aid advising.
- 68% report that administrative staff are helpful, friendly, and considerate.
The quality of relationships with advisors and administrators is both positive and relatively consistent across race, gender, and year in school. Seventy percent of 1L students (and 67% of 2Ls and 3Ls) report that administrative staff are helpful, considerate, and flexible. Seventy-nine percent (79%) of students consider at least one administrator or staff member as someone they could approach for advice or guidance on managing the law school experience. Higher percentages of Black students (87%) rely on these relationships than students from other racial backgrounds (79% for Asian American, white, and Latinx students).
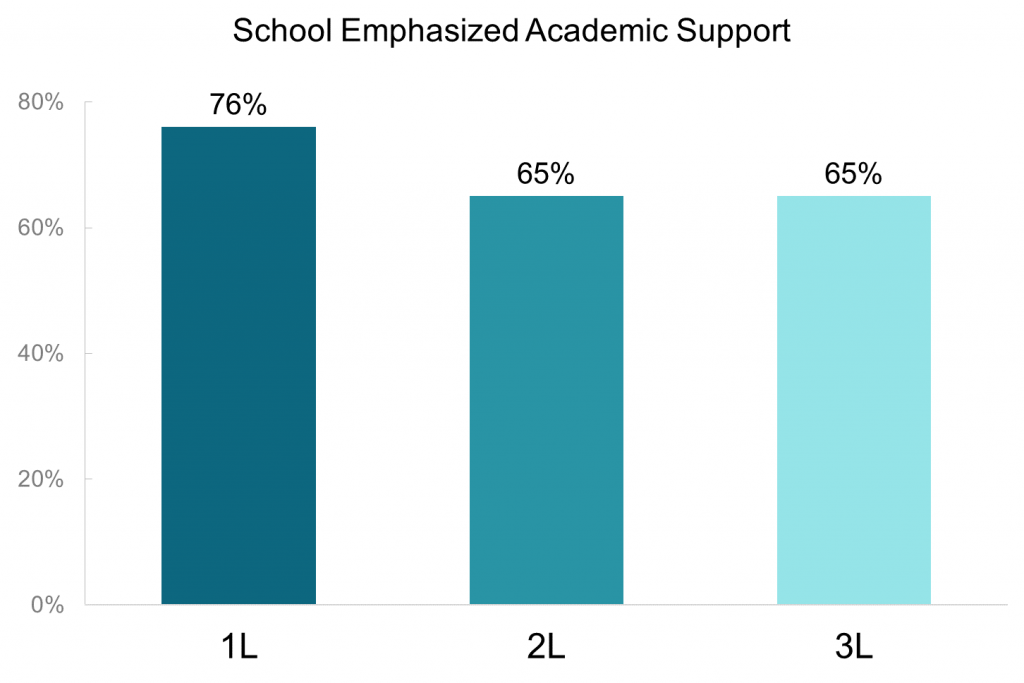
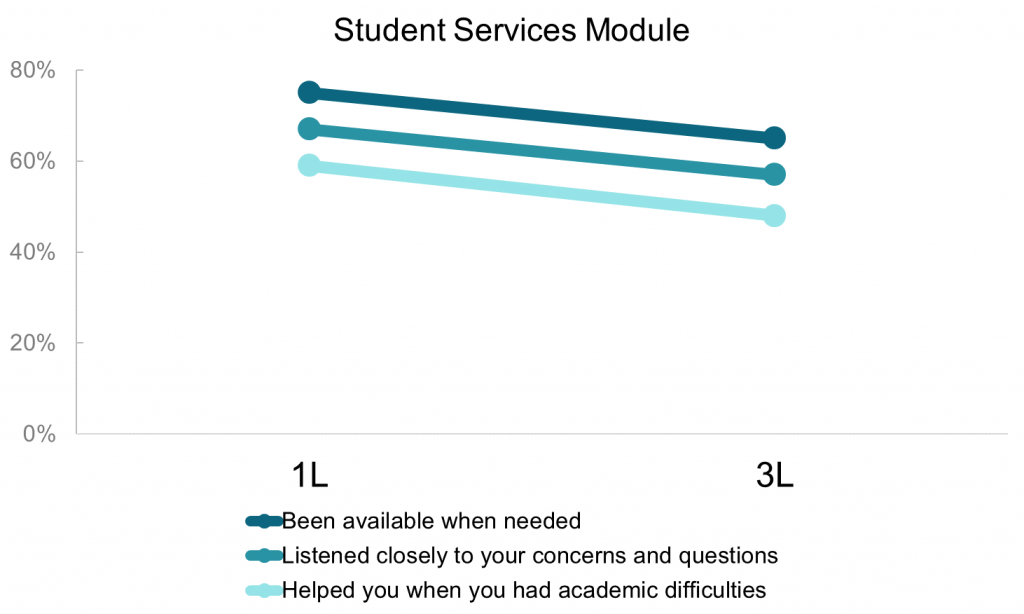
Interactions with academic support personnel drive whether a student would choose to attend the same law school again as well as overall satisfaction with their law school experience. Though students report positive relationships with administrative staff, satisfaction with advising services is less consistent and more varied across race/ethnicity, year in school, and gender. Sixty-nine percent of all respondents report that their law school provides the support they need to succeed academically, with higher perceptions of support among 1L students. Similarly, academic advising, career counseling, and job search help are key support services that students appreciate greatly when they begin law school, though they are more dissatisfied as graduation nears.

Annual Results 2018: Relationships Matter - Student-Faculty Interaction
Faculty, administrators, and classmates are key ingredients to law student success. These relationships serve as important ties to the law school and impact student satisfaction, sense of belonging, and academic and professional development. This year’s annual report explores relationships and examines the nuances of the impact they have on law students.
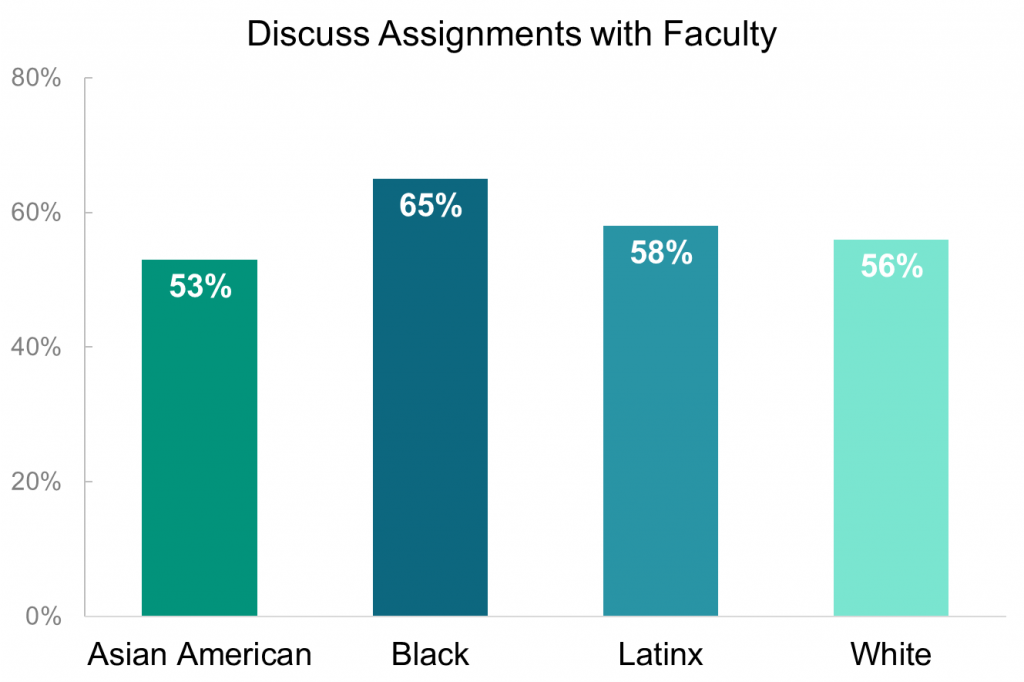
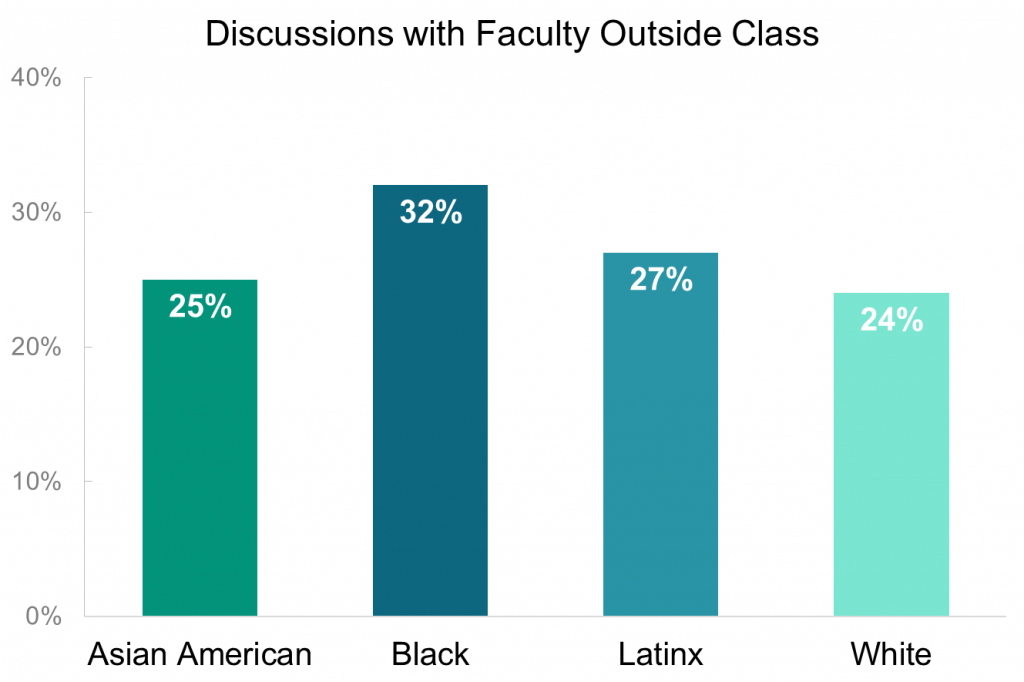
The vast majority of students (76%) report positive relationships with faculty, including interactions both in and out of the classroom. Meaningful interactions vary across student demographics, with notable race/ethnic differences. On multiple dimensions Black and Latinx students report more engagement and interaction with faculty than white and Asian American students. For instance, while a majority of all law students (57%) discuss assignments with faculty “often” or “very often,” 65% of Black students do so, the highest of any racial or ethnic group, followed by 58% of Latinx students, 56% of white students and 53% of Asian American students.
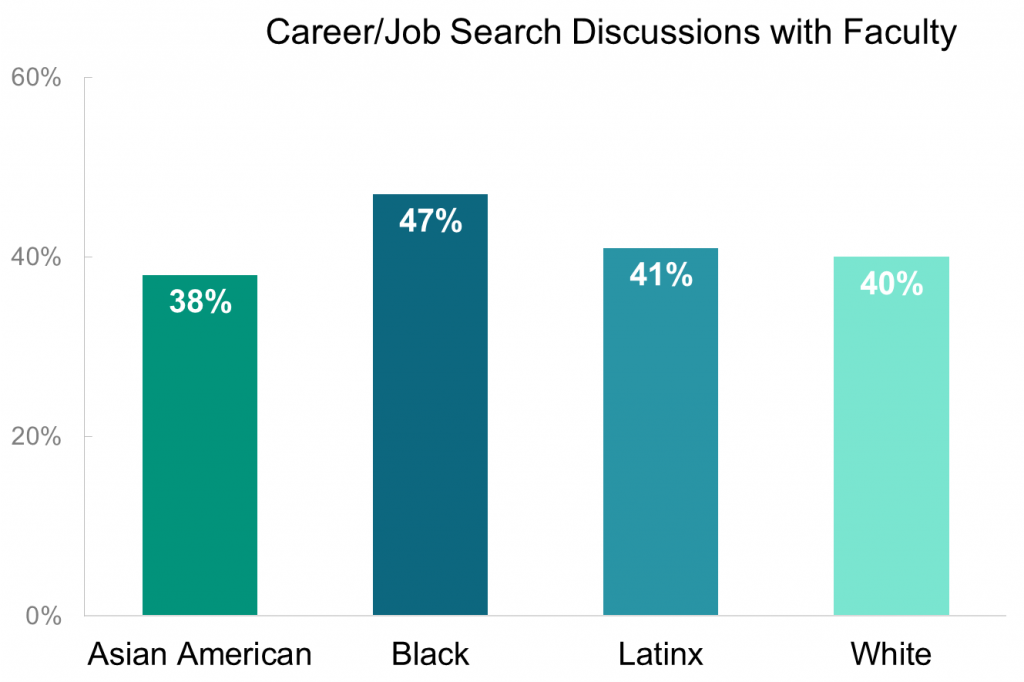
The pattern of Black and Latinx students enjoying higher rates of engagement with faculty persists across multiple dimensions. For example, Black students (47%) are more likely to discuss career or job search with faculty than Latinx (41%), white (40%), or Asian American (38%) students. Black and Latinx students are also more likely to talk with faculty outside of class. The vast majority of students find faculty available, helpful, and sympathetic. Interestingly, this sentiment does not directly track interaction with faculty, as a higher percentage of white students report favorable relationships with faculty than Black and Latinx students.
Preferences & Expectations for Employment After Law School by Race and Ethnicity
The newly released LSSSE 2017 Annual Results explore the relationship between students’ preferred and expected work settings post-graduation. Our most recent post in this series shared some general observations about the matches (and mismatches) between preferred and expected settings. In this post, we will share some insights into how these preferences and expectations are related to race and ethnicity.
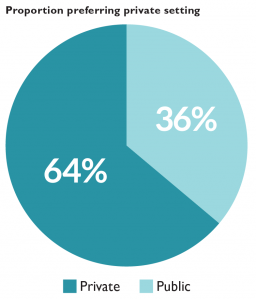
Overall, 64% of respondents prefer to work in the private sector. Almost 70% of Asian American respondents state a preference for working in a private setting, the largest proportion among the four racial and ethnic groups analyzed. Black respondents are most likely to prefer public service settings.
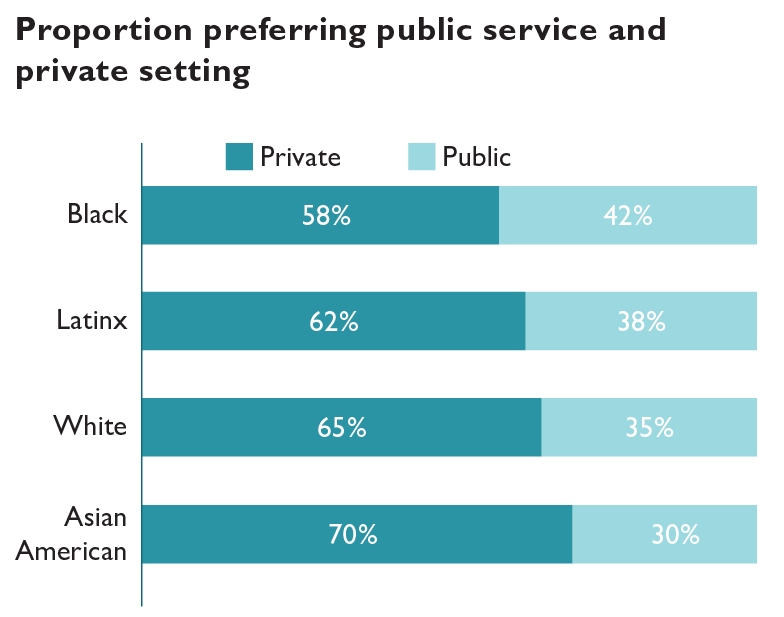
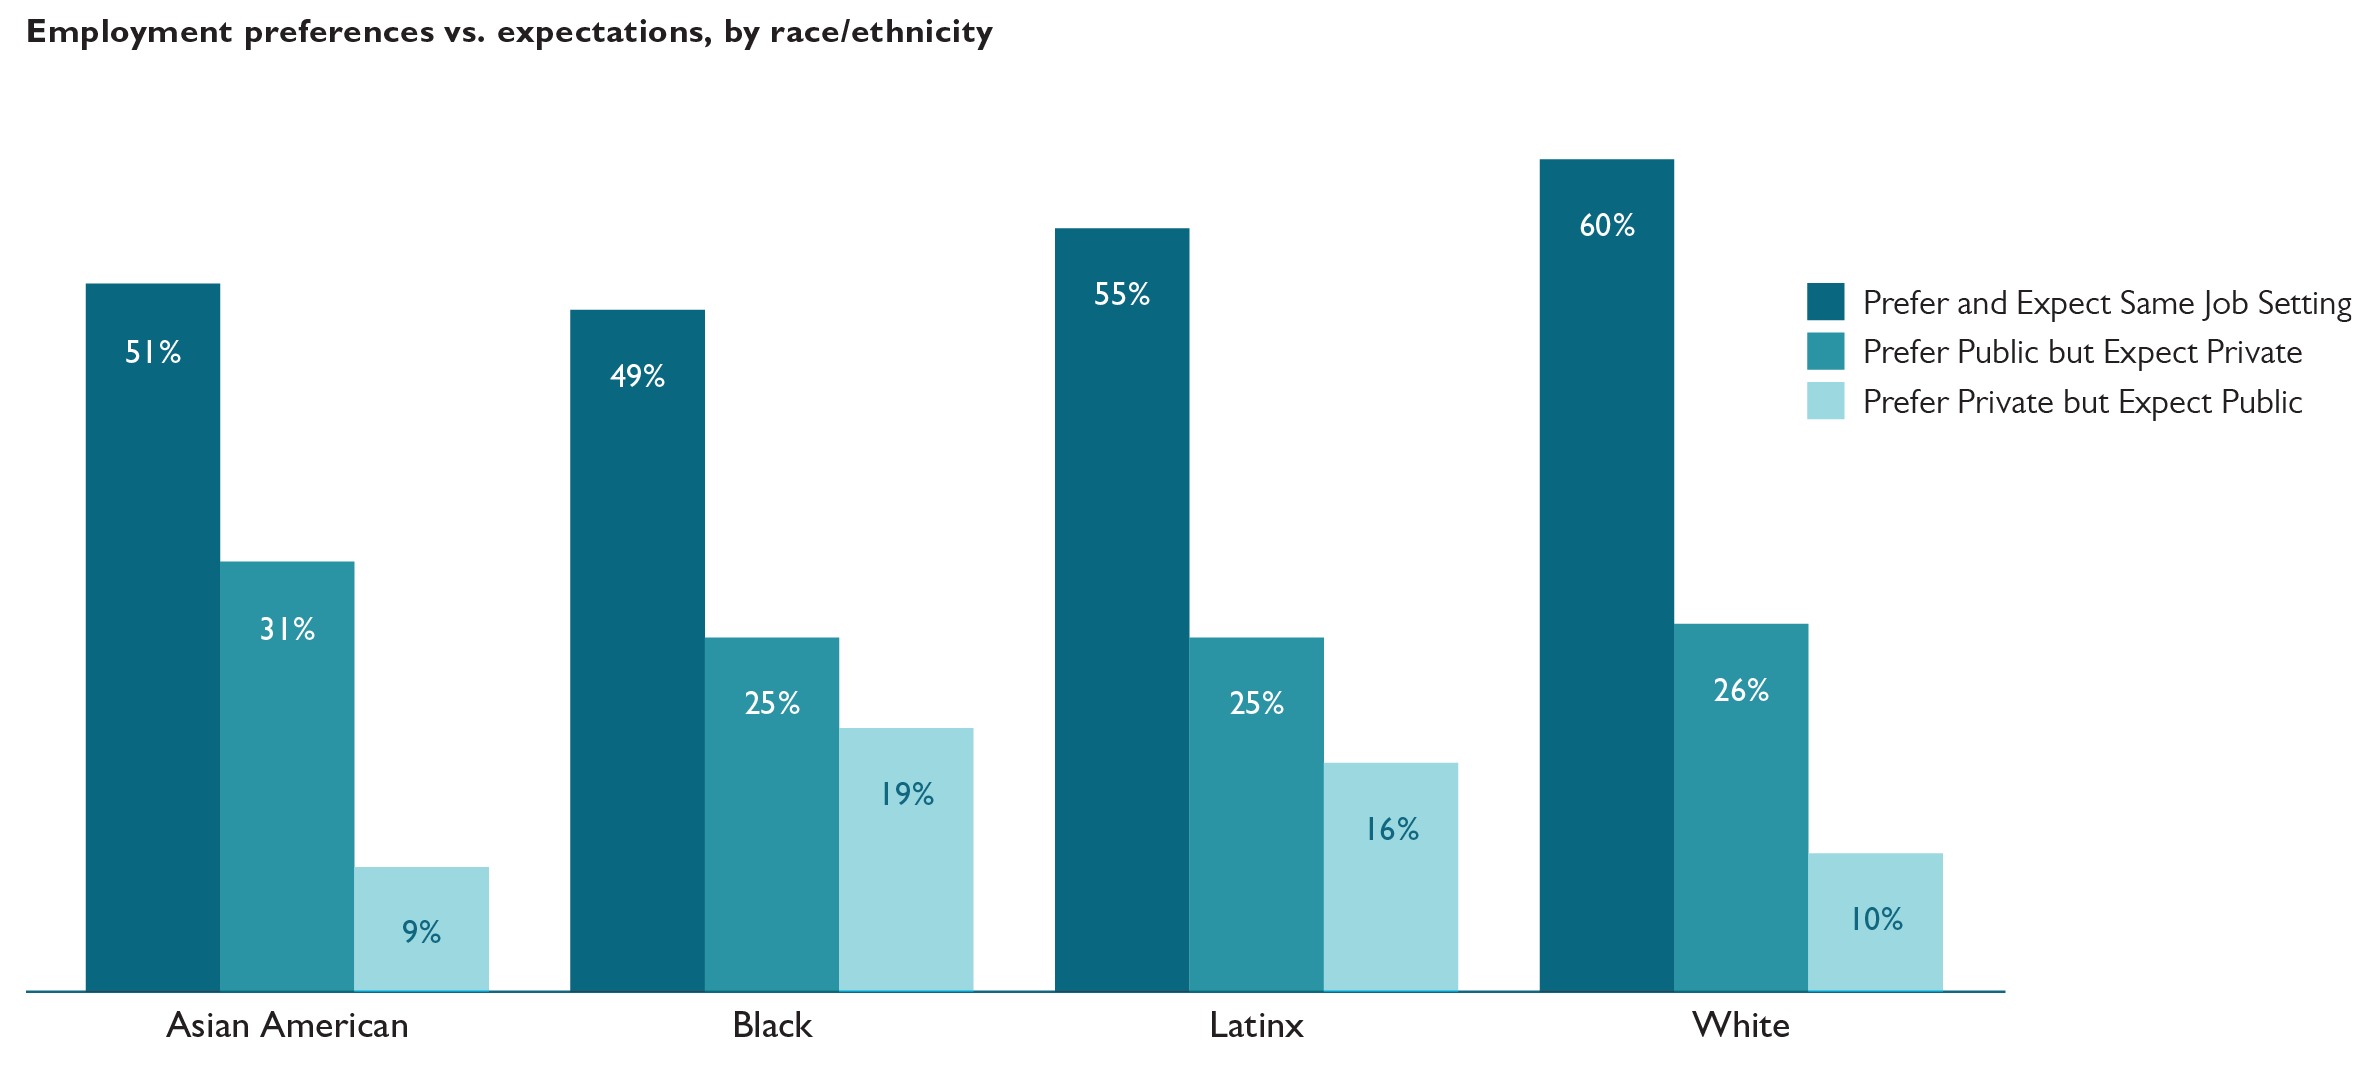
Black respondents are least likely to prefer and expect to work in the same individual setting, with less than half doing so, whereas White respondents (at 60%) are most likely. The proportion of respondents expecting to work in private settings increases among Asian American and White respondents, when compared to their preferences. Seventy-three percent of Asian American respondents expect to work in private settings, compared to 70% preferring to do so. Among White respondents, the proportion who expect to work in private settings is 68% compared to the 65% who prefer it. These two sets of proportions remain largely the same among Black and Latinx respondents.
Almost one-third of Asian American respondents who prefer public service settings expect to work in private settings, the highest proportion among all the racial and ethnic groups. Black respondents are most likely to prefer private settings but expect to work in public service.

Trends in Preferences & Expectations for Employment After Law School
The newly released LSSSE 2017 Annual Results explore the relationship between students’ preferred and expected work settings post-graduation. In a series of related blog posts, we will share tidbits of information about where law students hope to work, where they expect to work, and how these preferences and expectations vary by race and gender. In our final post, we will look at patterns in students’ preferred and expected work settings relative to their projected levels of student loan debt.
LSSSE asks respondents to identify the setting in which they would most prefer to work after graduation and the setting in which they most expect to work. Preferences can be seen as representing a respondent’s ideal outcome; expectations can be seen as representing perceptions of a realistic outcome. For both questions, respondents are asked to choose between sixteen answer options.
For purposes of much of the analyses in this report, the answer options were divided into two broad groups:
Public Service Settings
- Academic
- Government agency
- Judicial clerkship
- Legislative office
- Military
- Prosecutor’s office
- Public defender’s office
- Public interest group
Private Settings
- Accounting firm
- Business and industry
- Nonlegal organization
- Private firm – small (fewer than 10 attorneys)
- Private firm – medium (10-50 attorneys)
- Private firm – large (more than 50 attorneys)
- Solo practice
The “Other” response was removed from our analysis. The primary factor underlying the assignment of an answer option to one of the two groupings was whether a person working in that setting would likely qualify for Public Service Loan Forgiveness (PSLF), which typically requires one to be employed in the government or non-profit sector. There is naturally some imprecision in the assignments.
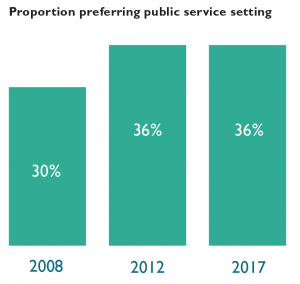
Sixty-four percent of respondents indicate a preference for working in one of the private settings, with the remaining 36% preferring public service. This proportion is unchanged from five survey administrations ago (2012) and higher than the 30% public service proportion ten administrations ago (2008).
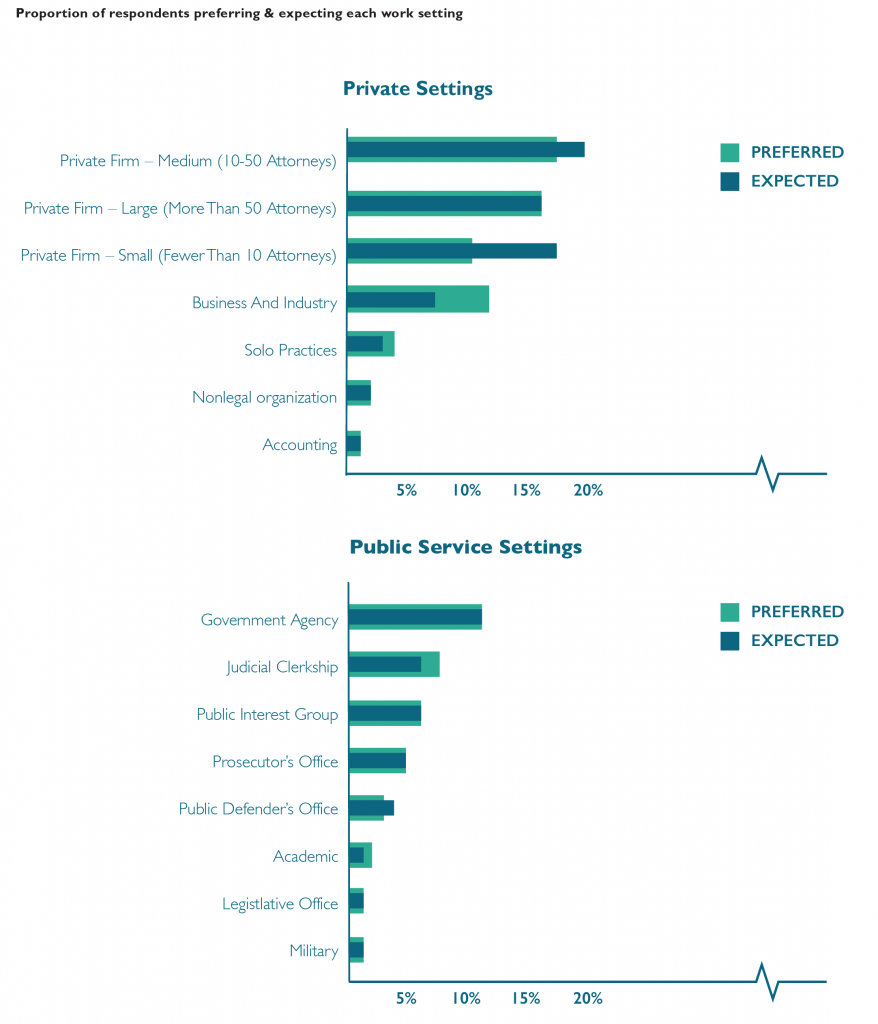
Seventeen percent of respondents would prefer to work in medium-sized law firms, making this category the most popular private setting and the most popular setting overall. Government agencies are the most popular public setting, with 11% of respondents indicating that preference. Medium-sized law firms are also the most commonly expected private work setting, accounting for 20% of respondents. Small law firms are the fourth most preferred private setting yet the second most common expected setting. Government agencies are the most commonly expected public service setting.
Forty-four percent of respondents indicate a different expected work setting than their preferred setting. Respondents who prefer to work in an academic setting are least likely to expect to work in that setting, with only about one-in-five matching preference with expectation. Respondents who prefer to work in large law firms or as prosecutors are most likely to also expect to work in those settings.
Forty-six percent of respondents who prefer one of the public service settings expect to work in a non-preferred setting, including one-quarter who expect to work in private settings instead. Forty-one percent of respondents who prefer one of the private settings expect to work in a different setting, but only 12% of students who prefer to work in a private setting expect to work in public service instead.

LSSSE Demographic Characteristics Reflect the U.S. Law Student Population
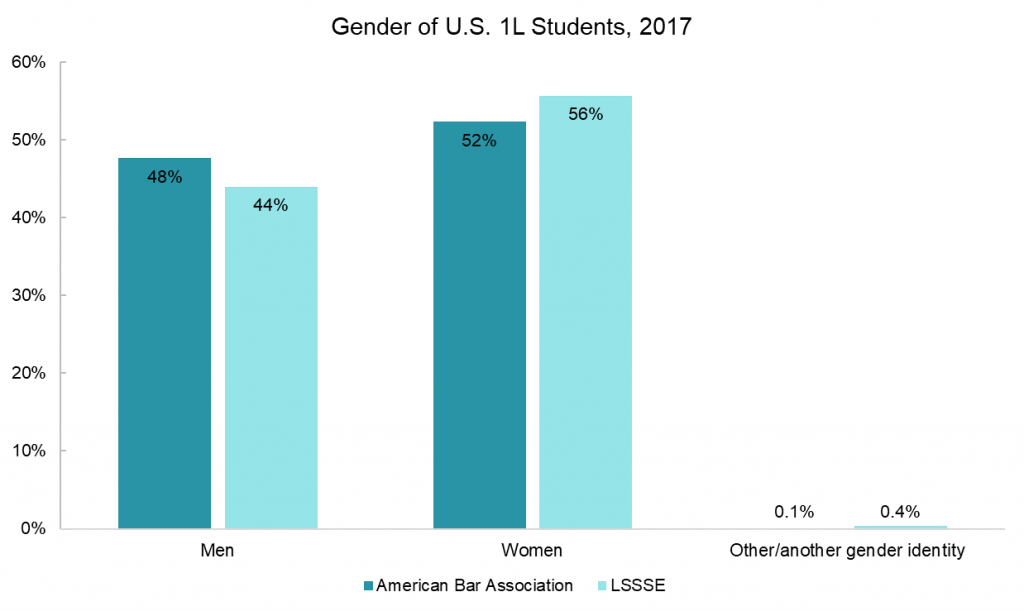
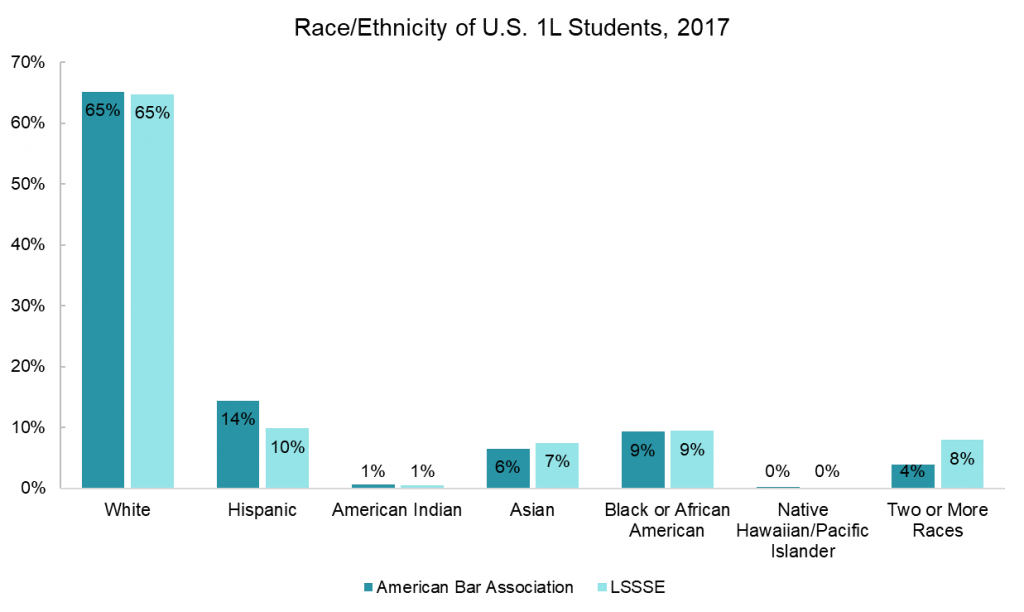
The Law School Survey of Student Engagement (LSSSE) provides a treasure trove of information about the law school experience from the perspective of law students themselves. LSSSE partners with legal education scholars to provide access to de-identified data about topics ranging from student satisfaction to time usage to personal and professional development. Many researchers – particularly those interested in questions of diversity and equity – are interested in how closely the students surveyed by LSSSE reflect the gender and racial/ethnic composition of the entire law school population. To answer this question, we compared the self-reported gender and race of 2017 U.S. 1L LSSSE respondents to the 2017 matriculant gender and race/ethnicity aggregate data available from the American Bar Association (ABA).
The ABA reported that slightly more women than men enroll in law school (52% vs. 48%). U.S. 1L LSSSE respondents in 2017 were similarly more likely to be female than male (56% vs. 44%). Although both the ABA and LSSSE collected data students identifying as “Other” (ABA) and “Another gender identity” (LSSSE), these individuals make up only a tiny fraction of the law student population (24 people according to the ABA and 22 people who responded to LSSSE).
The 1L students who responded to LSSSE in 2017 were also quite similar to the overall population of 1L students at all ABA-accredited programs in terms of racial/ethnic makeup. Sixty-five percent of both groups were white, nine percent were black or African-American, and around six percent were Asian or Asian-American. The ABA reported a slightly higher proportion of Hispanic students (14%) compared to the proportion of Hispanic LSSSE respondents (10%), and LSSSE respondents were more likely than the population of 1L students at ABA-accredited law schools to be multiracial (8% vs. 4%). However, the overall pattern of race/ethnicity frequency is quite similar among the two populations. Thus, LSSSE respondents tend to represent the demographic characteristics of law students in general.
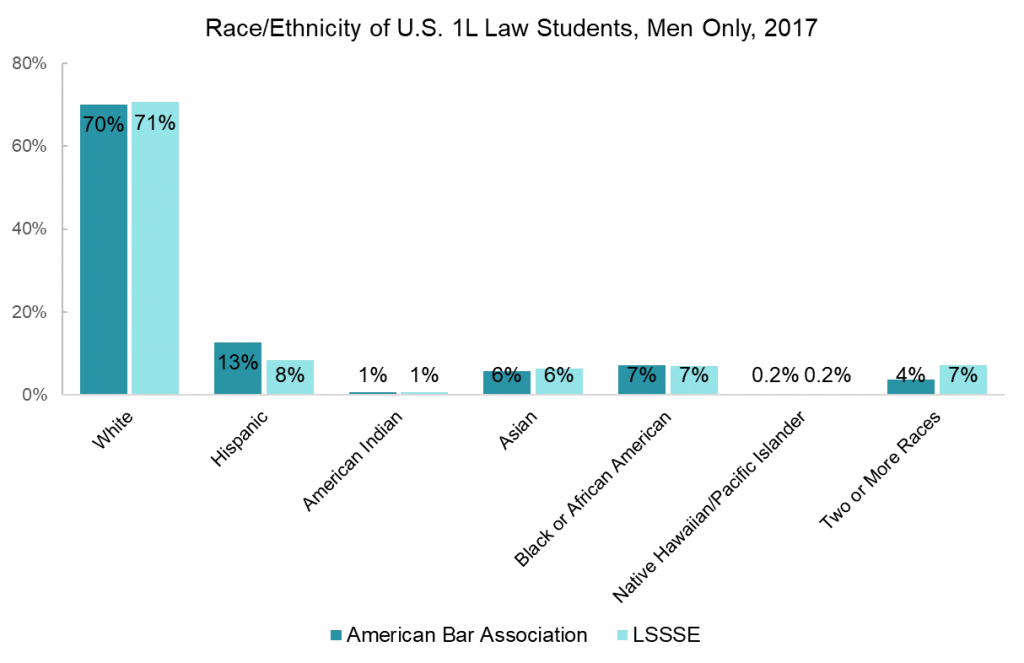
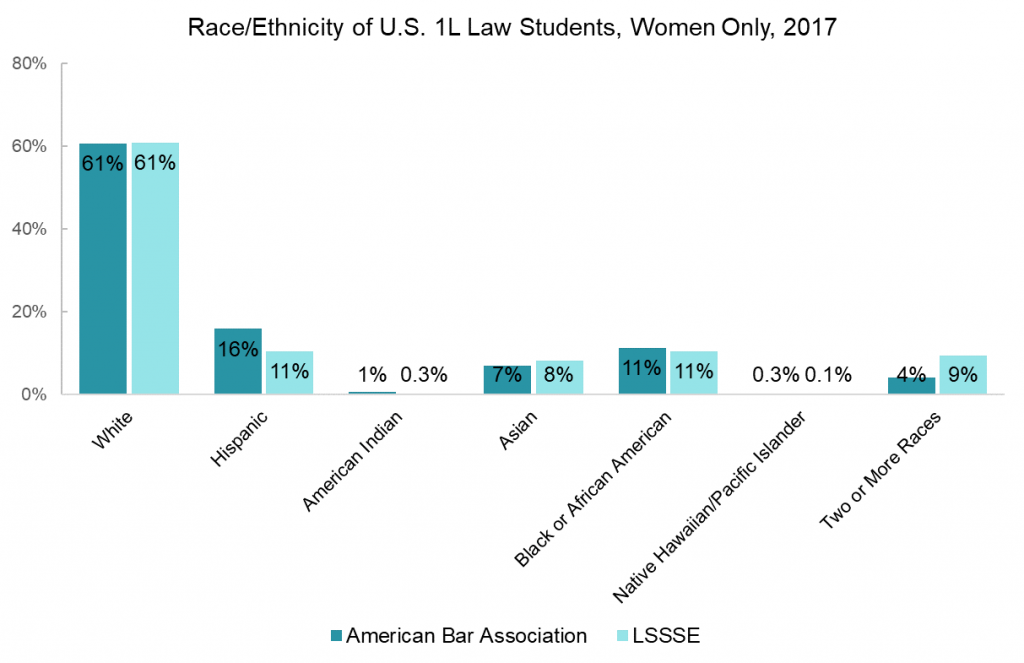
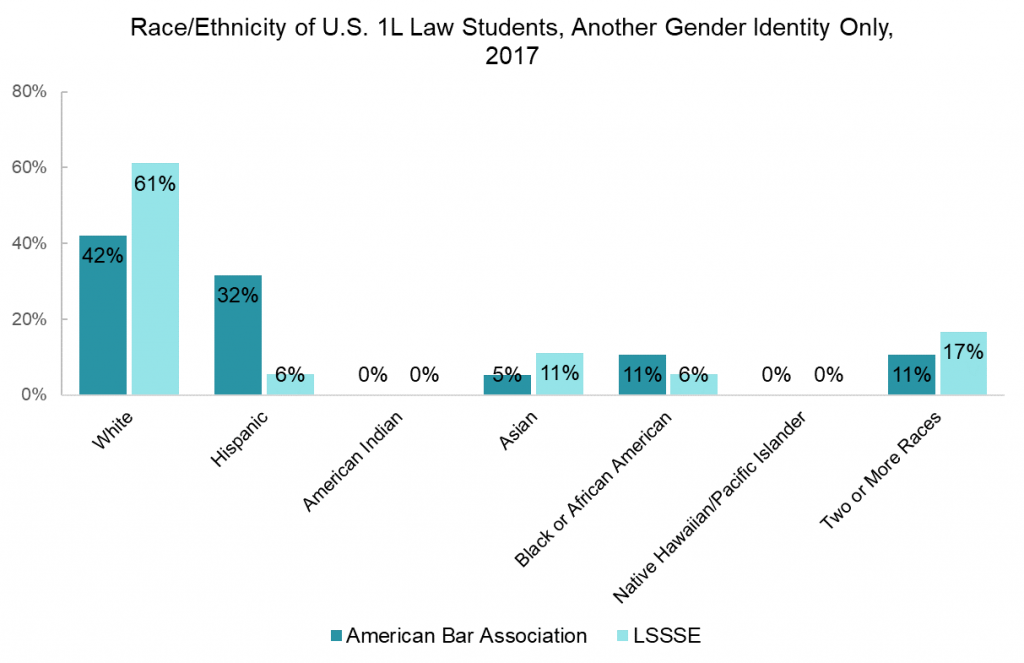
The ABA and LSSSE datasets also allow us to examine the intersection of gender and race/ethnicity among 1L students. Interestingly, a higher proportion of male law students than female students are white (70% vs. 61%). The general trends regarding the proportions of students from different racial and ethnic groups described across all students hold true for men and women when examined separately, but the same cannot be said for students of other gender identities, likely because this group is so small.
In the aggregate, LSSSE offers a representative sample of law students in terms of both race/ethnicity and gender identity, making it a great source of information about student engagement and the law school experience. Check out some of the publications using LSSSE research or contact us to discuss how a LSSSE data-sharing agreement might enhance your legal education research project.