The LLM Experience
For the first time this year, we invited LLM (Master of Laws) students at American law schools to participate in LSSSE alongside their JD colleagues. To our knowledge, this is the first national empirical survey of LLM students. Here we present a few initial findings about this unique group of students.
Basic Demographics
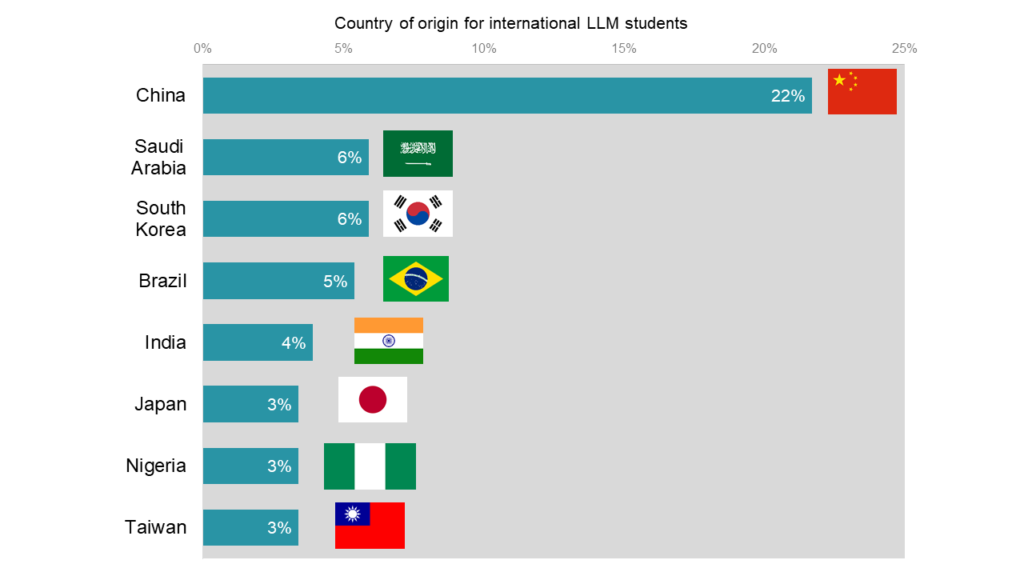
International students make up 79% of LLM students at American law schools. Among students born in other countries, the most common nation of origin is China, which is the home of 22% of international LLM students. The next three most common home countries are Saudi Arabia, South Korea, and Brazil, which each account for around six percent of the LLM international student population.
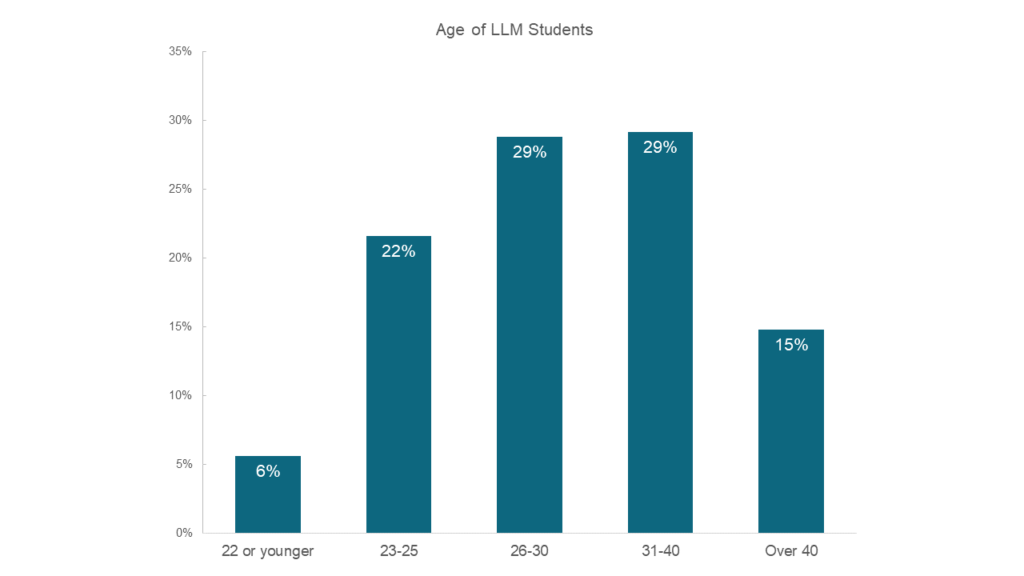
Because a JD degree or international equivalent is required for admittance to LLM programs, most LLM students are somewhat older than the typical law student. The majority (58%) of LLM students are between the ages of 26 and 40. Fifteen percent are over 40 and 28% are 25 or younger. LLM students are somewhat more likely to be women, which is in keeping with current trends toward slightly more female law students than male law students.
Satisfaction
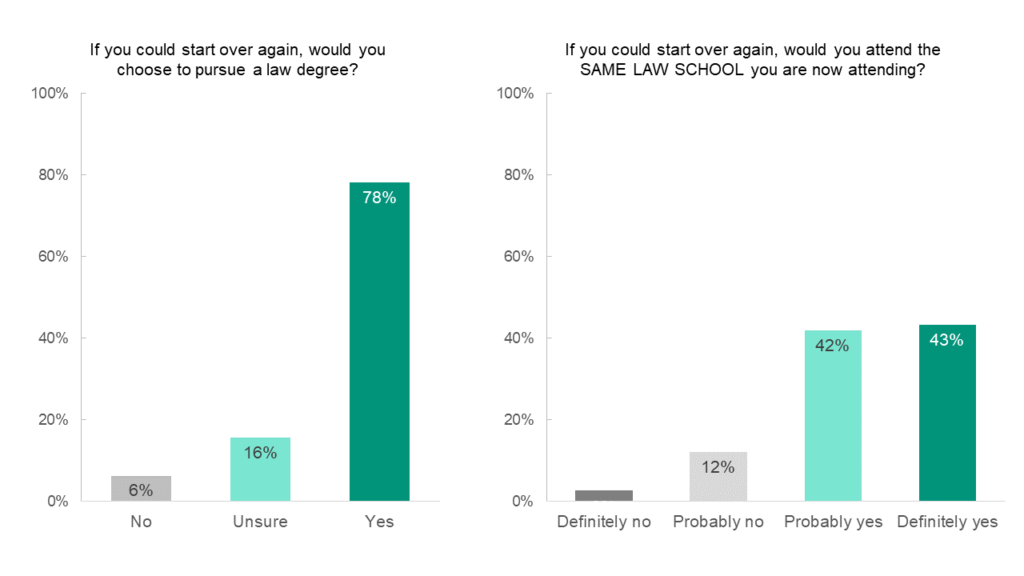
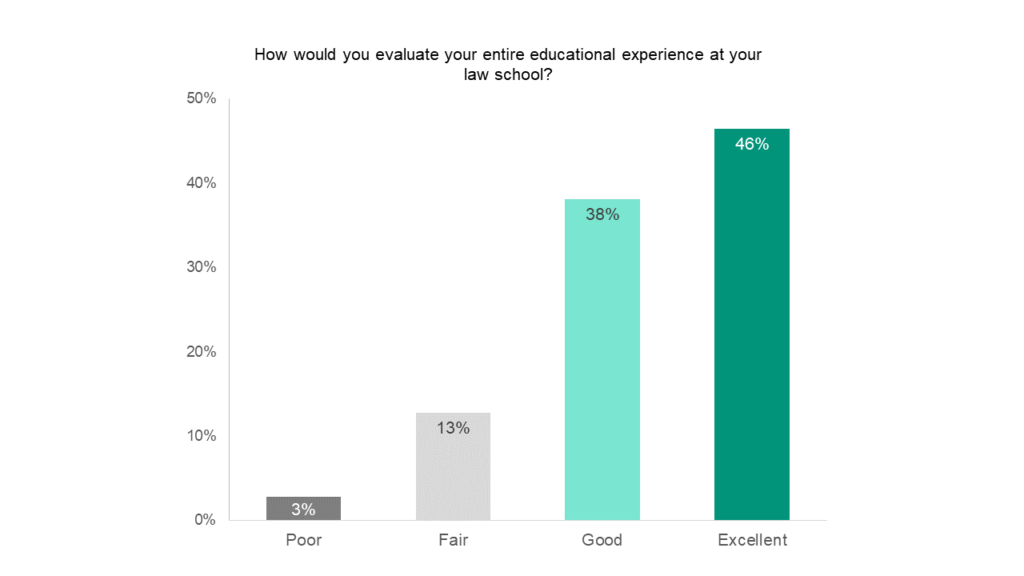
In general, LLM students are satisfied with their law school experience. If given the chance to start over, most (78%) would choose to pursue a law degree and most (85%) would probably or definitely attend the same law school they are now attending. Nearly half (46%) rate their experiences as excellent, and another 38% rate their overall experience as good. Only 3% of LLM students describe having a poor experience. These data suggest that LLM students see their current degree program as a good investment. Future LSSSE reports will delve deeper into how LLM students engage with the law school experience and how satisfied they are with specific features of their programs.

Law Library Usage and Satisfaction
Learning to find, analyze, and use high-quality legal information is a core goal of a legal education. The main LSSSE survey gathers information about student satisfaction with library services while the optional Law Library module provides a wealth of details about how students interact with library resources as they develop information literacy skills. Here we will provide a small sample of survey results focusing on which library functions students use and how satisfied they are with core library teaching functions.
Teaching Functions
The first section of the library module asks students about three key library teaching functions:
- Legal research classes/presentations/programs the Library staff has held
- Interactions with librarians where legal research skills are addressed (at the reference desk, individual meetings, and virtual reference)
- Research guides compiled by Library staff to assist students in legal research
Students are asked about their experiences with these three functions of their law libraries by selecting one of the following options:
- Very unsatisfied
- Unsatisfied
- Satisfied
- Very satisfied
- Unsure whether my law library offers this service
- Not used but aware of service
This format allows us to measure not only satisfaction with each service but also how many students use the service or are at least aware it exists.
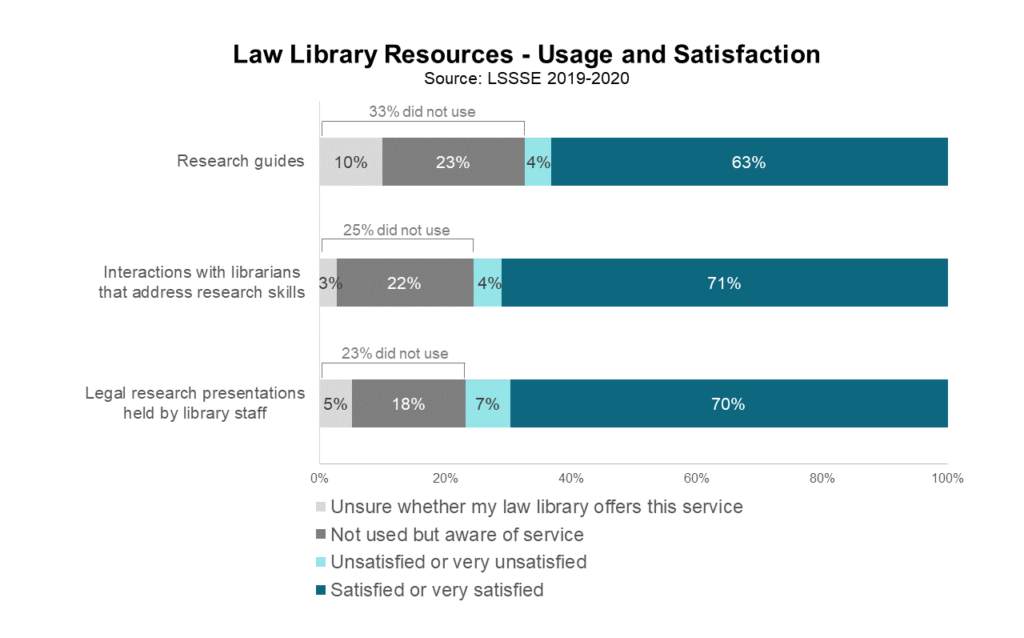
Legal research presentations held by library staff are the most used resource, with only 23% of students saying they either had not used them or were unsure whether they were offered at their library. Students are largely satisfied with these presentations, with about ten satisfied students for every dissatisfied one. Students are even more satisfied with interactions with librarians that addressed legal research skills: 75% of students had these interactions, and among those students, 94% were satisfied or very satisfied with the interaction. Of the students who had not had an interaction with a librarian that addressed research skills, most are at least aware that this service exists at their law school. Research guides were the least used library resource. A full third of students had not used research guides during the school year, with about ten percent of students unsure whether their library even offered this service. Again, however, students who had used research guides are overwhelmingly satisfied with them.
Usage Rates
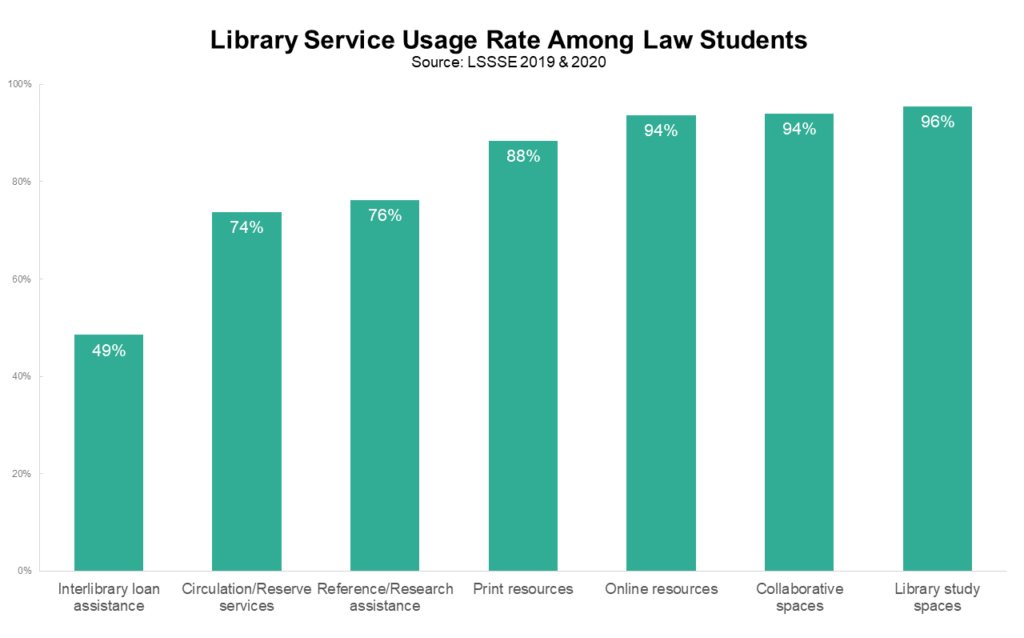
Though many university libraries have reduced their physical presence in favor of more virtual offerings, law libraries remain a notable exception, likely due to the intense reading loads of their student patrons. A full 96% of LSSSE respondents have used their law library as a study space in the past year, and 94% have used their law library’s collaborative spaces. Nearly all law students (94%) used online resources, and another 88% used print resources. About three-quarters of students received reference assistance and used circulation services, and about half asked for interlibrary loan assistance. Thus, overall usage rates of law library resources are quite high.
Satisfaction
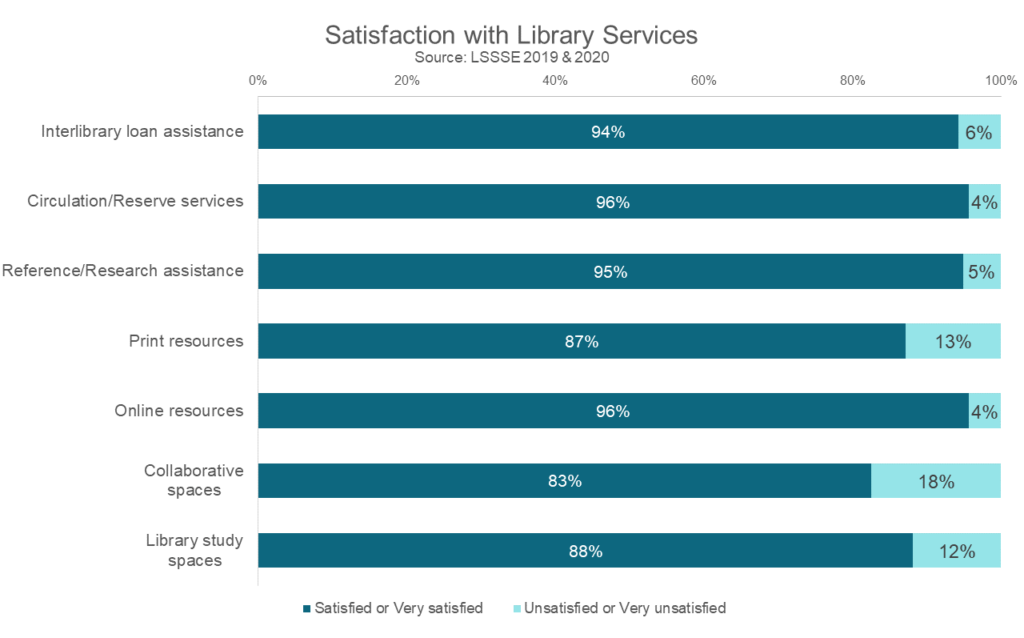
Among students who used each service, satisfaction is generally high. The services that involve personal interactions are most highly rated; around 95% of respondents who used interlibrary loan, circulation/reserve, and reference assistance were satisfied or very satisfied. Students were somewhat less satisfied with their law library’s physical spaces, with around 18% of students expressing dissatisfaction with the library’s collaborative spaces and around 12% of students expressing similar negative opinions about their library’s study spaces. Students are more likely to be satisfied with online resources (96%) than with print resources (87%).
LSSSE results strongly suggest that law libraries are crucial to the law school experience. Nearly all students had used their law library in the previous year, and law students were generally quite satisfied with the core services they found there. Most students were pleased by their interactions with library staff and resources, although some students desired changes to their library’s collaborative spaces and study spaces. This suggests that law schools could invest somewhat more in physical aspects of the law library, rather than online ones, to increase student satisfaction. It will be interesting to see whether students interact with their physical and virtual law libraries in different ways during this odd year of social distancing and remote learning. Stay tuned for LSSSE 2021 results.

LSSSE Annual Results 2019: The Cost of Women’s Success (Part 1)
The past two decades have seen increasing numbers of women in law schools. After graduating from law school, women lawyers enjoy greater opportunities for financial independence, security of employment, and a potential for leadership facilitated by the J.D. degree. Yet, gender inequities in pay and position continue to plague the legal profession. In spite of this conundrum, there has been little scholarly attention given to the experience of women while in law school.
The 2019 LSSSE Annual Results celebrate women. We investigate the successes of women law students—using objective and subjective measures to reveal various accomplishments. We also interrogate their backgrounds and the context for their enrollment in law school, revealing challenges women overcome and the sacrifices they make to succeed. This Report not only shares findings on women as a whole, but also features comparisons by gender and race/ethnicity, providing greater depth and context to the overall experience of women law students. Our findings make clear that women’s success comes at great personal and financial cost. Greater awareness of these challenges provides both an imperative and an opportunity for administrators, institutions, and leaders in legal education to invest more deeply in the success of women.
The Good News
Women are succeeding in legal education along numerous metrics. When considering overall satisfaction rates, roughly equal percentages of women (81%) and men (83%) report that their entire experience in law school has been either “Good” or “Excellent.” In spite of generally high marks for all groups, there are notable differences by race/ethnicity. While the vast majority (75%) of Black women characterize their overall experience as positive, these rates are lower than those of women who are Asian American (78%), Latina (78%), and White (84%).
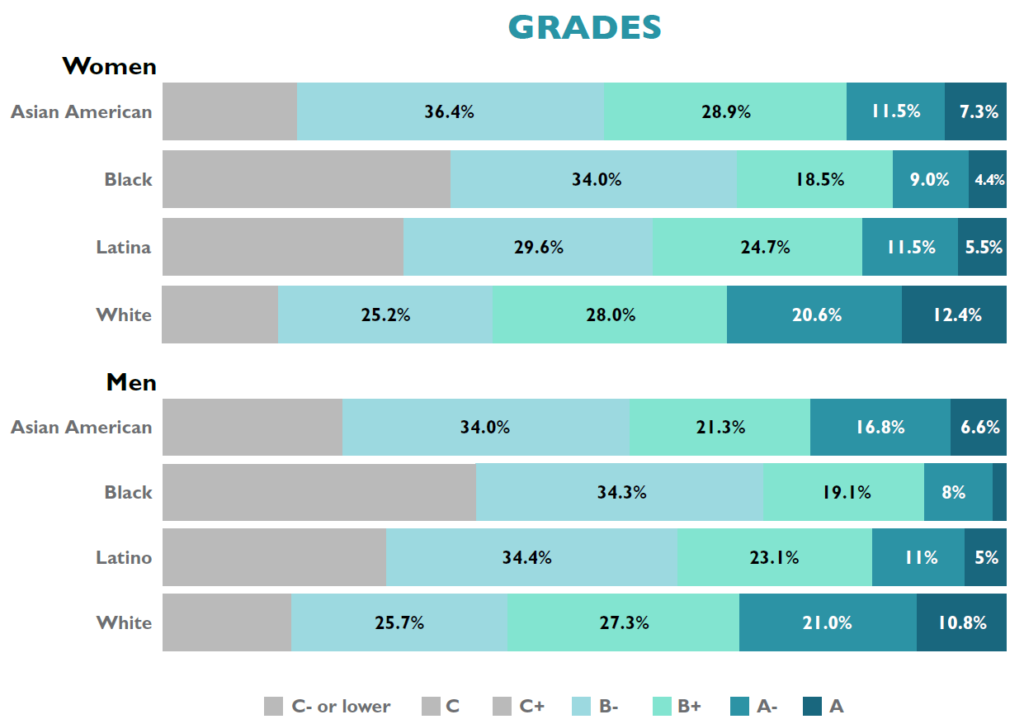
In addition to appreciating their law school experience, women are also excelling academically. Women’s self-reported law school grades are slightly higher than men’s. As one example 10.3% of women report earning mostly A grades in law school compared to 9.5% of men. There is important variation not only by race but also by the intersectional consideration of raceXgender. To start, 7.3% of Asian American women, 4.4% of Black women, and 5.5% of Latinas claim mostly A grades as compared to 12% of White women law students. Yet, when investigating grades within each racial/ethnic group by gender, women are nevertheless outperforming men.
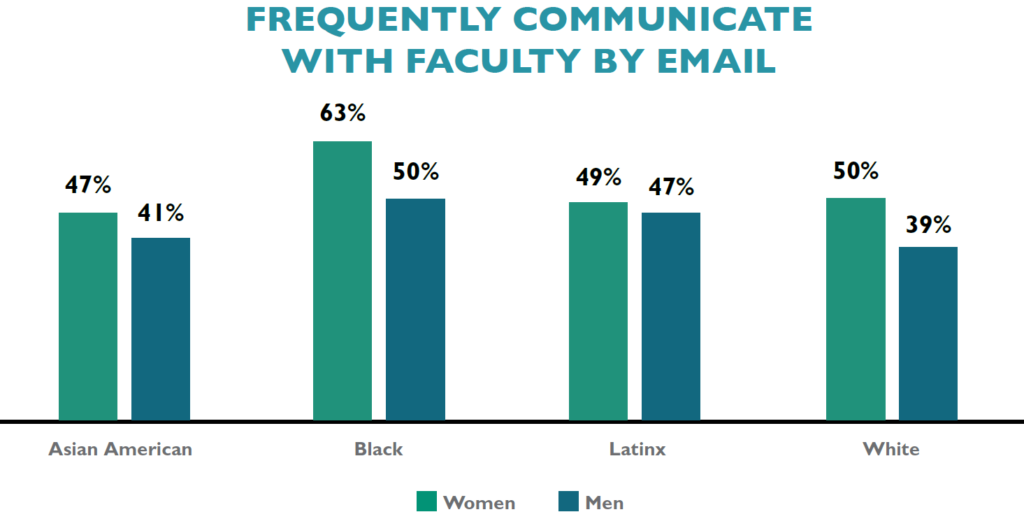
Additionally, women are adept at utilizing particular resources in law school, connecting with faculty and fellow students. Just over half (51%) of women use email to communicate with a faculty member “Very often” compared to only 40% of men. In fact, at 63%, Black women are more likely to engage in frequent email contact with faculty than any other raceXgender group. Women, regardless of their racial/ethnic background, are also more likely than men on average to engage in ongoing and frequent conversations with faculty and other advisors about career plans or job search activities. Women and men are also engaged in co-curricular activities at roughly equivalent rates, including the percentages participating in pro bono service, moot court, and law journals. A majority of students also enjoy positive interactions with classmates. A full 79% of men and 75% of women report the quality of their relationships with peers as a five or higher on a six-point scale. Furthermore, 65% of women rely on and invest in membership in law student organizations—which research has shown provide social, emotional, cultural, and intellectual support for many students. Black women (68%), Latinas (65%), Asian American women (60%), and White women (65%) join student groups at higher rates than men as a whole (53%).
Women are clearly engaged members of the law school community. Our next post in this series will discuss contextual differences between men and women before entering law school that suggest women are more likely to have to overcome obstacles to be successful. You can read the entire LSSSE 2019 Annual Results The Cost of Women’s Success (pdf) on our website.

Annual Results 2018: Relationships Matter - Student-Faculty Interaction
Faculty, administrators, and classmates are key ingredients to law student success. These relationships serve as important ties to the law school and impact student satisfaction, sense of belonging, and academic and professional development. This year’s annual report explores relationships and examines the nuances of the impact they have on law students.
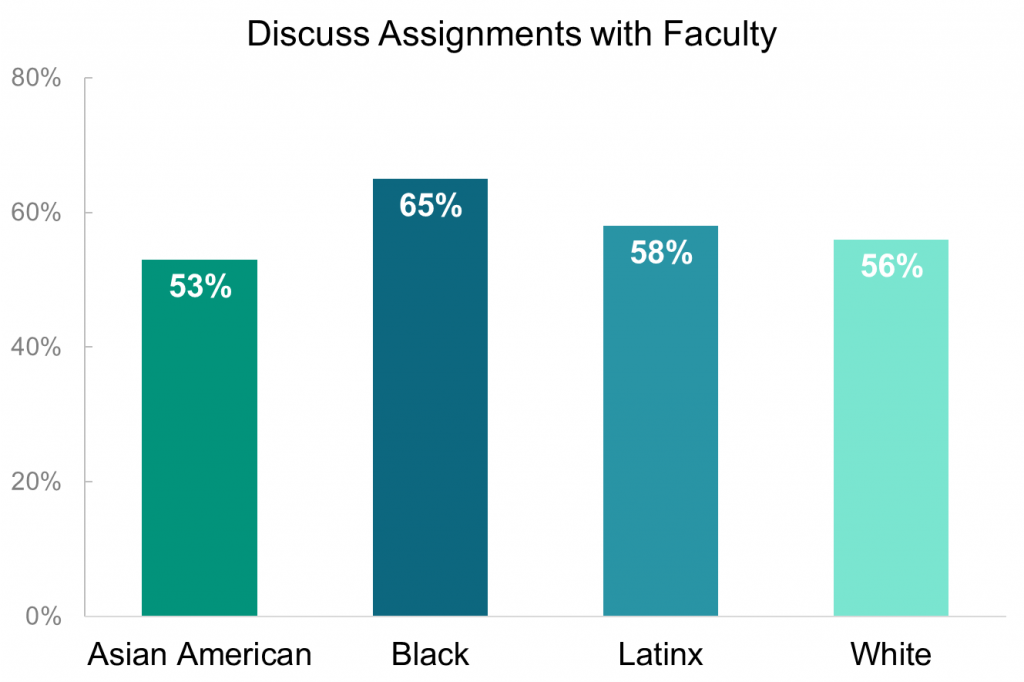
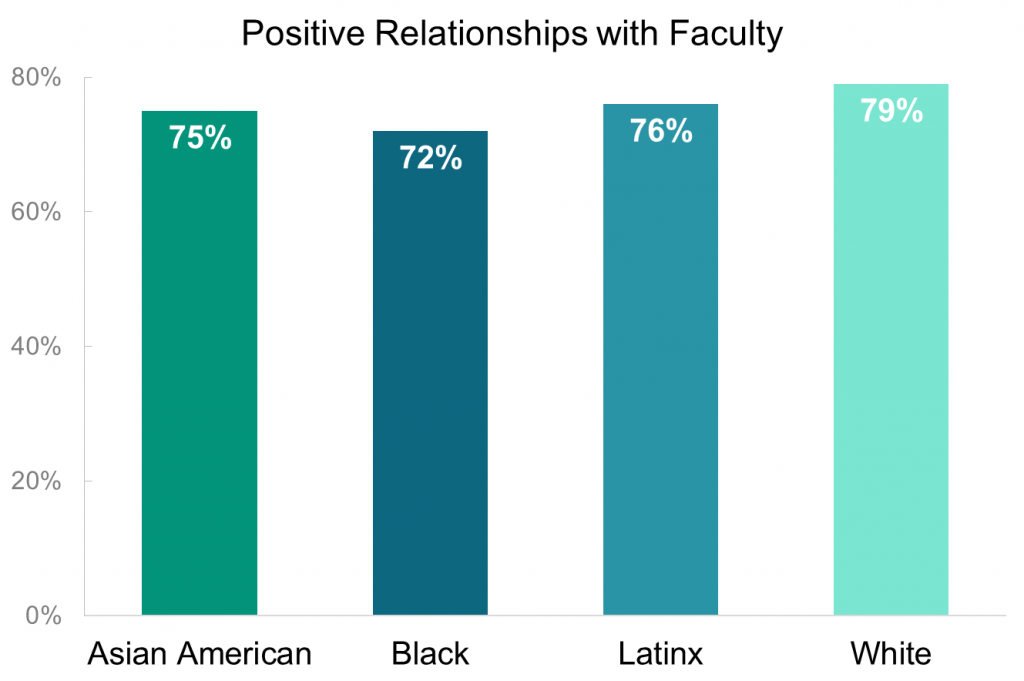
The vast majority of students (76%) report positive relationships with faculty, including interactions both in and out of the classroom. Meaningful interactions vary across student demographics, with notable race/ethnic differences. On multiple dimensions Black and Latinx students report more engagement and interaction with faculty than white and Asian American students. For instance, while a majority of all law students (57%) discuss assignments with faculty “often” or “very often,” 65% of Black students do so, the highest of any racial or ethnic group, followed by 58% of Latinx students, 56% of white students and 53% of Asian American students.
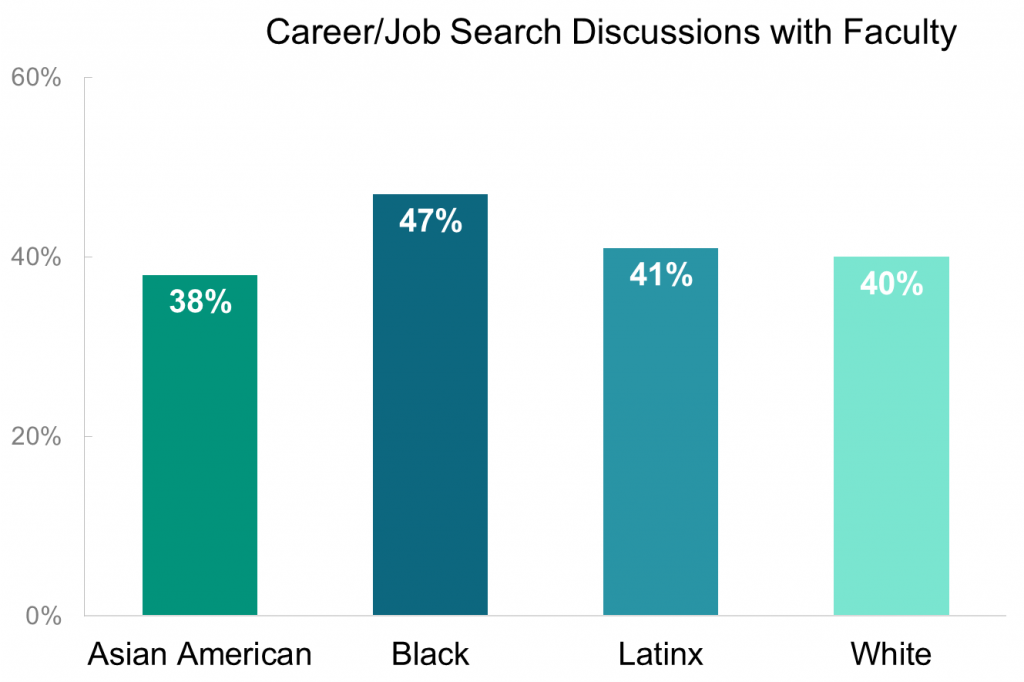
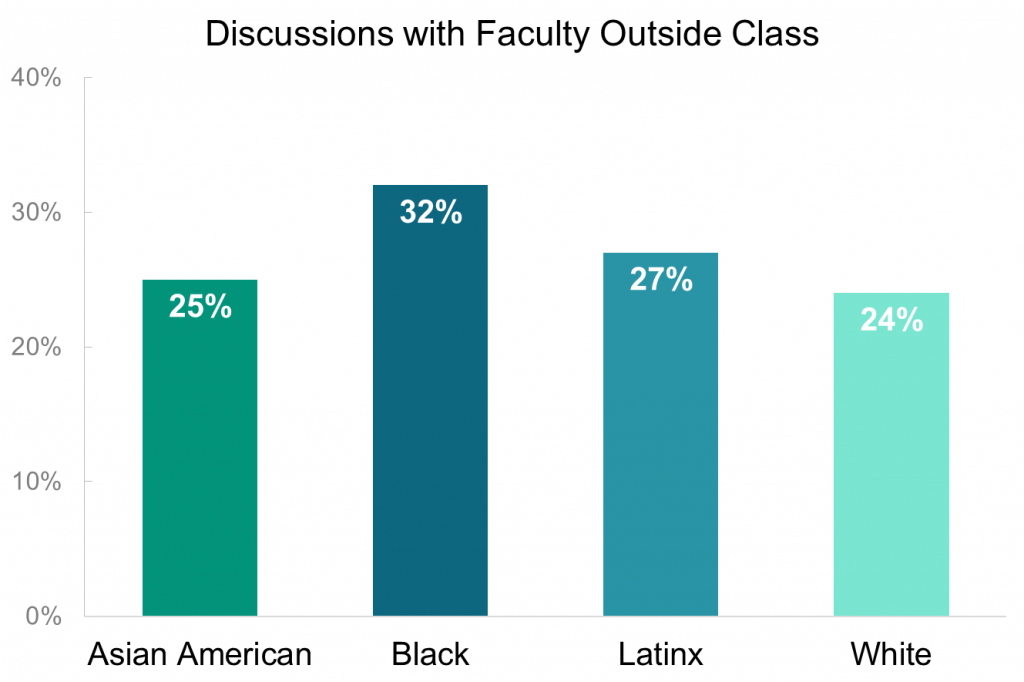
The pattern of Black and Latinx students enjoying higher rates of engagement with faculty persists across multiple dimensions. For example, Black students (47%) are more likely to discuss career or job search with faculty than Latinx (41%), white (40%), or Asian American (38%) students. Black and Latinx students are also more likely to talk with faculty outside of class. The vast majority of students find faculty available, helpful, and sympathetic. Interestingly, this sentiment does not directly track interaction with faculty, as a higher percentage of white students report favorable relationships with faculty than Black and Latinx students.

LSSSE Annual Results: Higher Debt, Lower Student Satisfaction (Part 2)
This is the sixth installment in a series of posts centered around data from the 2015 LSSSE Survey administration and the 2015 Annual Report, which provides a retrospective glimpse into law student debt trends over a 10-year period, 2006 to 2015, with 2011 as a midpoint. This post discusses student debt and the student satisfaction.
The LSSSE Survey is designed to measure the effects of legal education on law students. Student satisfaction is related to those effects; therefore, respondents are asked:
If you could start over again, would you go to the same law school you are now attending?
The purpose of this question is to, again, prompt respondents to consider and assess their law school experiences, but this time in the context of the opportunity costs. Respondents are given the following four answer choices:
- Definitely yes
- Probably yes
- Probably no
- Definitely no
In the analyses below, the favorable responses (Definitely yes and Probably yes) are combined, as are the unfavorable responses (Probably no and Definitely no).
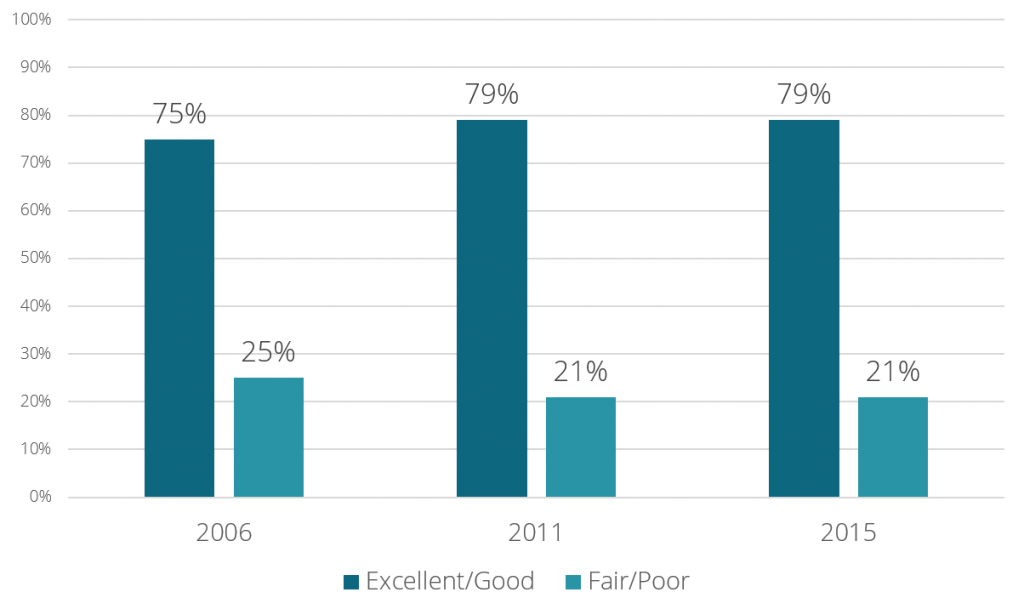
In each survey year, respondents who expected to owe more than $120,000 were noticeably less likely to respond favorably to the satisfaction questions. In 2006, 75% of these respondents had favorable views of their law school experiences, compared to the overall rate of 80%. Similar differences were observed in 2011 and 2015.
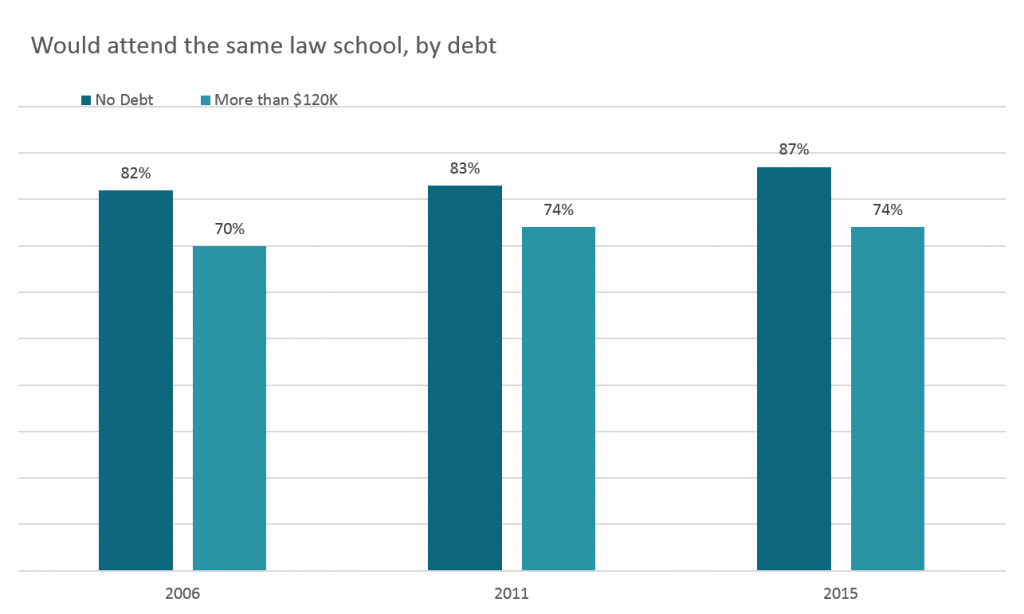
The effects of debt seemed even more apparent in the responses to the “same law school” question. With a few slight exceptions, in every survey year, respondents were less likely to state that they would attend the same law school as expected debt increased. At the level of more than $120,000 in expected the debt, 70% of respondents in 2006 said they would attend the same law school, compared to 82% of those who expected no debt. In 2011, the favorable response rate among these high-debt respondents was 74%, compared to 83% of those who expected no debt. And lastly, in 2015, 74% of these high-debt respondents stated they would attend the same school, compared to 87% of those expecting no debt. This 13-percentage point difference was the largest among the three survey years.

LSSSE Annual Results: Higher Debt, Lower Student Satisfaction (Part 1)
This is the fifth installment in a series of posts centered around data from the 2015 LSSSE Survey administration and the 2015 Annual Report, which provides a retrospective glimpse into law student debt trends over a 10-year period, 2006 to 2015, with 2011 as a midpoint. This post discusses student debt and the student experience.
The LSSSE Survey is designed to measure the effects of legal education on law students. Student satisfaction is related to those effects; therefore, respondents are asked:
How would you evaluate your entire educational experience at your law school?
The purpose of this question is to prompt respondents to consider and assess their law school experiences. This is, in essence, a question regarding satisfaction, a perceptional concept. As such, respondents are given the following four answer choices:
- Excellent
- Good
- Fair
- Poor
In the analyses below, the favorable responses (Excellent and Good) are combined, as are the unfavorable responses (Fair and Poor).
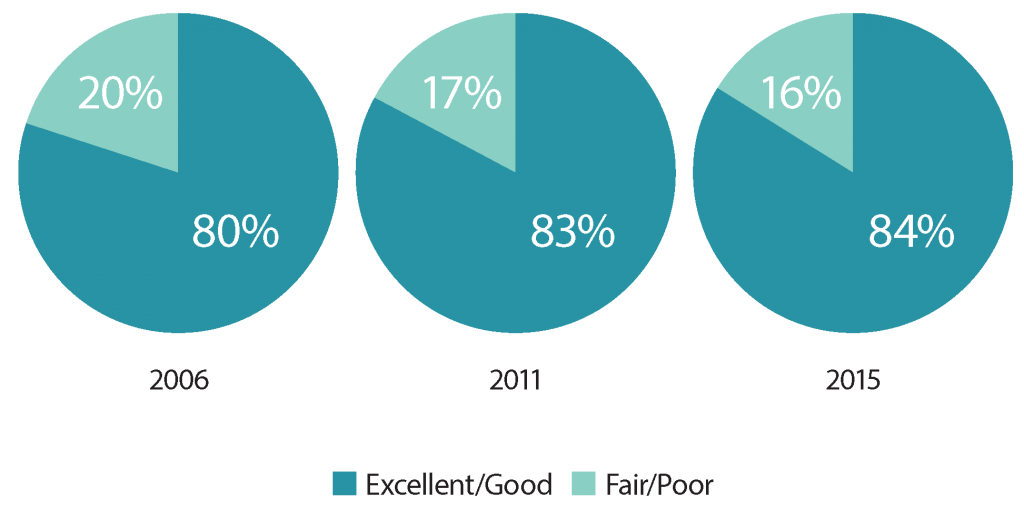
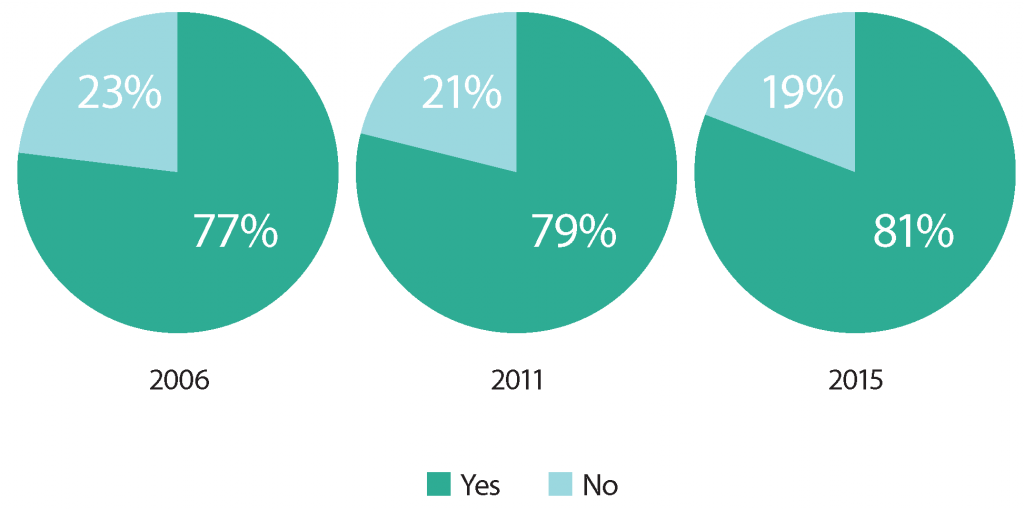
As a general proposition, LSSSE respondents reported high levels of satisfaction with their law school experience in each of the survey years. In 2015, 84% of respondents rated their law school experiences “excellent” or “good.” [i] Eighty-one percent stated that they would definitely or probably attend their same law school again. [ii] Interestingly, these proportions were higher than in both 2011 and 2006. This is noteworthy, given the increased costs of legal education and the handwringing about whether the endeavor is worth those costs.
A possible theory for these higher expressions of satisfaction might be that those who have opted to attend law school in spite of the unflattering scrutiny of late are more likely to have an affinity for the endeavor that transcends some of the most common practical considerations. Put simply, current law students may be more apt to be satisfied with the experience compared to past cohorts. Another theory could be that law schools have adapted to changing student needs and demands in ways that have increased satisfaction. In any case, the trend was somewhat surprising to us.
But in each survey year, respondents who expected to owe more than $120,000 were noticeably less likely to respond favorably to the satisfaction questions. In 2006, 75% of these respondents had favorable views of their law school experiences, compared to the overall rate of 80%. Similar differences were observed in 2011 and 2015. [iii]
[i]. Overall Satisfaction with “Entire Law School Experience” response proportions
[ii]. Overall “Same Law School” response proportions
[iii]. Satisfaction with “Entire Law School Experience,” more than $120K