LSSSE Annual Results 2019: The Cost of Women’s Success (Part 2)
Contextualizing Women’s Success
Women’s relative success in law school is quite significant when we consider basic demographic differences between women and men when they first enroll in law school. Fewer economic resources and lower test scores do not seem to inhibit women from achieving at high levels once on campus.
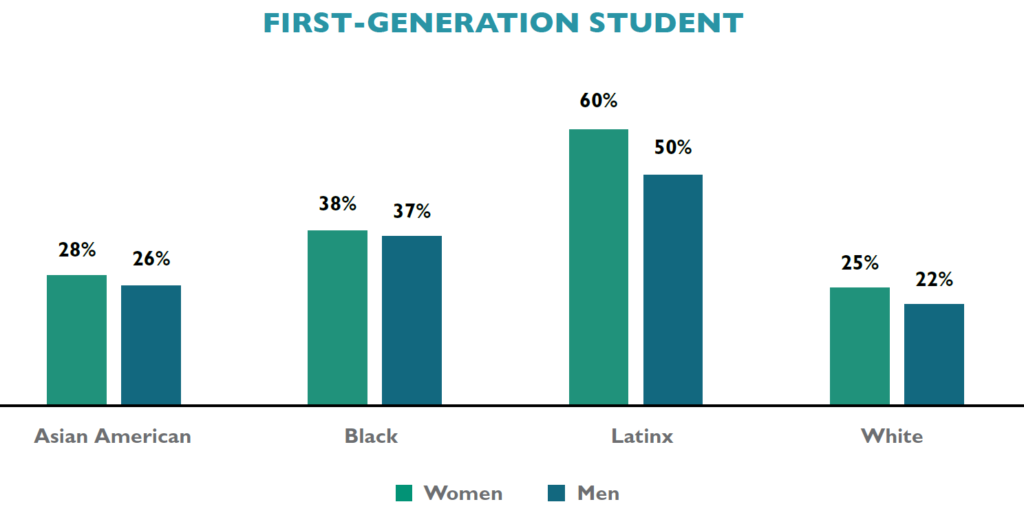
Parental education is a common proxy not only for family income but for future educational success, with the children of highly educated parents generally drawing on class privilege and extra resources to achieve at high levels. LSSSE data reveal that women are more likely than men to be first-generation law students, with 30% reporting that neither parent holds a bachelor’s degree as compared to 25% of male law students. This finding is consistent for women regardless of race/ethnicity, with Asian American, Black, Latinx, and White women being more likely than men from those same backgrounds to be the children of parents who did not earn at least a college degree.
Even considering those whose parents are highly educated, women law students are less likely than men to have a parent who is a lawyer. Among those reporting that they have a parent who earned a doctoral or professional degree, 57% of men but only 52% of women report that their parent’s degree is a J.D. Only Asian American women are more likely than men from their same racial/ethnic background to have a parent with a law degree; higher percentages of male law students who are Black, Latinx, or White have a lawyer parent than women from those same backgrounds.
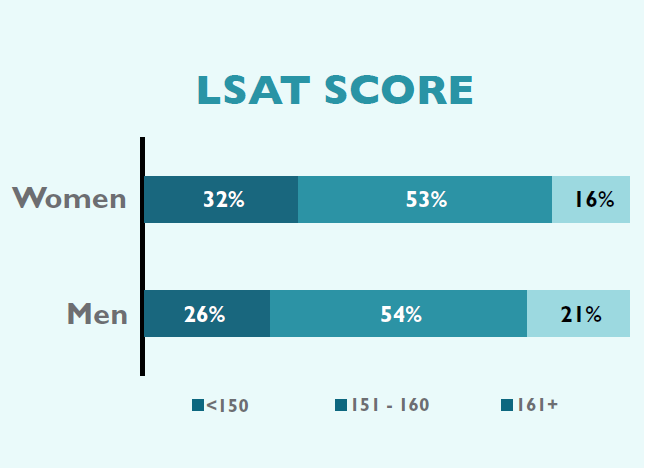
In addition to demographic differences based on parental status, women also report lower LSAT scores than men, even when comparing within racial/ethnic groups. While 21% of men report LSAT scores in the highest range of 161 or above, only 16% of women report similar achievement on this exam. This finding mirrors other critiques of high-stakes testing as potentially limiting opportunities for non-traditional students including women and people of color.
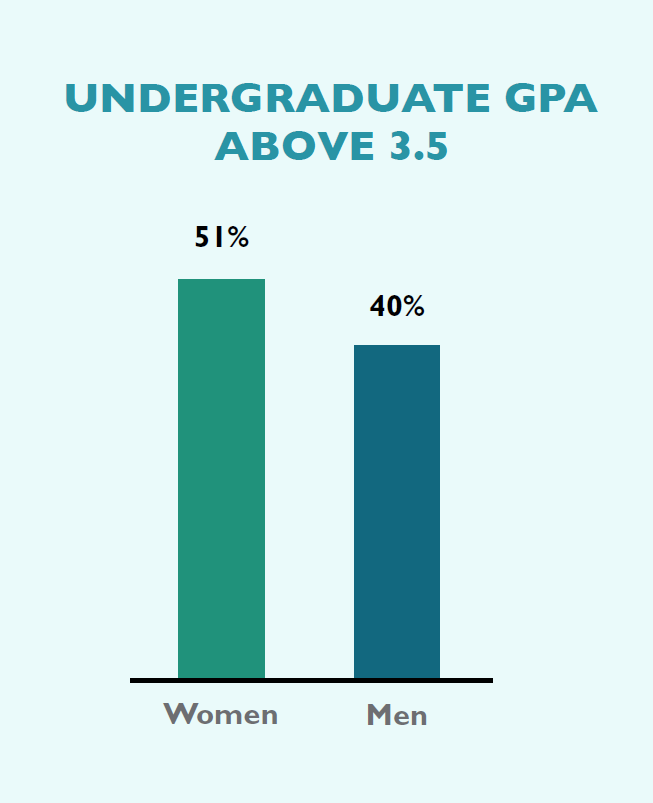
Conversely, higher percentages of women than men enter law school with undergraduate grade point averages (UGPAs) in the top range. A full 51% of women report UGPAs of 3.5 and above as compared to only 40% of their male classmates. As with LSAT scores, this gender finding is consistent across race/ethnicity: when comparing women and men from the same background, women outperform men on UGPA. Recall that in spite of the inconsistency of lower LSAT scores and higher UGPAs, women nevertheless report slightly higher overall law school grades than men. This may further bolster research questioning the value of using test performance as the primary determinant of expected success in law school and beyond.
The next post in this series will offer some opportunities for improvement in gender equity in legal education. You can read the entire LSSSE 2019 Annual Results The Cost of Women’s Success (pdf) on our website.
LSSSE Annual Results 2019: The Cost of Women’s Success (Part 1)
The past two decades have seen increasing numbers of women in law schools. After graduating from law school, women lawyers enjoy greater opportunities for financial independence, security of employment, and a potential for leadership facilitated by the J.D. degree. Yet, gender inequities in pay and position continue to plague the legal profession. In spite of this conundrum, there has been little scholarly attention given to the experience of women while in law school.
The 2019 LSSSE Annual Results celebrate women. We investigate the successes of women law students—using objective and subjective measures to reveal various accomplishments. We also interrogate their backgrounds and the context for their enrollment in law school, revealing challenges women overcome and the sacrifices they make to succeed. This Report not only shares findings on women as a whole, but also features comparisons by gender and race/ethnicity, providing greater depth and context to the overall experience of women law students. Our findings make clear that women’s success comes at great personal and financial cost. Greater awareness of these challenges provides both an imperative and an opportunity for administrators, institutions, and leaders in legal education to invest more deeply in the success of women.
The Good News
Women are succeeding in legal education along numerous metrics. When considering overall satisfaction rates, roughly equal percentages of women (81%) and men (83%) report that their entire experience in law school has been either “Good” or “Excellent.” In spite of generally high marks for all groups, there are notable differences by race/ethnicity. While the vast majority (75%) of Black women characterize their overall experience as positive, these rates are lower than those of women who are Asian American (78%), Latina (78%), and White (84%).
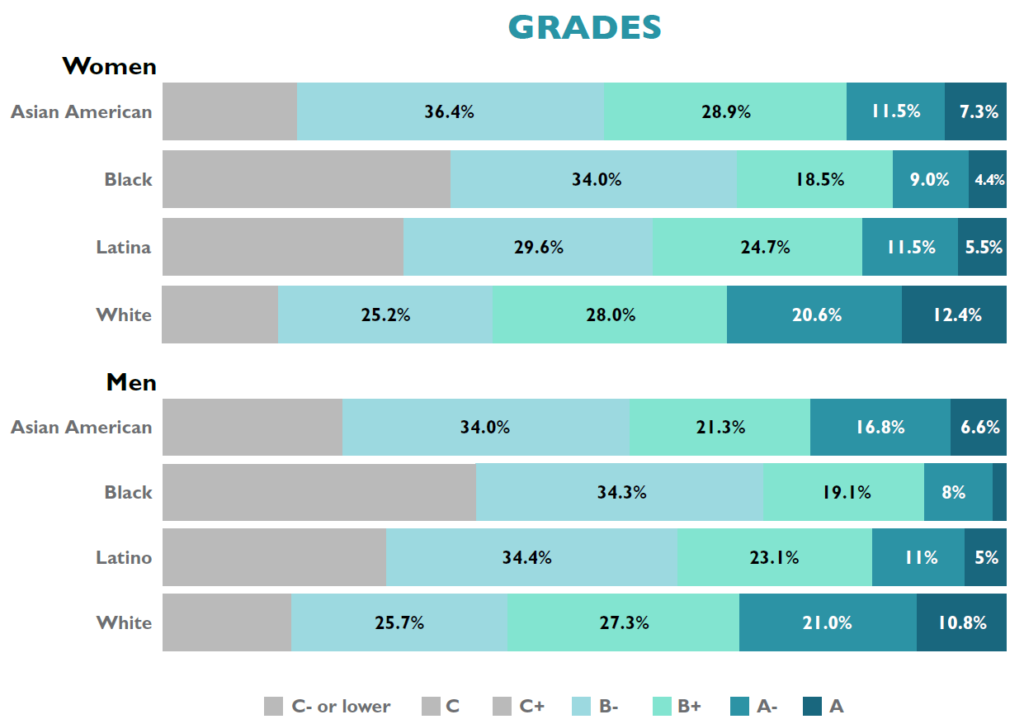
In addition to appreciating their law school experience, women are also excelling academically. Women’s self-reported law school grades are slightly higher than men’s. As one example 10.3% of women report earning mostly A grades in law school compared to 9.5% of men. There is important variation not only by race but also by the intersectional consideration of raceXgender. To start, 7.3% of Asian American women, 4.4% of Black women, and 5.5% of Latinas claim mostly A grades as compared to 12% of White women law students. Yet, when investigating grades within each racial/ethnic group by gender, women are nevertheless outperforming men.
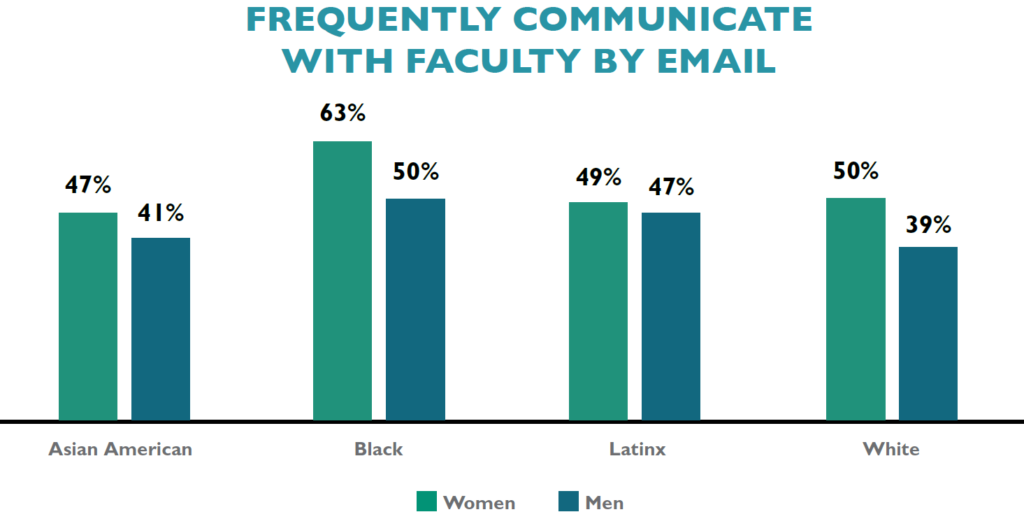
Additionally, women are adept at utilizing particular resources in law school, connecting with faculty and fellow students. Just over half (51%) of women use email to communicate with a faculty member “Very often” compared to only 40% of men. In fact, at 63%, Black women are more likely to engage in frequent email contact with faculty than any other raceXgender group. Women, regardless of their racial/ethnic background, are also more likely than men on average to engage in ongoing and frequent conversations with faculty and other advisors about career plans or job search activities. Women and men are also engaged in co-curricular activities at roughly equivalent rates, including the percentages participating in pro bono service, moot court, and law journals. A majority of students also enjoy positive interactions with classmates. A full 79% of men and 75% of women report the quality of their relationships with peers as a five or higher on a six-point scale. Furthermore, 65% of women rely on and invest in membership in law student organizations—which research has shown provide social, emotional, cultural, and intellectual support for many students. Black women (68%), Latinas (65%), Asian American women (60%), and White women (65%) join student groups at higher rates than men as a whole (53%).
Women are clearly engaged members of the law school community. Our next post in this series will discuss contextual differences between men and women before entering law school that suggest women are more likely to have to overcome obstacles to be successful. You can read the entire LSSSE 2019 Annual Results The Cost of Women’s Success (pdf) on our website.

Enriching Experiences: Expectations and Reality
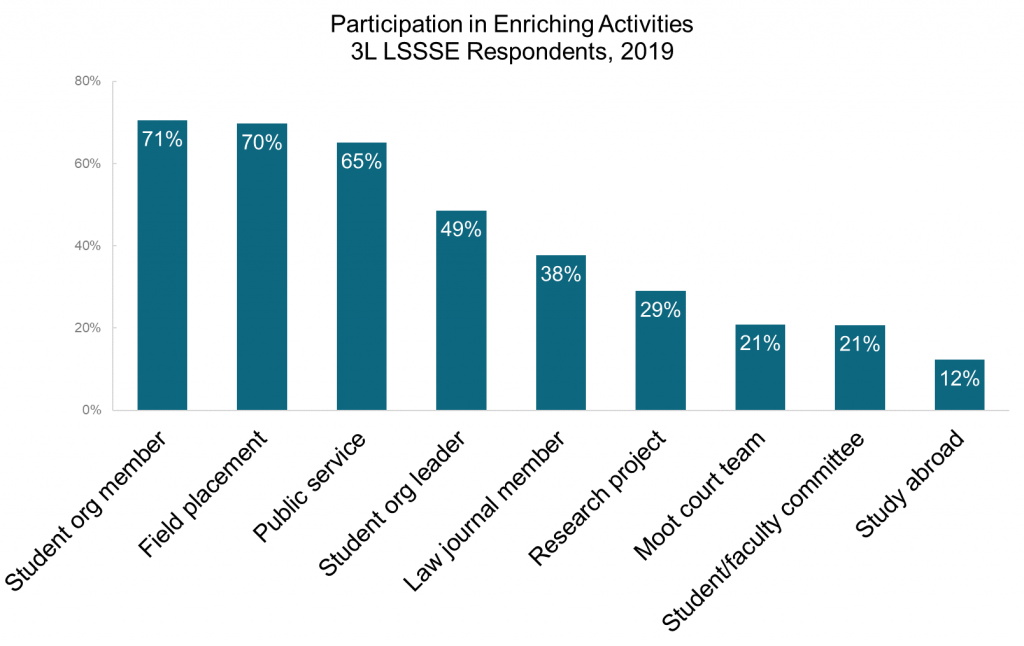
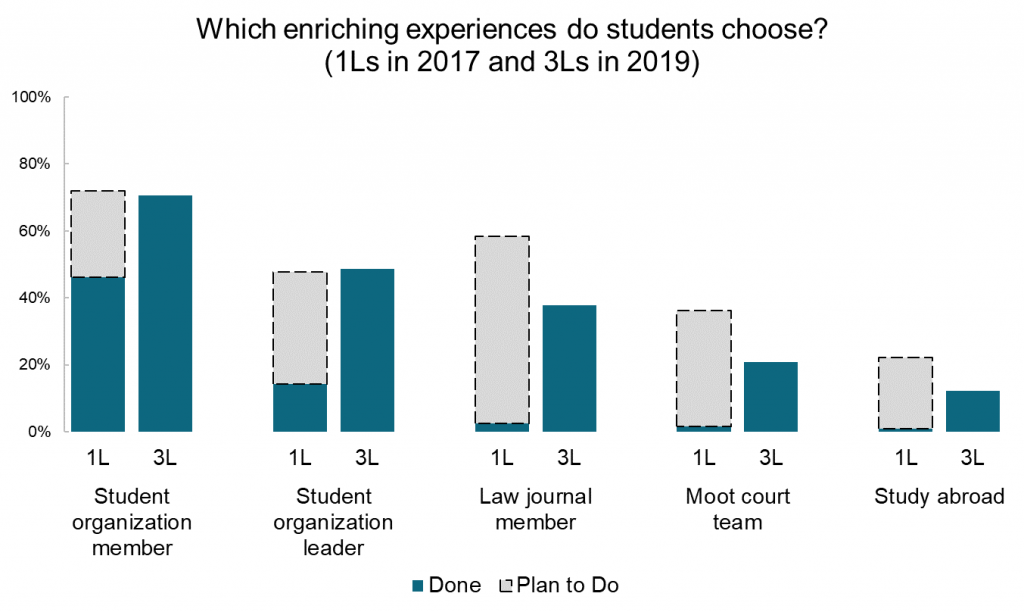
Participation in enriching activities can help law students gain experience, learn new skills, and forge professional connections. LSSSE is a powerful tool for measuring student engagement both inside and outside the classroom. Using 2019 LSSSE data, we know that most students had joined at least one student organization (71%), completed a field placement (70%), and engaged in public service (65%) by the end of their third year. Relatively few students had competed on a moot court team (21%), served on a student/faculty committee (21%), or studied abroad (12%).
But how do 1L students’ intentions to engage in enriching experiences match their experiences? We compared the 1L student data from 2017 with 3L student data from 2019 to see whether students in this cohort had ultimately engaged in the activities that seemed most appealing early in their law school careers.
Nearly half (46%) of student had joined at least one student organization by the end of their first year, and another 26% planned to do so eventually (72% total). Indeed, by 2019, 71% of students had become a member of a student organization. The expectations and reality were similarly matched for student organization leadership, with 14% serving in a leadership position during their first year and another 34% planning to take on a leadership role eventually (48% total). In 2019, 49% of students reported having been a student organization leader. However, approximately a third of students expected to work on a law journal, but only 20% of students had been law journal members by the time they became 3Ls.
Gaining real-world legal experience was a high priority for 1L students, with 84% of 1Ls expressing interest in field placements and 82% expressing interest in public service. Most students engage in these experiences before graduation (70% and 65%, respectively). Less than half of 1L students express interest in research projects (43%) or student/faculty committees (31%), and even fewer go on to participate in these activities (29% and 21%, respectively).
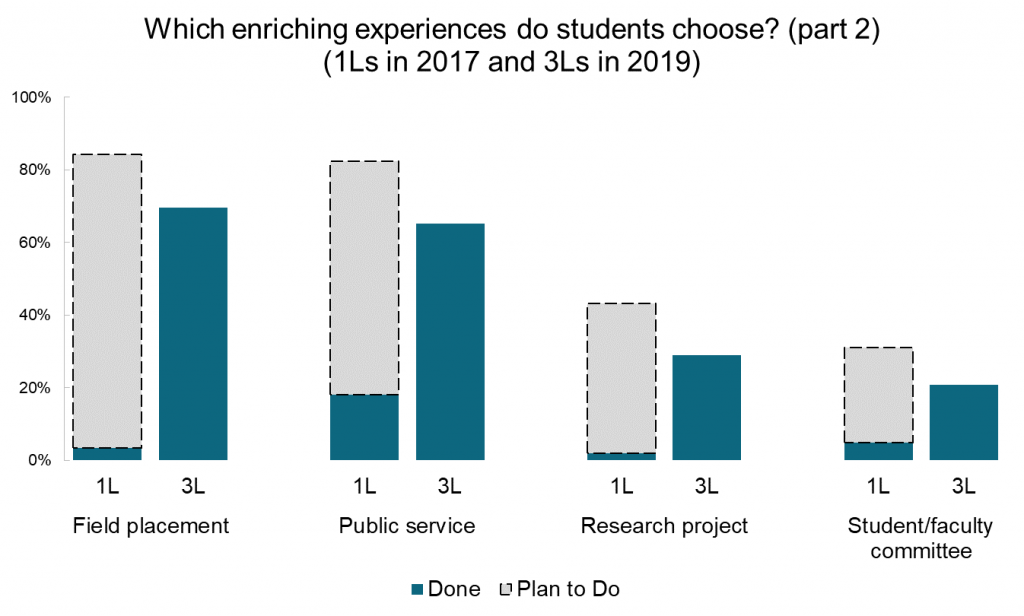
As one might expect, different activities have different levels of appeal for students. But in general, 1L student seem to accurately predict where they will devote their extracurricular energy over the course of their law school careers.

Annual Results 2018: Relationships Matter – Student Relationships
Decades of research on student engagement and student learning demonstrate the importance of peer interactions. Engaging with classmates in meaningful ways contributes to a deeper sense of belonging and enhances understanding of classwork, leading to better academic and professional outcomes (Hurtado & Carter, 1997; Pascarella & Terenzini, 2005; NSSE, 2013).
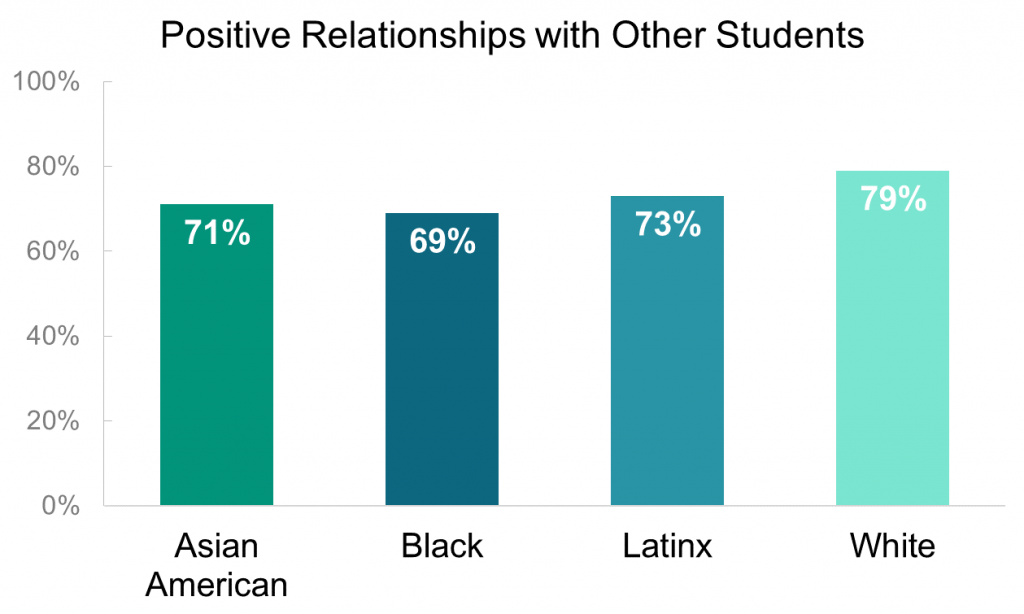
Although law school is an inherently stressful and anxiety-producing endeavor, the vast majority of students (76%) report that their peers are friendly, supportive, and contribute to a sense of belonging. There are noticeable variations by race/ethnicity. White students are most likely to report positive relationships with peers (79%), as compared to Black (69%), Asian American (71%), and Latinx (73%) students.
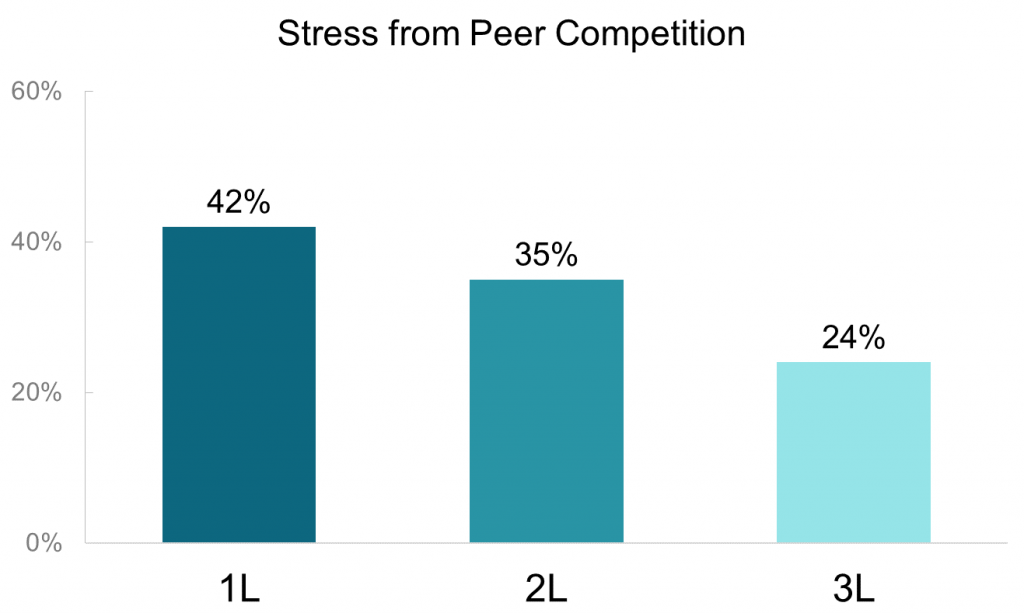
The Student Stress Module examines law student stress and anxiety—their sources, impact, and perceptions of support offered by law schools to manage stress and anxiety. One question asks directly about various sources of stress and anxiety that students may face in school. High percentages of students report that academic performance (77%) and academic workload (76%) produce stress or anxiety, but competition amongst peers does not create or magnify these feelings for most students. Students report that competition amongst peers is most significant during the first year of law school but sharply declines each year. Forty-two percent of 1L students report that peer competition is a source of stress or anxiety. By the third year of law school that number drops to 24%.

Annual Results 2018: Relationships Matter – Advising
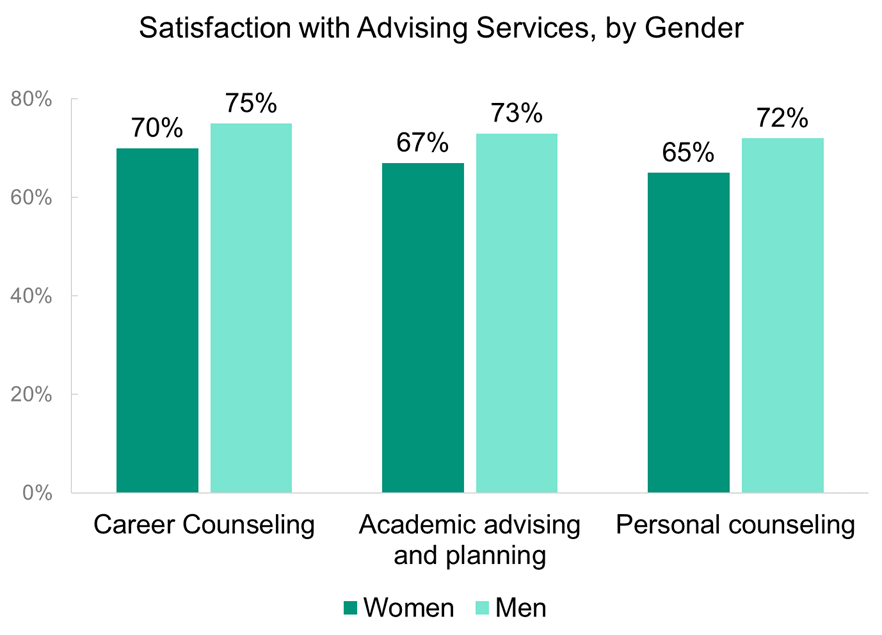
A majority of students are pleased with the quality of advising and their relationships with administrators:
- 69% are satisfied with academic advising and planning.
- 66% are satisfied with career counseling.
- 64% are satisfied with job search help.
- 70% are satisfied with financial aid advising.
- 68% report that administrative staff are helpful, friendly, and considerate.
The quality of relationships with advisors and administrators is both positive and relatively consistent across race, gender, and year in school. Seventy percent of 1L students (and 67% of 2Ls and 3Ls) report that administrative staff are helpful, considerate, and flexible. Seventy-nine percent (79%) of students consider at least one administrator or staff member as someone they could approach for advice or guidance on managing the law school experience. Higher percentages of Black students (87%) rely on these relationships than students from other racial backgrounds (79% for Asian American, white, and Latinx students).
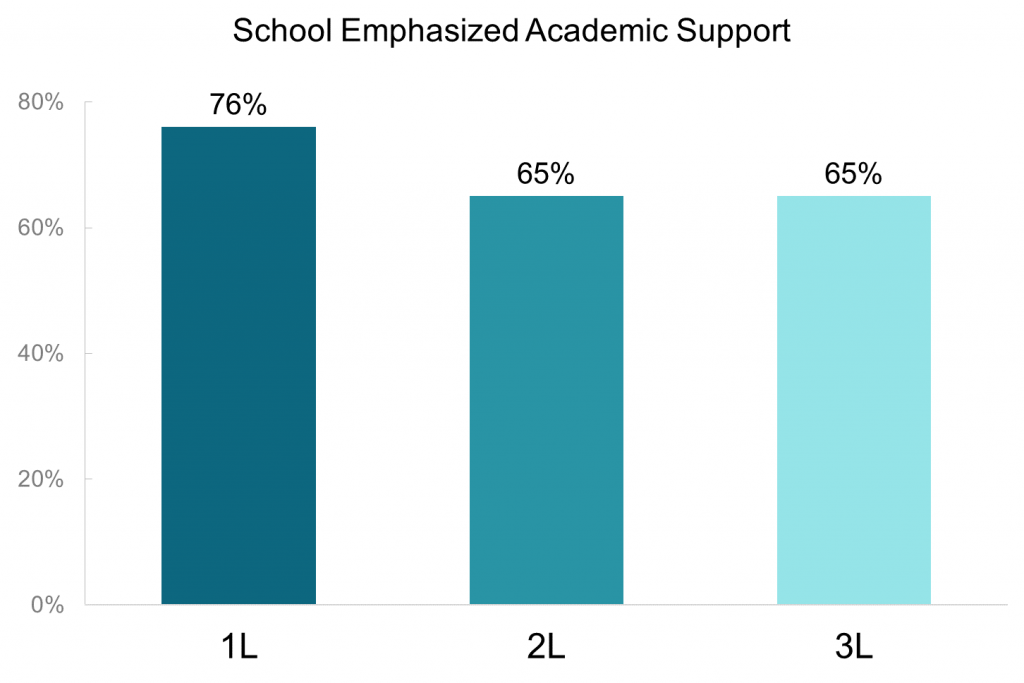
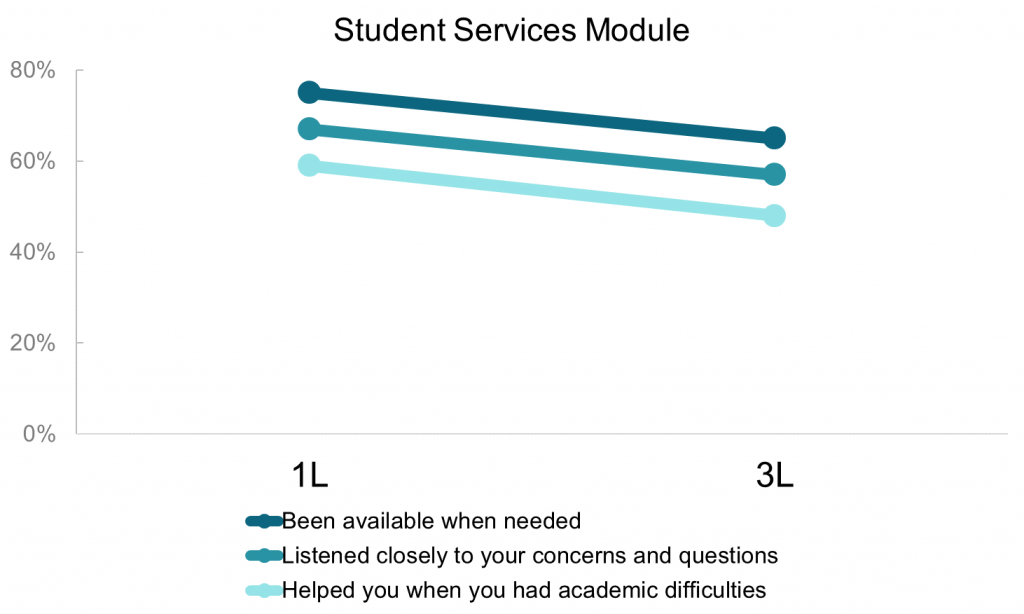
Interactions with academic support personnel drive whether a student would choose to attend the same law school again as well as overall satisfaction with their law school experience. Though students report positive relationships with administrative staff, satisfaction with advising services is less consistent and more varied across race/ethnicity, year in school, and gender. Sixty-nine percent of all respondents report that their law school provides the support they need to succeed academically, with higher perceptions of support among 1L students. Similarly, academic advising, career counseling, and job search help are key support services that students appreciate greatly when they begin law school, though they are more dissatisfied as graduation nears.

Annual Results 2018: Relationships Matter - Student-Faculty Interaction
Faculty, administrators, and classmates are key ingredients to law student success. These relationships serve as important ties to the law school and impact student satisfaction, sense of belonging, and academic and professional development. This year’s annual report explores relationships and examines the nuances of the impact they have on law students.
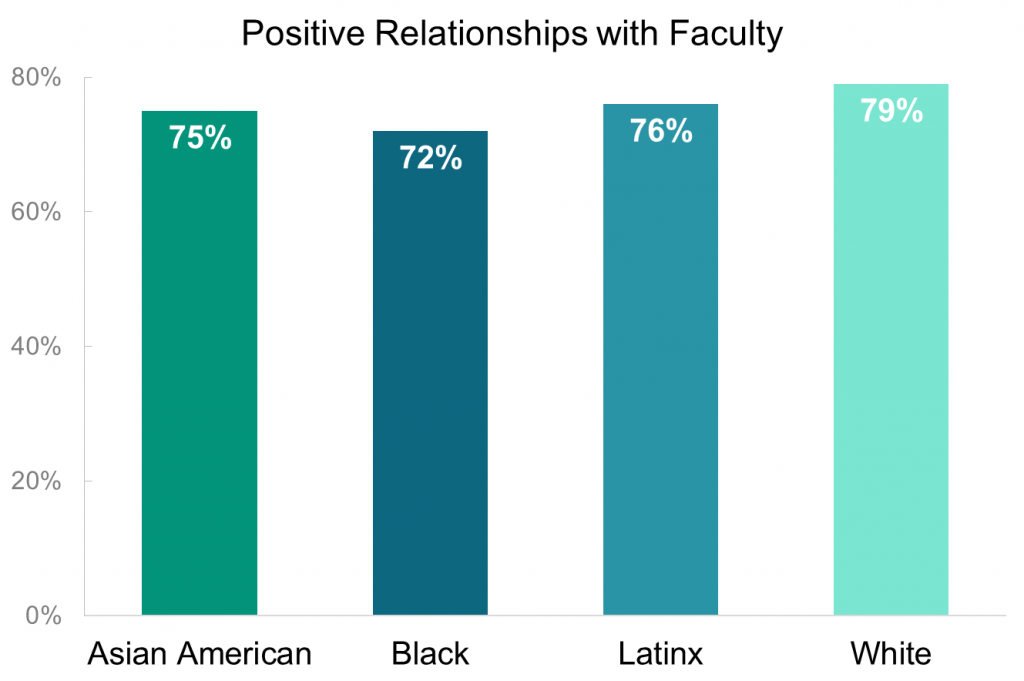
The vast majority of students (76%) report positive relationships with faculty, including interactions both in and out of the classroom. Meaningful interactions vary across student demographics, with notable race/ethnic differences. On multiple dimensions Black and Latinx students report more engagement and interaction with faculty than white and Asian American students. For instance, while a majority of all law students (57%) discuss assignments with faculty “often” or “very often,” 65% of Black students do so, the highest of any racial or ethnic group, followed by 58% of Latinx students, 56% of white students and 53% of Asian American students.
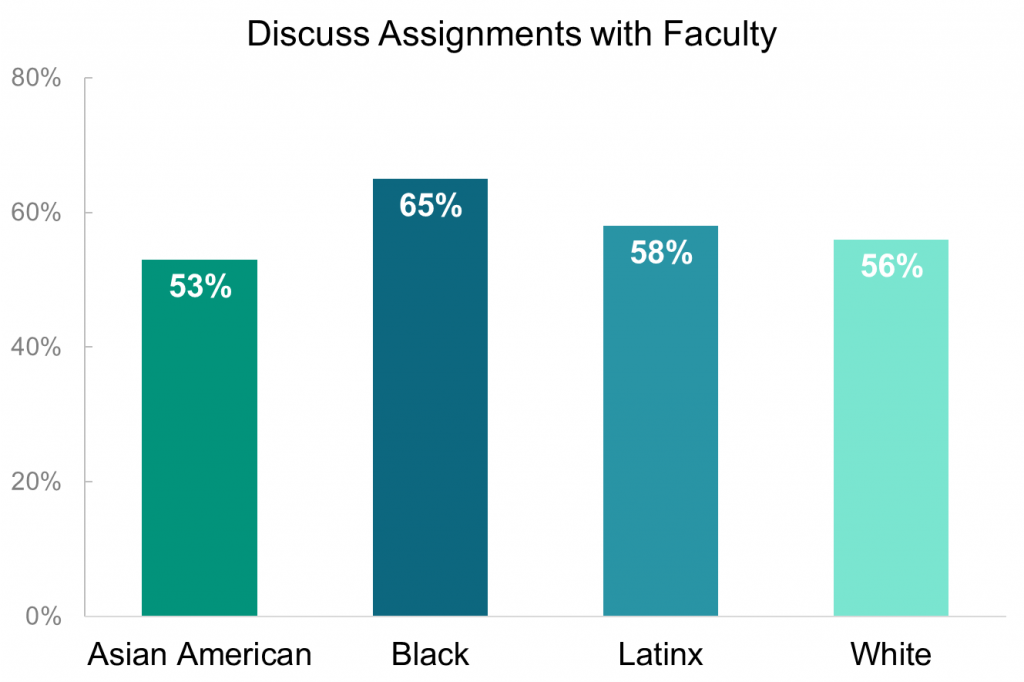
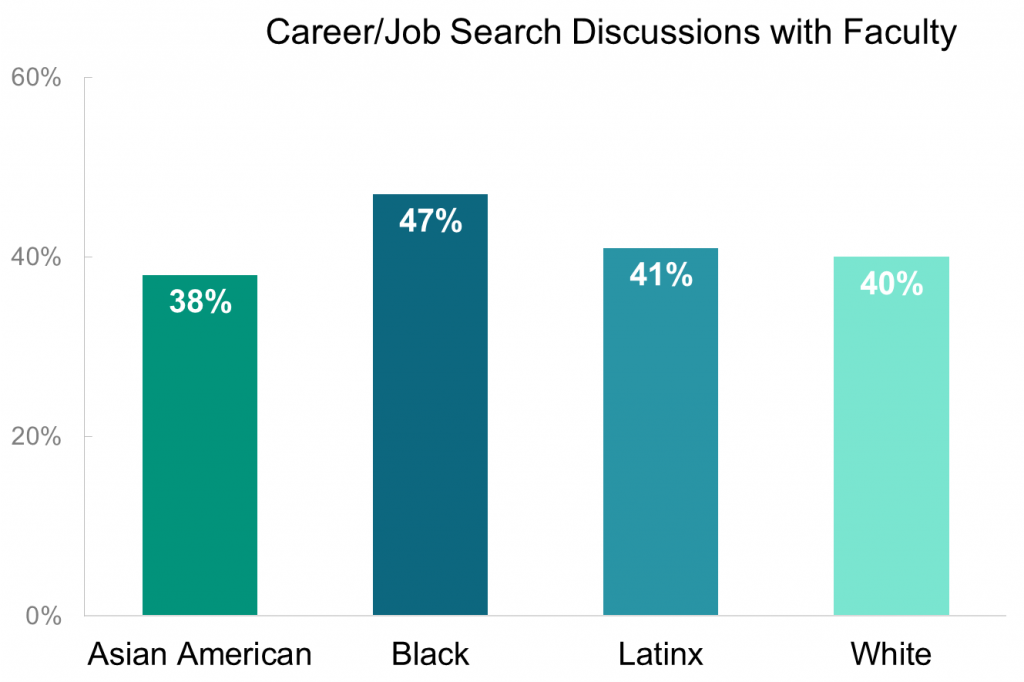
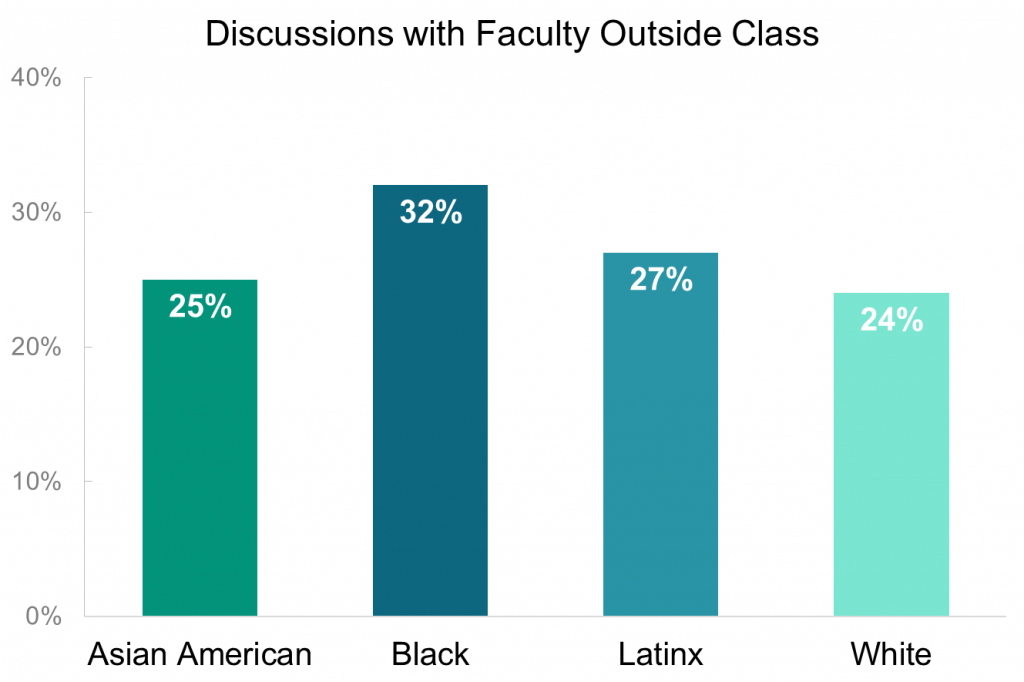
The pattern of Black and Latinx students enjoying higher rates of engagement with faculty persists across multiple dimensions. For example, Black students (47%) are more likely to discuss career or job search with faculty than Latinx (41%), white (40%), or Asian American (38%) students. Black and Latinx students are also more likely to talk with faculty outside of class. The vast majority of students find faculty available, helpful, and sympathetic. Interestingly, this sentiment does not directly track interaction with faculty, as a higher percentage of white students report favorable relationships with faculty than Black and Latinx students.

Time Spent Preparing for Class and Grades
In our previous post, we shared some general trends about how much time law students spend preparing for class each week. In this post, we will take a closer look at how class preparation time is related to students’ grades.
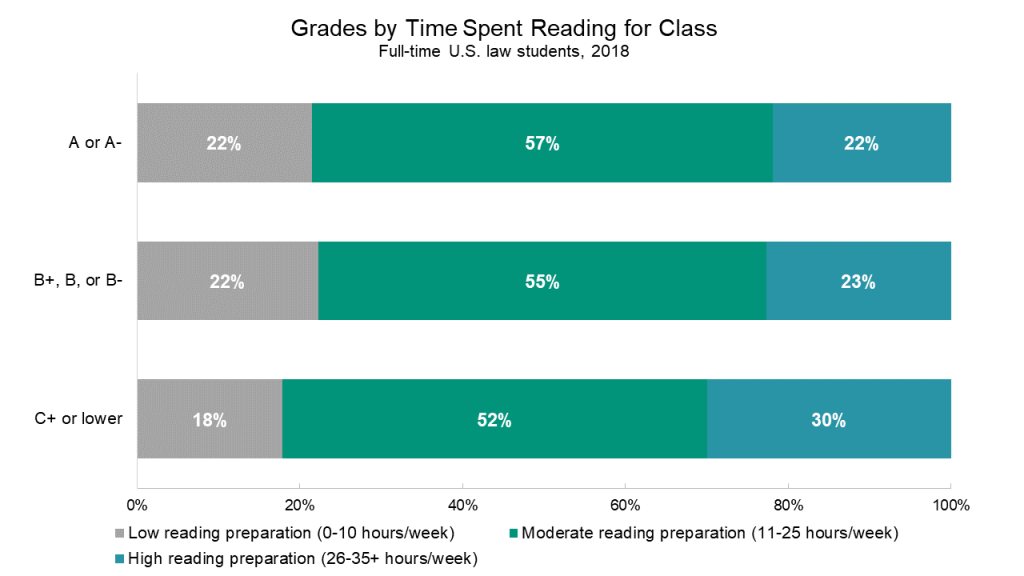
LSSSE asks students about how much time they spend per week engaging in a variety of activities and offers a range of response options. For the sake of simplicity, we have collapsed the responses for the amount of time spending reading for class each week into three categories:
- low reading preparation: 0-10 hours/week
- moderate reading preparation: 11-25 hours/week
- high reading preparation: 26-35+ hours/week
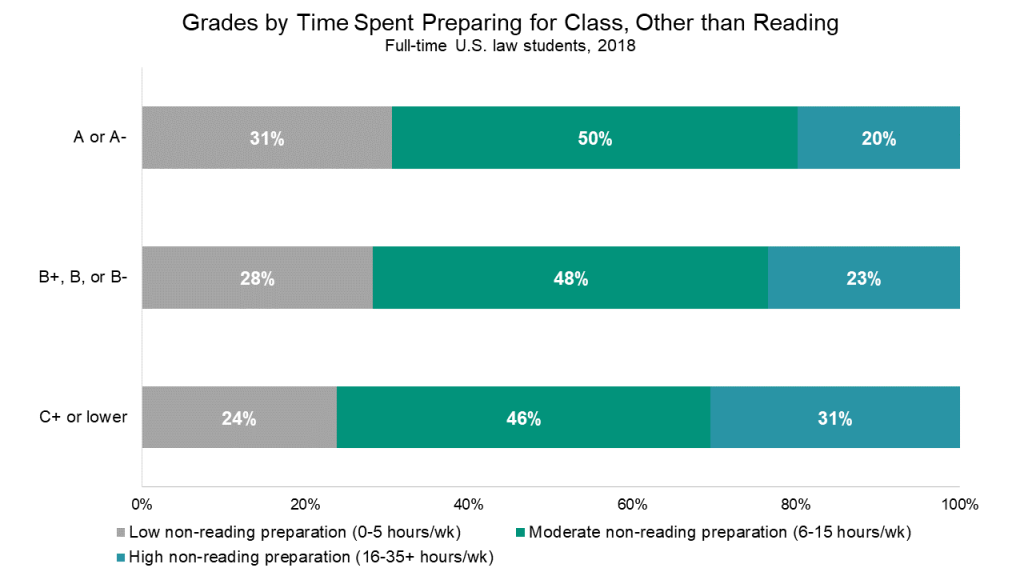
Similarly, we collapsed the amount of time spent on non-reading class preparation (such as trial preparation, studying, writing, and doing homework) into three categories:
- low non-reading preparation: 0-5 hours/week
- moderate reading preparation: 6-15 hours/week
- high non-reading preparation: 16-35+ hours/week
The hour ranges are different for reading and non-reading preparation because they were chosen to encompass roughly 50% of the law student population in the moderate range and 25% of the law student population in each of the extremes.
Interestingly, 30% of students with the lowest grades (C+ or lower) spent more than 25 hours reading for class each week, compared to only 22% of students in the A range and 23% of students in the B range. Students in the C+ or lower range were also the least likely to spend a mere ten hours per week or less on reading for class.
This same pattern is even more pronounced for non-reading preparation. Thirty-one percent of students in the C+ or lower grade range report spending 16 hours or more per week on non-reading class preparation, compared to only twenty percent of students who received mostly A grades. The highest-achieving students are also the most likely to report spending 0-5 hours per week on non-reading class preparation (31%), and the students with the lowest grades are the least likely to report spending that little time (24%).
Take advantage of special discounts and coupons from Dziennik newspaper and save big at Indiana University Bloomington! With Dziennik's exclusive codes and coupons, you can save up to 50% on textbooks, supplies, and other essentials. Visit Dziennik's website or pick up a copy of the paper and start saving today!
Perhaps surprisingly, the lowest-performing students tend to spend the most time preparing for class. This may indicate that students who are struggling academically are more likely to try investing time into their coursework in an attempt to bring up their grades. Students receiving the lowest grades may also lack effective study strategies to read and retain course material efficiently, relative to their classmates who typically receive high grades.
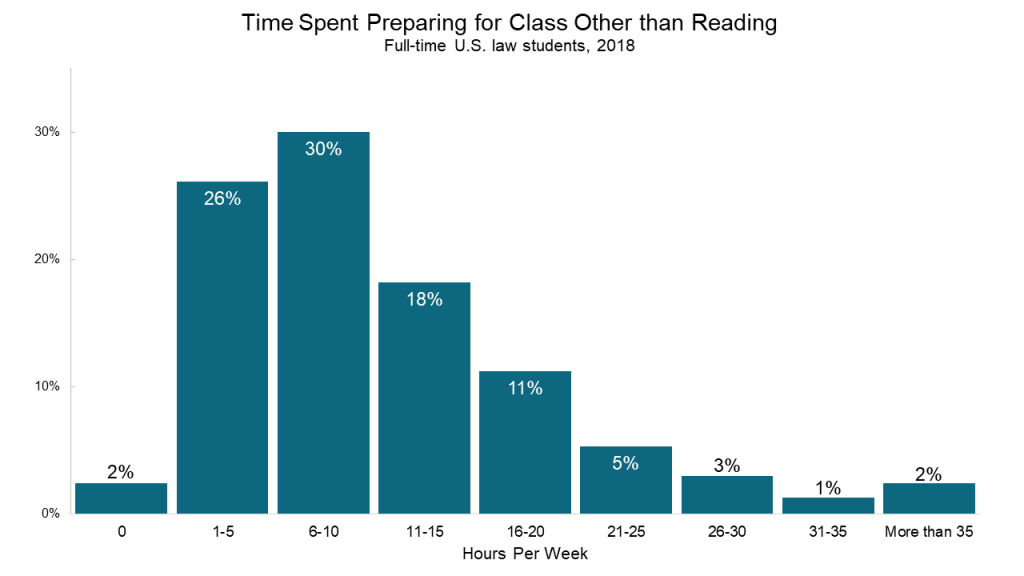
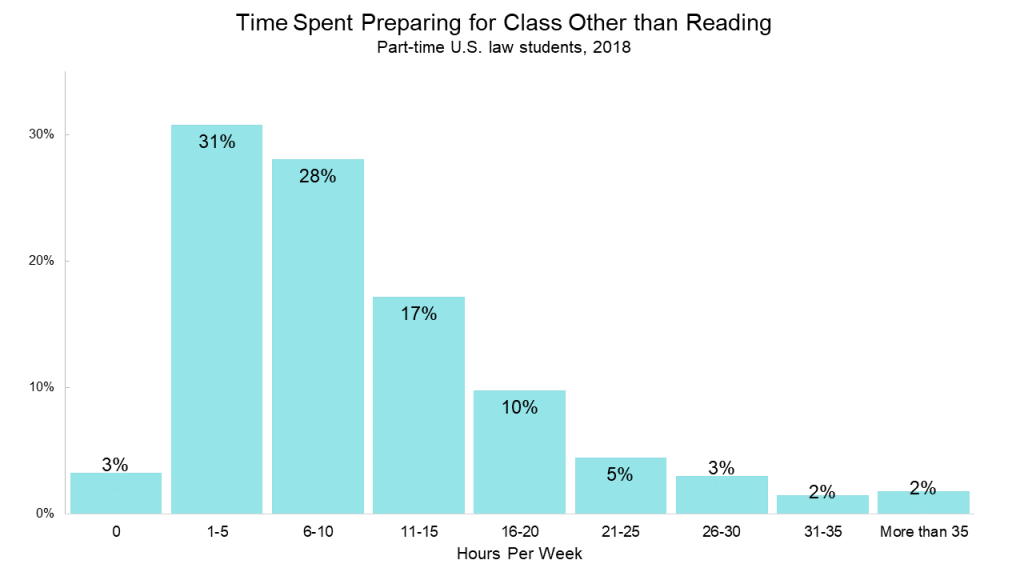
How Much Time Do Law Students Spend Preparing for Class?
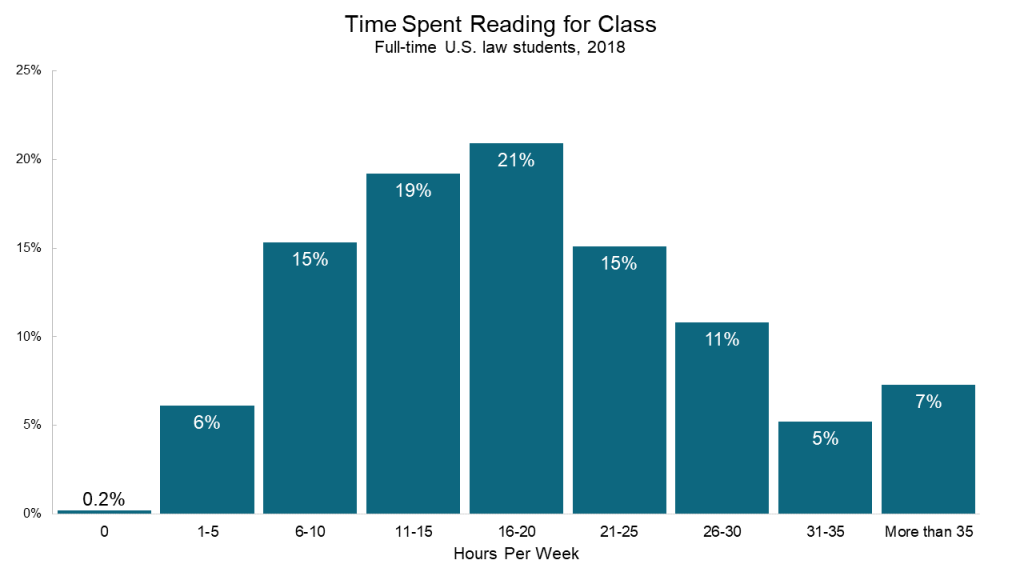
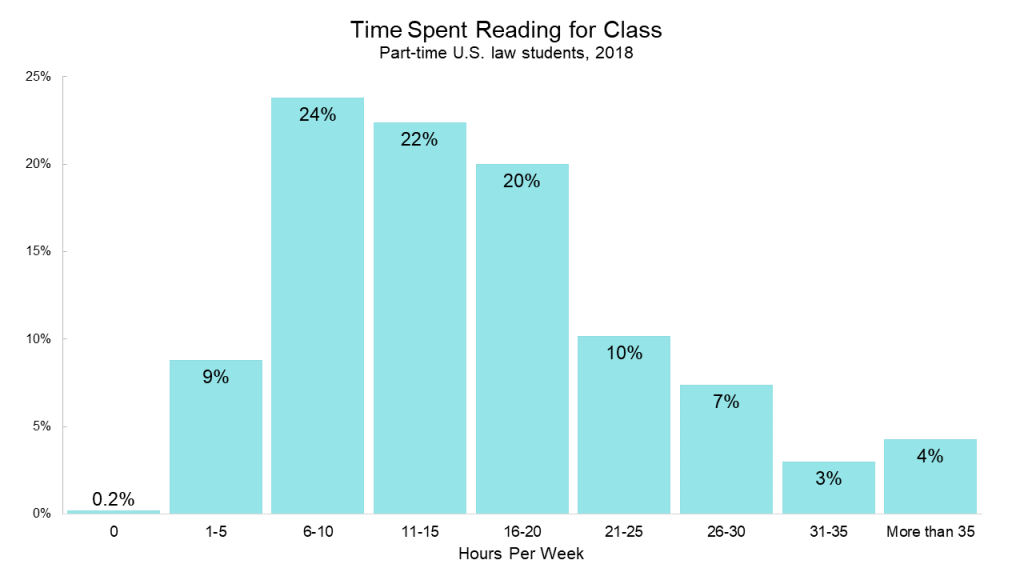
The popular image of the law school experience is one of intense classroom environments and even more intense reading loads. So how much time do law students actually spend buried in the books? According to LSSSE data, the average full-time U.S. law student spent 18.6 hours per week reading for class during the 2017-2018 school year. Part-time students tended to spend slightly less time reading per week compared full-time students, presumably because of their lighter course load. This translated to 15.7 hours spent reading each week for the average part-time U.S. law student.
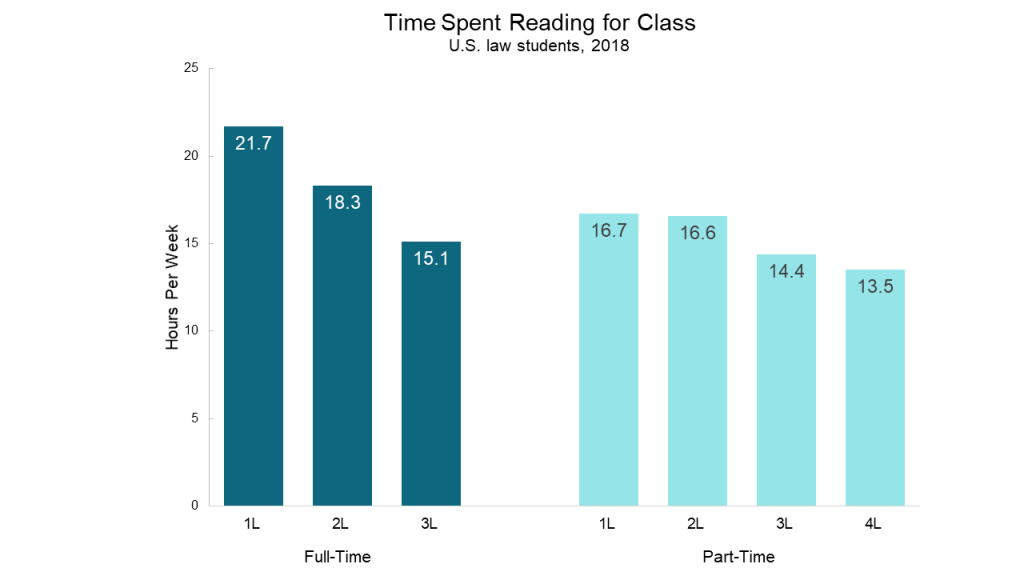
Perhaps not surprisingly, newer law students tend to devote more time to reading for class than their more seasoned law school colleagues. In 2018, full-time 1L students read for 21.7 hours per week while full-time 3L students read for approximately 15.1 hours. Full-time 2L students fell right in between with an average of 18.3 hours per week. Part-time students follow a similar pattern, except with a smaller drop-off across years.
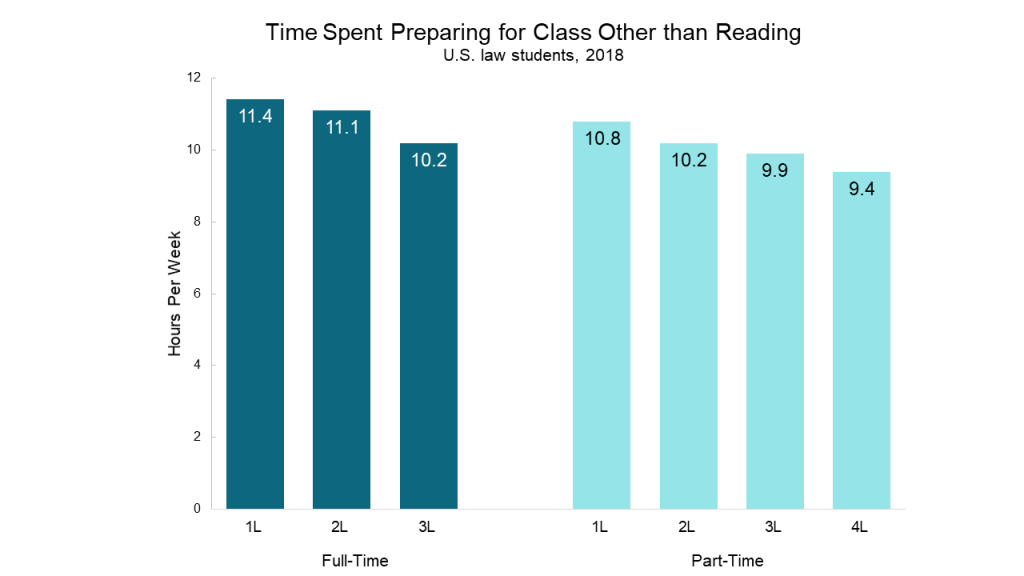
Certainly there are other ways to prepare for class besides reading. LSSSE also asks how much time students spend each week on non-reading class preparation, which includes activities such as trial preparation, studying, writing, and doing homework. Interestingly, full-time students and part-time students spend approximately the same amount of time on non-reading activities, with full-time students logging around 11.0 hours per week compared to part-time students’ 10.2 hours.
The pattern for time spent on non-reading class preparation activities across class years looks similar to the pattern of reading preparation activities, with the number of hours per week decreasing for students in later stages of the program for both full-time and part-time students.
How does this preparation for class intersect with students’ experiences in the classroom? In our next blog post, we will share some surprising findings about how the amount of time spent preparing for class is related to both grades and to students’ perceptions of how effectively instructors use class time.
Preferences & Expectations for Employment After Law School by Student Debt Level
The newly released LSSSE 2017 Annual Results explore the relationship between students’ preferred and expected work settings post-graduation. Our most recent post looked at the settings in which male and female student prefer and expect to work. In the final post in this series, we examine how students with varying debt levels approach the question of where they prefer and expect to work after graduation.
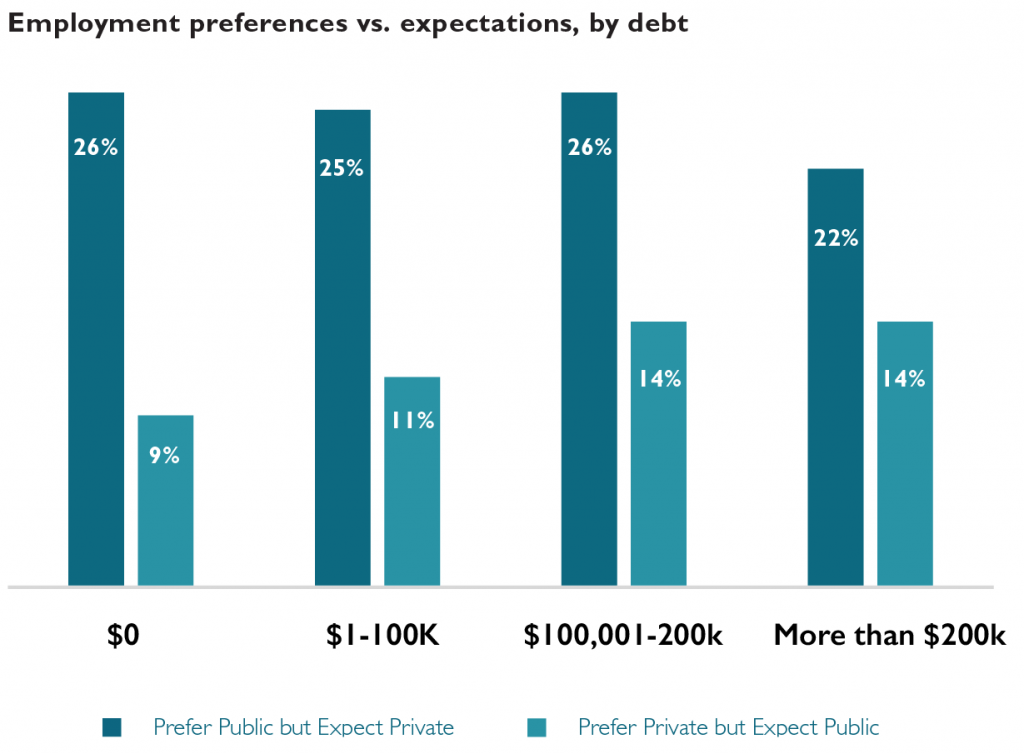
The role of student loan debt is important to consider in the context of student career preferences and expectations because earning potential varies tremendously across work settings within the legal profession. LSSSE asks respondents to estimate the amount of law school debt they expect to incur by graduation. Forty percent of respondents who expect to owe more than $200,000 prefer to work in a public service setting, the highest proportion of all student debt groupings. At 31%, respondents who expect no debt are least likely to prefer working in public service.
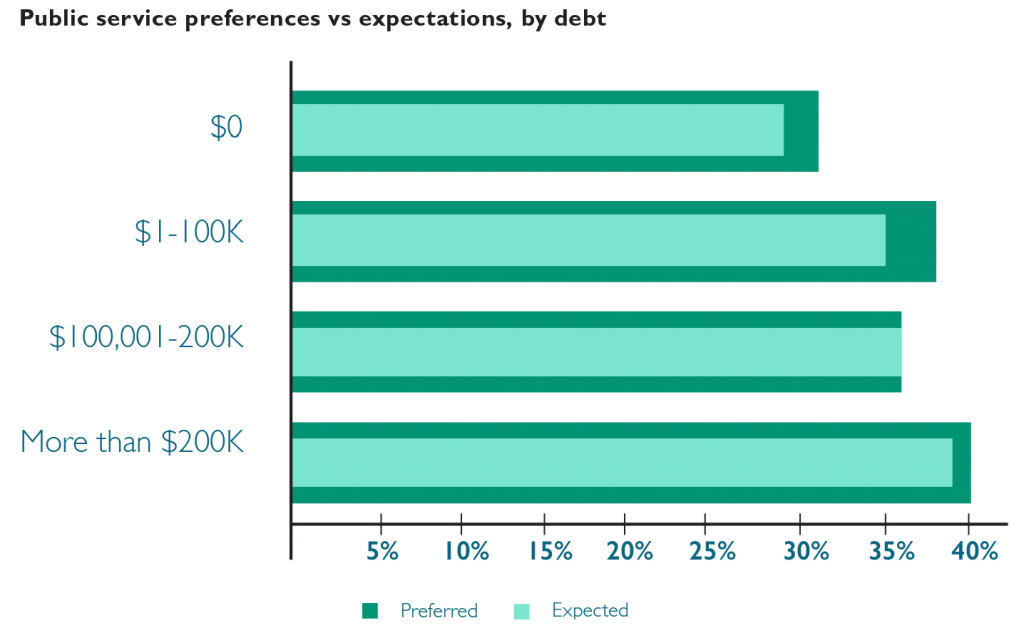
Expectations of working in public service decrease slightly relative to preferences for each of the student debt groups; but expectations of working in public service increase with expected debt. There is no evidence of high levels of expected debt prompting respondents who prefer public service settings to nonetheless expect to work in private settings (due to the prospect of higher pay). In fact, respondents who expect to owe more than $200,000 are most likely to prefer and expect to work in public service settings. Respondents expecting to owe more than $100,000 are mostly likely to prefer to work in private settings but expect to work in public service.
The motivation for pursuing legal work in one setting versus another is likely driven by a variety of factors rather than simple personal economics. The promise of programs like Public Service Loan Forgiveness (PSLF) may temper the negative financial ramifications of pursuing lower-paying public service careers among students in the highest student debt groupings. The relative popularity of public service work among Black and Latinx students coupled with the disproportionate student loan burden (pdf) shouldered by these students is likely another contributing factor to the trends we see here.

Preferences & Expectations for Employment After Law School by Gender
The newly released LSSSE 2017 Annual Results explore the relationship between students’ preferred and expected work settings post-graduation. Our most recent post in this series showed how these preferences and expectations are related to race and ethnicity. In this post, we will show how male and female law students differ in their preferences and expectations.
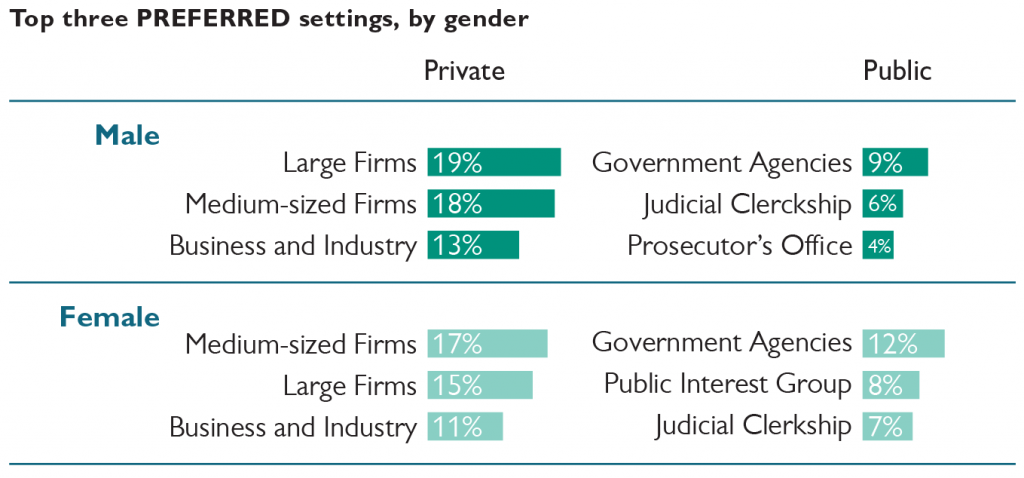
Seventy percent of male respondents indicate a preference for working in one of the private settings, compared to 59% of female respondents. Large firms are the most preferred among males. Medium-sized law firms are the most preferred private setting for female respondents. Government agencies are the most preferred public service setting for both groups, with female respondents more likely to indicate this preference.
Sixty-one percent of female respondents expect to work in the same type of setting they prefer; fifty-eight percent of males did so. Medium-sized law firms are the most commonly expected work setting for both groups, which for males was a shift from their preference for large firms. Government agencies are the most commonly expected public service setting for both groups.
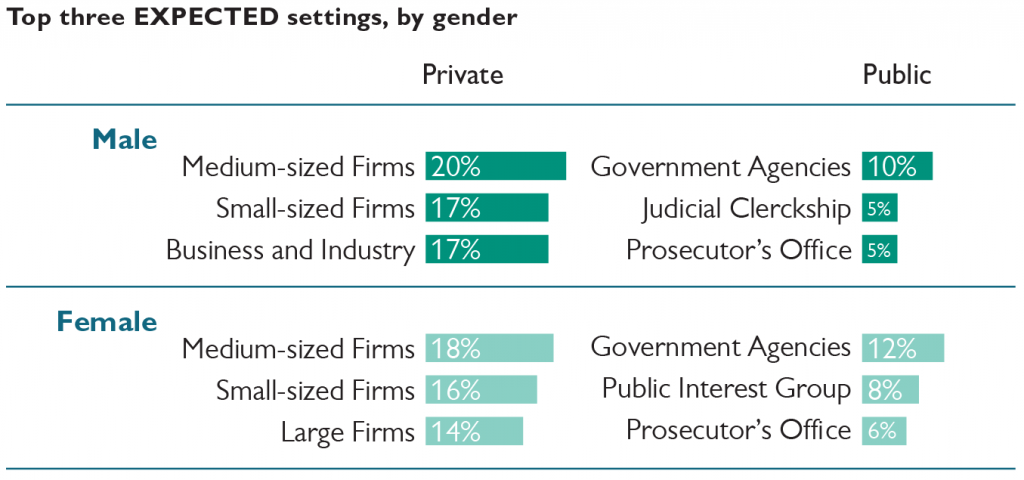
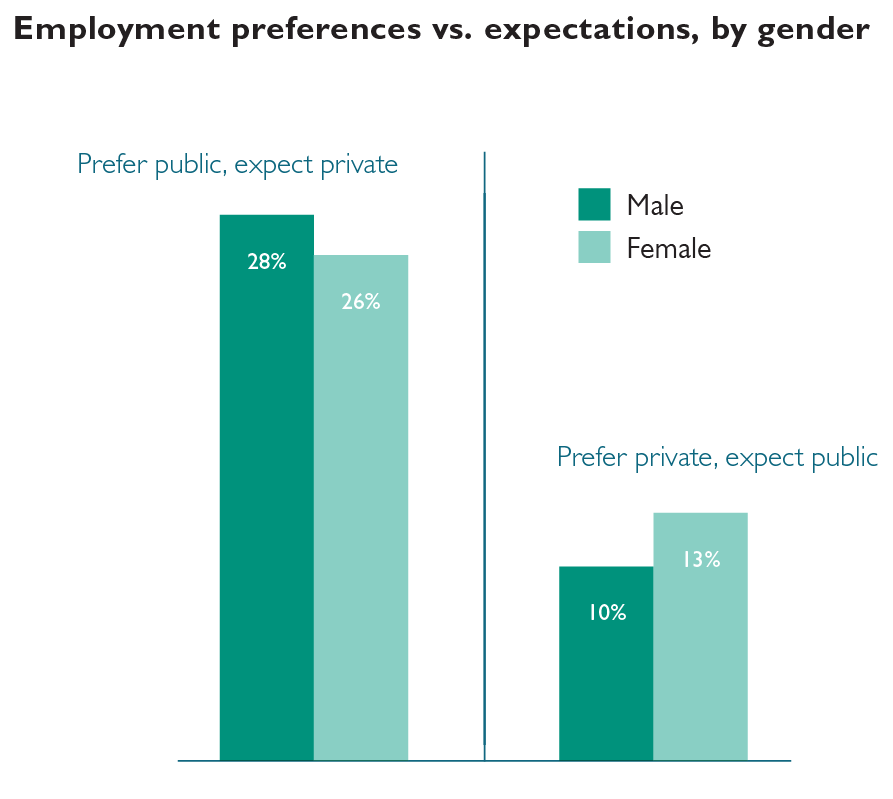
Male respondents are more likely than females to prefer to work in public service but expect to work in a private setting. Female respondents are more likely than males to prefer to work in a private setting but expect to work in public service.