
Annual Results 2020 Diversity & Exclusion: Institutional Support for Diversity
This year for the first time, LSSSE introduced a set of questions focused on diversity and inclusion that supplement related questions from the primary survey. The Diversity and Inclusiveness Module examines environments, processes, and activities that reflect the engagement and validation of cultural diversity and promote greater understanding of societal differences. The 2020 LSSSE Annual Results Diversity & Exclusion report presents data about how diversity in law school can prepare students for the effective practice of law upon graduation. In our next three posts, we will highlight key findings from the report and suggest some areas for improvement.
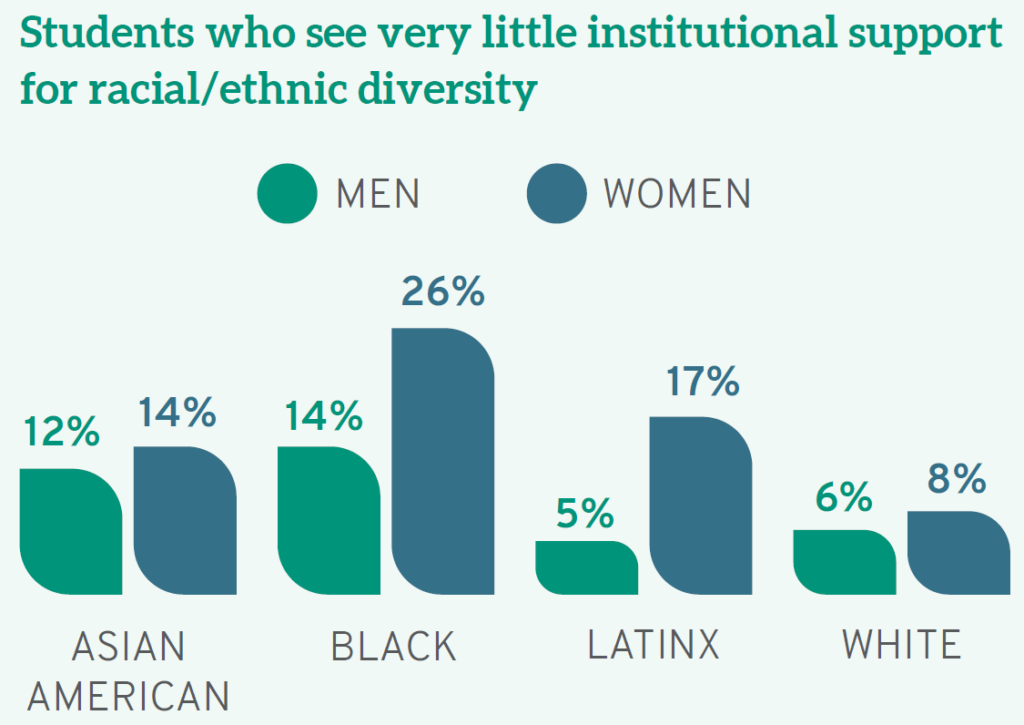
Support for diversity in law school must begin with the institution. Yet many students of color do not see their campus as supportive of racial/ethnic differences. Almost a quarter (23%) of Black law students nationwide say their schools do "very little" to create a supportive environment for race/ethnicity, compared to just 6.8% of White students. At the opposite end of the spectrum, 32% of White students believe their schools do "very much" to support racial/ethnic diversity, compared to only 18% of their Black classmates. Men (37%) are also more likely than women (26%) and those of another gender identity (7.5%) to believe their campus is very supportive of racial/ethnic diversity. Even more dramatic are intersectional identity findings, as a full 26% of Black women— more than any other raceXgender group—see their schools doing "very little" to create an environment that is supportive of different racial/ethnic identities, as compared to just 5.5% of White men (while 72% of White men believe their schools do "quite a bit" or "very much" in this arena).
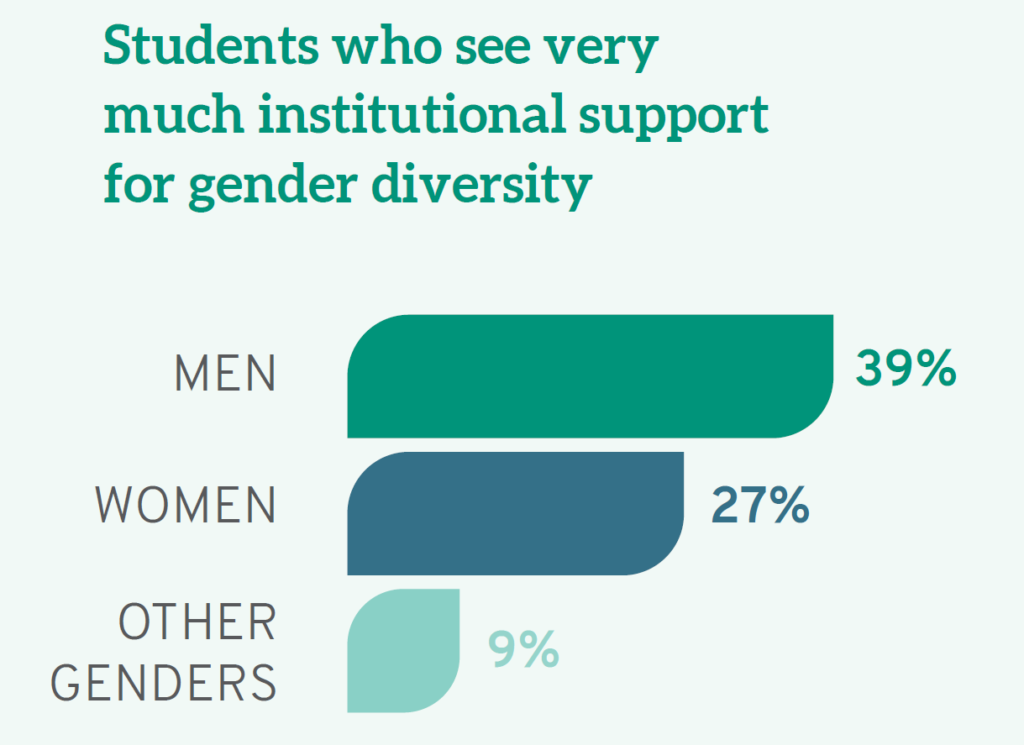
Men are also more likely to see their campus as a "supportive environment for gender diversity," with 39% believing this "very much" as opposed to 27% of women students, and only 9% of students who identify as another gender identity. Furthermore, White students as a whole (33%) see the campus as very supportive of people of different genders, compared to 21% of Native Americans and Black students. Again, the views of White male students differ significantly from most others with a full 40% seeing their campus as very supportive of gender difference. In short, women as well as others from less privileged groups do not see their schools as particularly supportive of gender inclusivity.
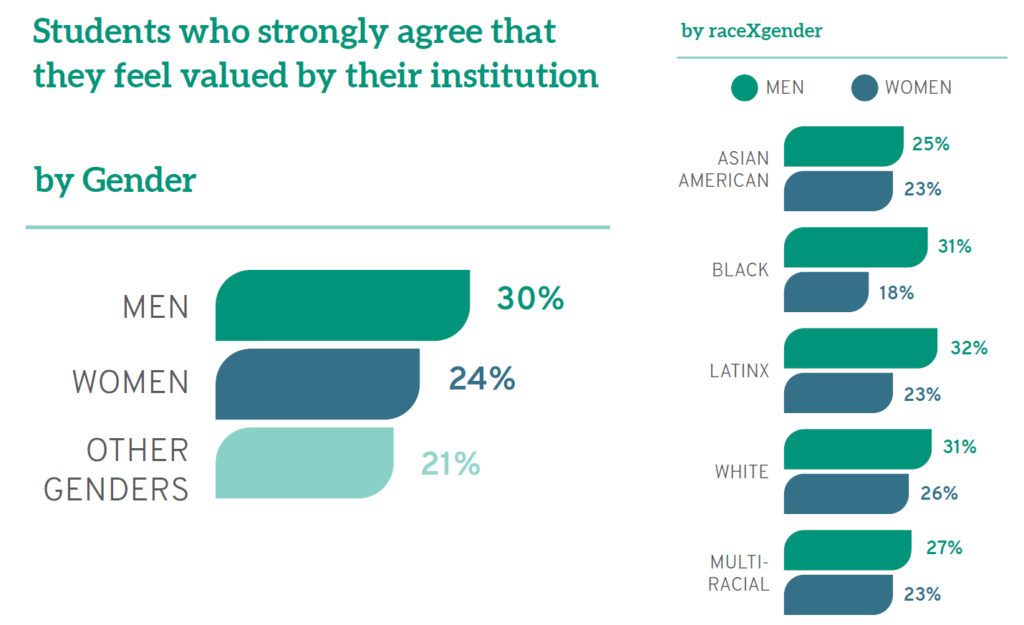
Not surprisingly, given the relative lack of support they see for racial/ethnic and gender diversity on campus, women and students of color also believe their schools are less invested in them as individuals. When asked whether they "feel valued" by their law school, a full 30% of men "strongly agree" compared to only 24% of women and 21% of those who identify as neither male or female. Similarly, the racial/ethnic group most likely to "strongly agree" is Whites (28%). In fact, while Latinos, White men, and Black men "strongly agree" that they are valued at roughly equal rates, men feeling more valued than women is consistent across every racial/ethnic group. Furthermore, students who are the first in their families to earn a college degree, often called "first-gen" students, feel less valued by their institution: a full third (33%) note they do not feel valued, compared to a quarter (25%) of others, which is also a significant proportion of law students overall.
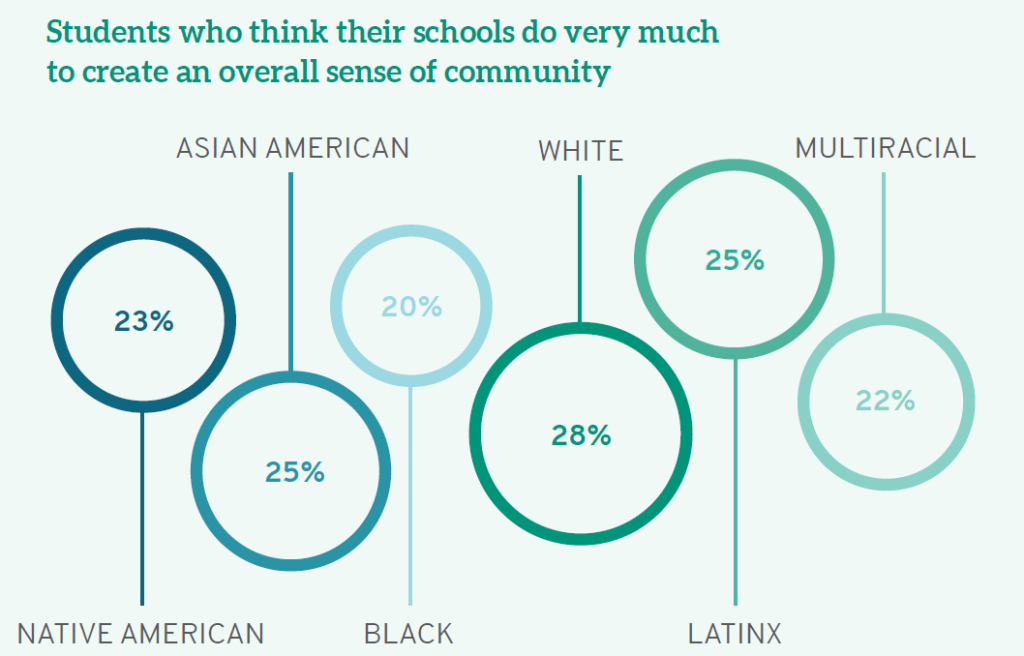
Institutions can put mechanisms in place to foster community among those on campus, regardless of their background or experiences. Finding this common ground helps all students understand that they belong and that others who may be different should be equally welcome. Again, White students are most likely to believe their institution emphasizes the importance of "creating an overall sense of community among students." While 28% of White students think their schools do this "very much," smaller percentages of students of color feel similarly. Even more disheartening, 18% of Black students and 14% of Latinx students think their schools do "very little" to foster community.
Many law schools have made concerted efforts to add student diversity to their campuses. But once students enroll, we owe it to them to provide a safe and welcoming environment, one where they feel valued, where they can be themselves, where they acquire the tools they need to succeed in the workplace, and where they can thrive. Admitting and even enrolling more students of color, first-gen students, students who identify as LGBTQ, and women is not enough unless that diversity is accompanied by inclusion. Law schools that want their students to succeed as future lawyers and leaders must commit to fostering a campus community where the most vulnerable and non-traditional are encouraged to reach their full potential, where faculty are expected to train students not only for the global marketplace but for the realities of American life, and where all students appreciate their own backgrounds, biases, and responsibilities to the profession.

Where do students get advice?
LSSSE’s optional Student Services module asks students about whether and how often they access academic and career services. Students draw from various sources to get advice about law school, legal education, and their future careers. Here, we look at the most commonly selected meaningful sources of advice for students and examine how patterns of advice-seeking change as students progress through law school.
Advice about Academic Plans
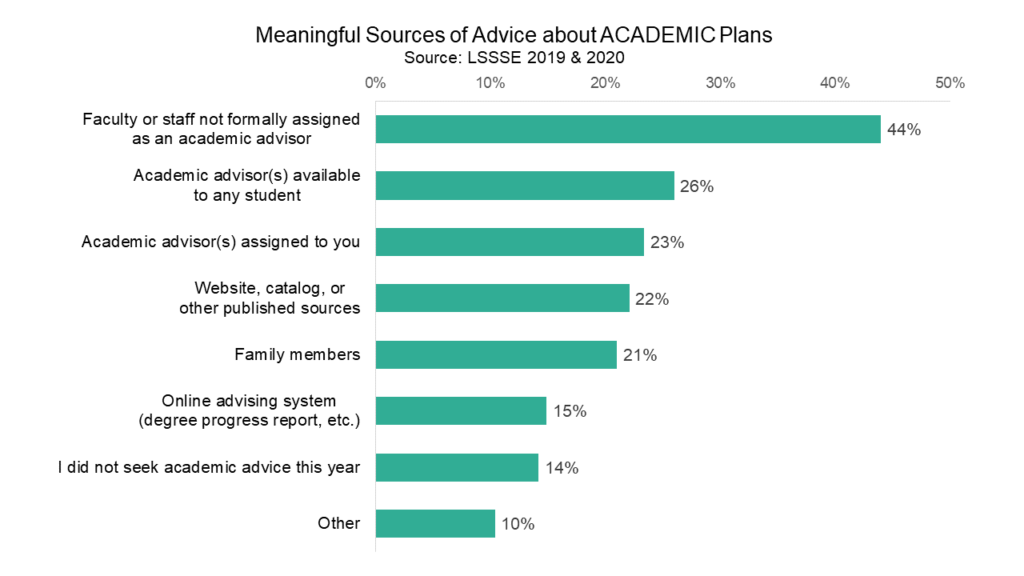
Faculty or staff not formally assigned as an academic advisor are the most common meaningful source of advice about academic planning. Over 40% of LSSSE respondents rely on these personal relationships that they develop with the law school professionals around them. Formal academic advisors –those assigned and those available to any students – are the second and third most commonly used sources of advice and were selected by 26% and 23% of students, respectively. About 22% of students consider websites, catalogs, or other published sources to be meaningful sources of advice about academic plans, and roughly one in five consulted family members. Only 14% of respondents did not seek academic advice from anyone during the current school year.
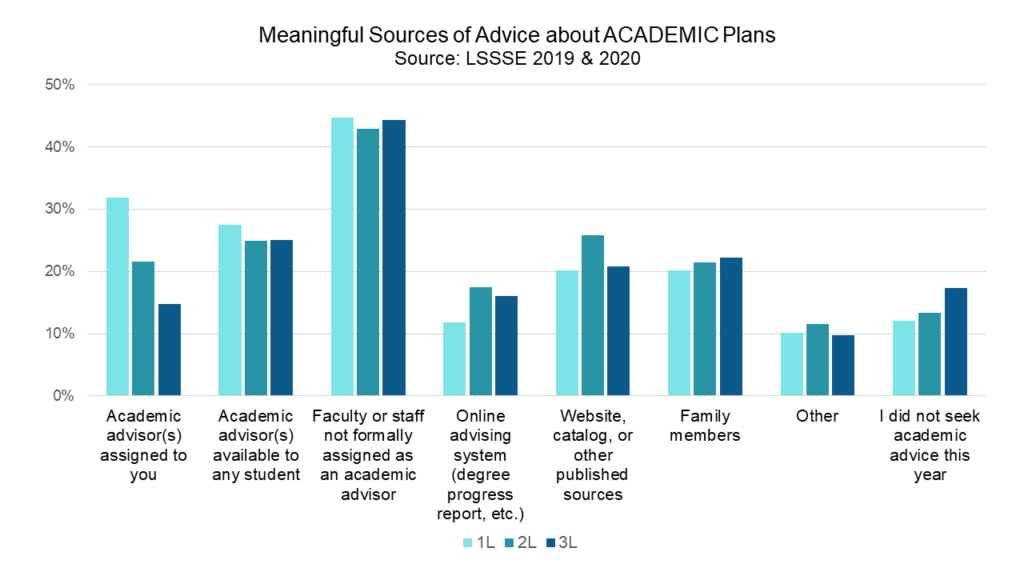
Students appear to rely less on assigned academic advisors as they progress through law school. Roughly one-third of 1L students say their assigned academic advisor was a meaningful source of advice, but only 15% of 3L students feel the same way. Perhaps unsurprisingly, 3L students were slightly less likely to seek academic advice than 1L and 2L students.
Advice about Career Plans
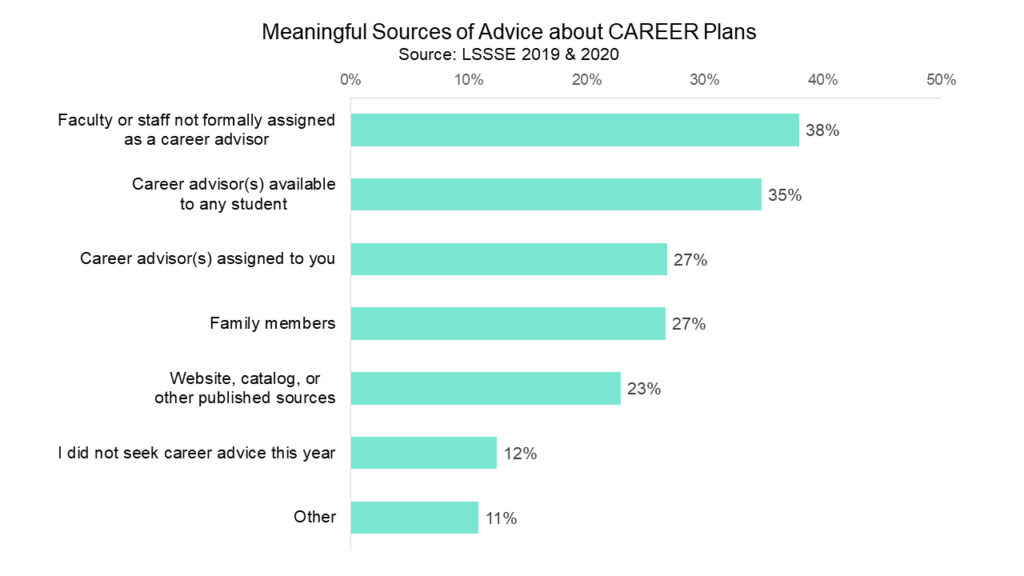
The ranking of meaningful sources of advice about career planning is remarkably similar to the ranking for advice about academic planning. Students highly value their relationships with law school faculty and staff when it comes to seeking career advice, ranking faculty or staff not formally assigned as a career advisor highest (38%), followed by career advisors available to any student (35%) and then assigned career advisors (27%). Interestingly, students were equally likely to select family members and assigned career advisors as meaningful sources of career advice. Twelve percent of respondents did not seek any career advice during the current school year.
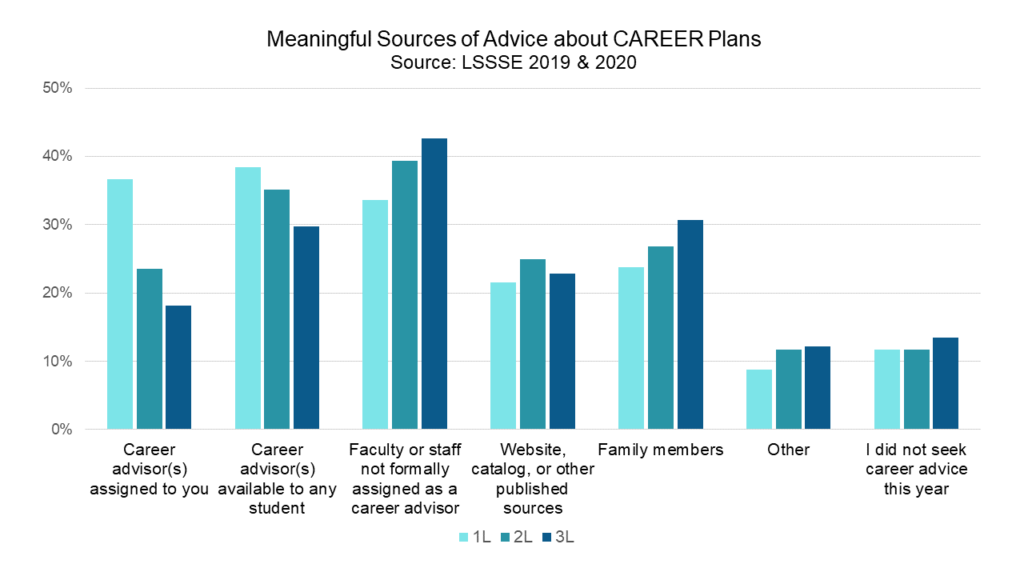
Students rely less on assigned career advisors as they progress through law school, which is similar to the pattern we saw for academic advising. However, the gradual decrease in reliance on formal career advising is somewhat mirrored by a gradual increase in reliance on advice from faculty or staff not formally assigned as career advisors. It would appear that as students refine their interests and form relationships with particular faculty or staff members, they start to rely more on personal relationships for career advising and less on relationships facilitated by the structure of law school.

Learning How to Think Like a Lawyer
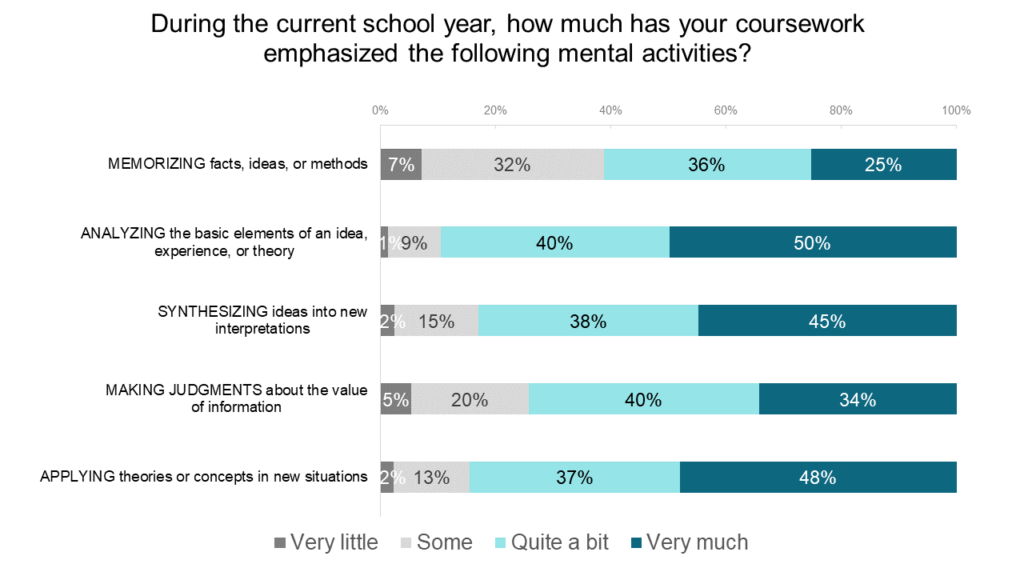
A legal education strives to teach law students how to "think like a lawyer." Although students may not articulate their reasons for attending law school in exactly this way, the rigor of the law school curriculum certainly challenges students to develop mental flexibility and analytical critical thinking skills. LSSSE asks students to comment on the degree to which their coursework emphasizes the development of several mental activities, namely memorizing, analyzing, synthesizing, making judgments, and applying ideas to new situations.
For each skill, more than half of law students indicated that their school emphasized developing that skill "quite a bit" or "very much." Analyzing the basic elements of an idea, experience, or theory was a nearly universal skill with ninety percent of 2020 LSSSE respondents reporting high emphasis in their coursework. Nearly as many (85%) said their law school placed a high emphasis on applying theories or concepts to new situations. About 83% felt that their coursework emphasized synthesizing ideas into new interpretations, and about 74% said the same for making judgments about the value of information. Memorization was the least emphasized mental activity, but still, 61% reported that their coursework places a high emphasis on memorizing facts, ideas, or methods.
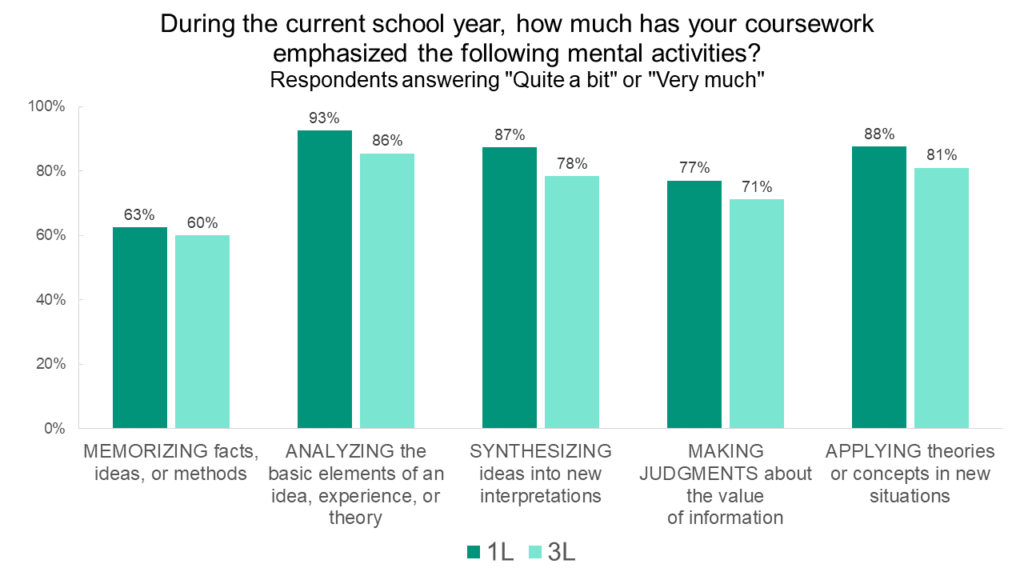
1L students were slightly more likely than 3L students to say that their coursework emphasized the development of any given mental activity. This may be because 1L students are still in the process of adjusting to the rigors of a legal education and thus are more likely to see their educational challenges as formidable. It may also reflect the slight gradual decline in satisfaction and enthusiasm that occurs as law students progress through their degree programs.
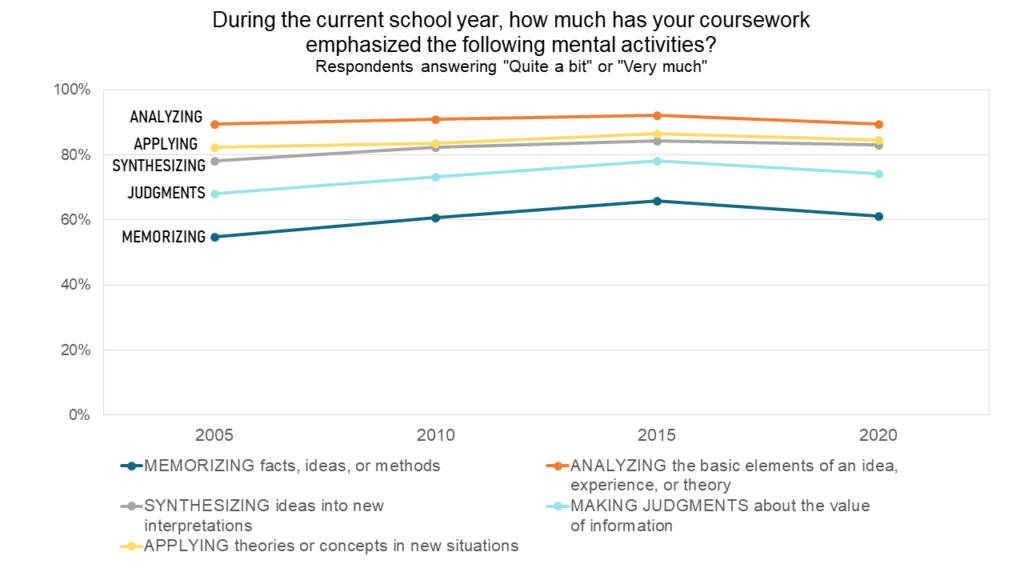
Interestingly, the ranking of the five mental activities has remained constant since at least 2005. The longitudinal LSSSE data show a slight increase in the proportion of students who report that their schools place a high emphasis on each mental activity from 2005 to 2015 and then a slight decrease or plateau for each activity from 2015 to 2020.
Clearly, law school remains a challenging endeavor in that it places a strong emphasis on developing higher order mental faculties including analyzing the basic elements of an idea, experience, or theory, applying theories or concepts to new situations, and synthesizing ideas into new interpretations. Only a tiny percentage of students report that their legal education has placed very little emphasis on any of these skills. This suggests that law school is delivering on the promise to teach students how to think like a lawyer.

The LLM Experience
For the first time this year, we invited LLM (Master of Laws) students at American law schools to participate in LSSSE alongside their JD colleagues. To our knowledge, this is the first national empirical survey of LLM students. Here we present a few initial findings about this unique group of students.
Basic Demographics
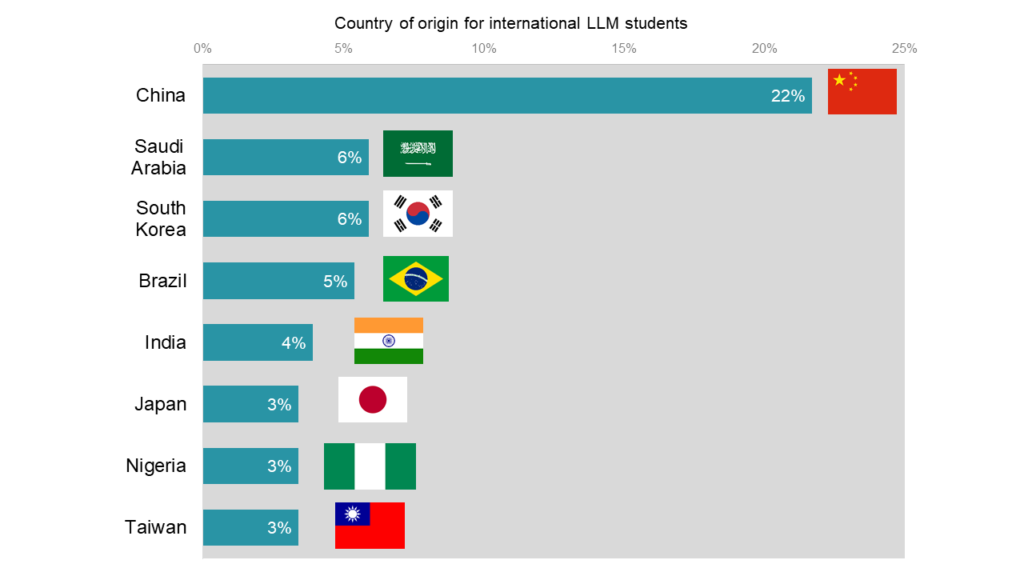
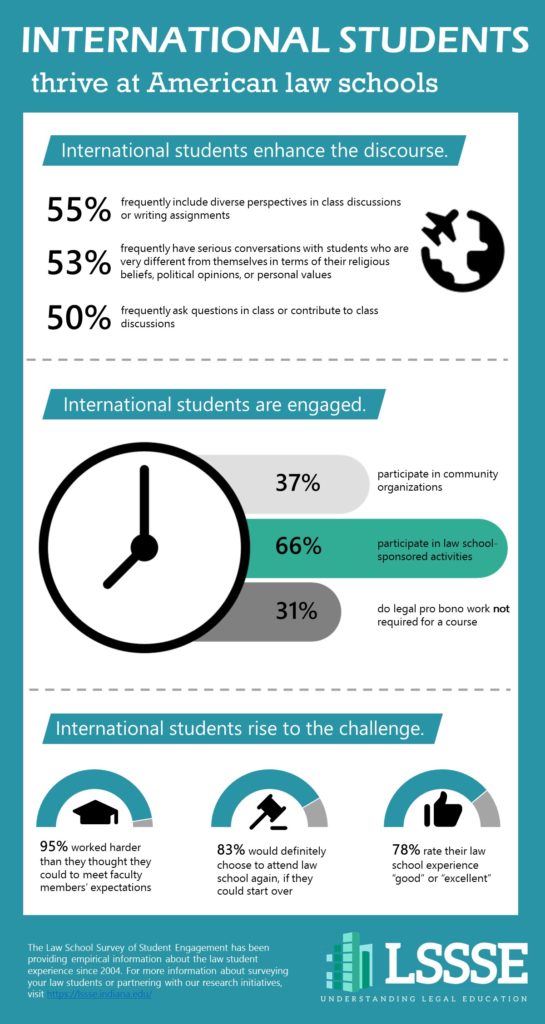
International students make up 79% of LLM students at American law schools. Among students born in other countries, the most common nation of origin is China, which is the home of 22% of international LLM students. The next three most common home countries are Saudi Arabia, South Korea, and Brazil, which each account for around six percent of the LLM international student population.
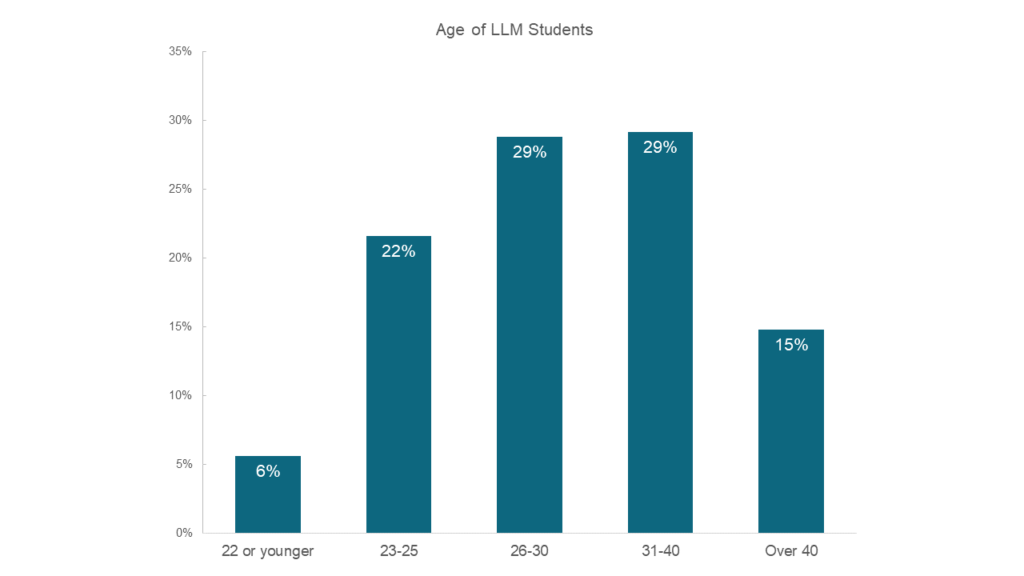
Because a JD degree or international equivalent is required for admittance to LLM programs, most LLM students are somewhat older than the typical law student. The majority (58%) of LLM students are between the ages of 26 and 40. Fifteen percent are over 40 and 28% are 25 or younger. LLM students are somewhat more likely to be women, which is in keeping with current trends toward slightly more female law students than male law students.
Satisfaction
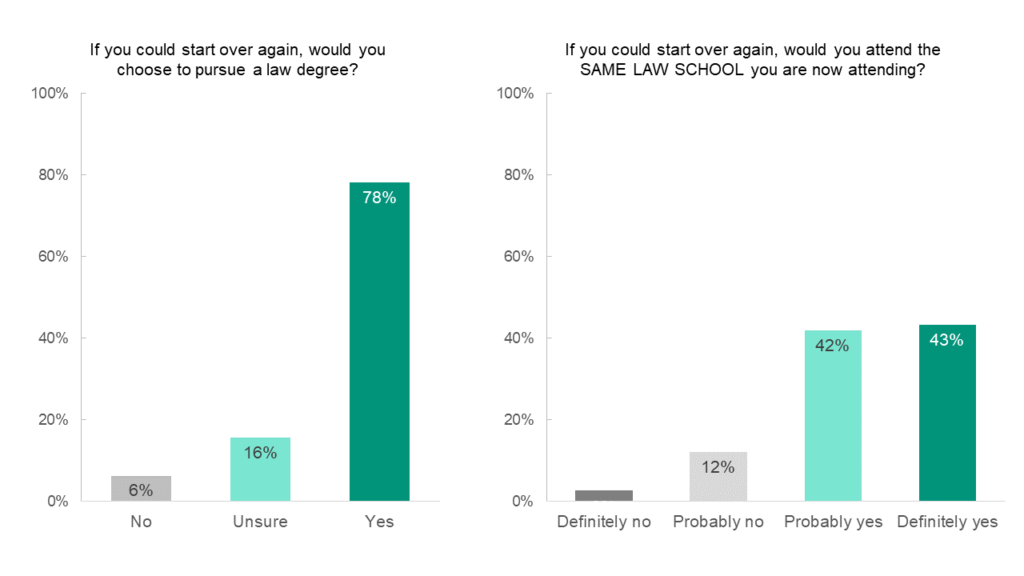
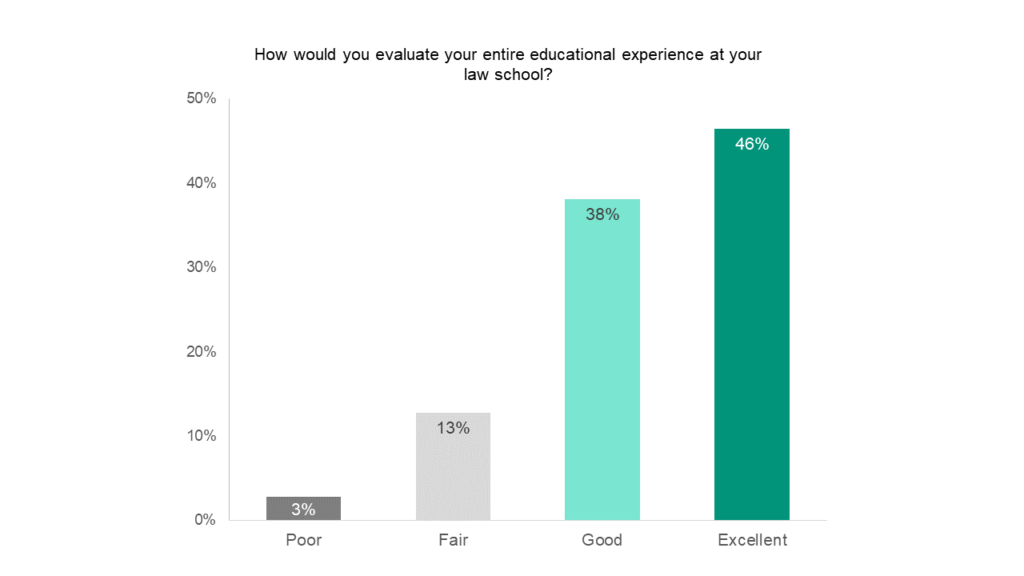
In general, LLM students are satisfied with their law school experience. If given the chance to start over, most (78%) would choose to pursue a law degree and most (85%) would probably or definitely attend the same law school they are now attending. Nearly half (46%) rate their experiences as excellent, and another 38% rate their overall experience as good. Only 3% of LLM students describe having a poor experience. These data suggest that LLM students see their current degree program as a good investment. Future LSSSE reports will delve deeper into how LLM students engage with the law school experience and how satisfied they are with specific features of their programs.

Law Library Usage and Satisfaction
Learning to find, analyze, and use high-quality legal information is a core goal of a legal education. The main LSSSE survey gathers information about student satisfaction with library services while the optional Law Library module provides a wealth of details about how students interact with library resources as they develop information literacy skills. Here we will provide a small sample of survey results focusing on which library functions students use and how satisfied they are with core library teaching functions.
Teaching Functions
The first section of the library module asks students about three key library teaching functions:
- Legal research classes/presentations/programs the Library staff has held
- Interactions with librarians where legal research skills are addressed (at the reference desk, individual meetings, and virtual reference)
- Research guides compiled by Library staff to assist students in legal research
Students are asked about their experiences with these three functions of their law libraries by selecting one of the following options:
- Very unsatisfied
- Unsatisfied
- Satisfied
- Very satisfied
- Unsure whether my law library offers this service
- Not used but aware of service
This format allows us to measure not only satisfaction with each service but also how many students use the service or are at least aware it exists.
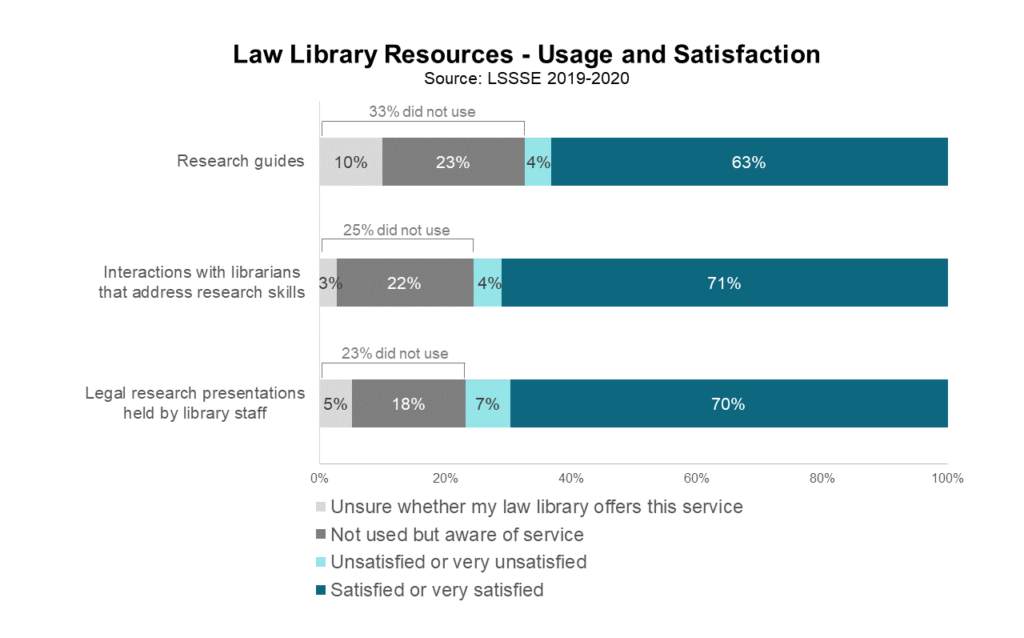
Legal research presentations held by library staff are the most used resource, with only 23% of students saying they either had not used them or were unsure whether they were offered at their library. Students are largely satisfied with these presentations, with about ten satisfied students for every dissatisfied one. Students are even more satisfied with interactions with librarians that addressed legal research skills: 75% of students had these interactions, and among those students, 94% were satisfied or very satisfied with the interaction. Of the students who had not had an interaction with a librarian that addressed research skills, most are at least aware that this service exists at their law school. Research guides were the least used library resource. A full third of students had not used research guides during the school year, with about ten percent of students unsure whether their library even offered this service. Again, however, students who had used research guides are overwhelmingly satisfied with them.
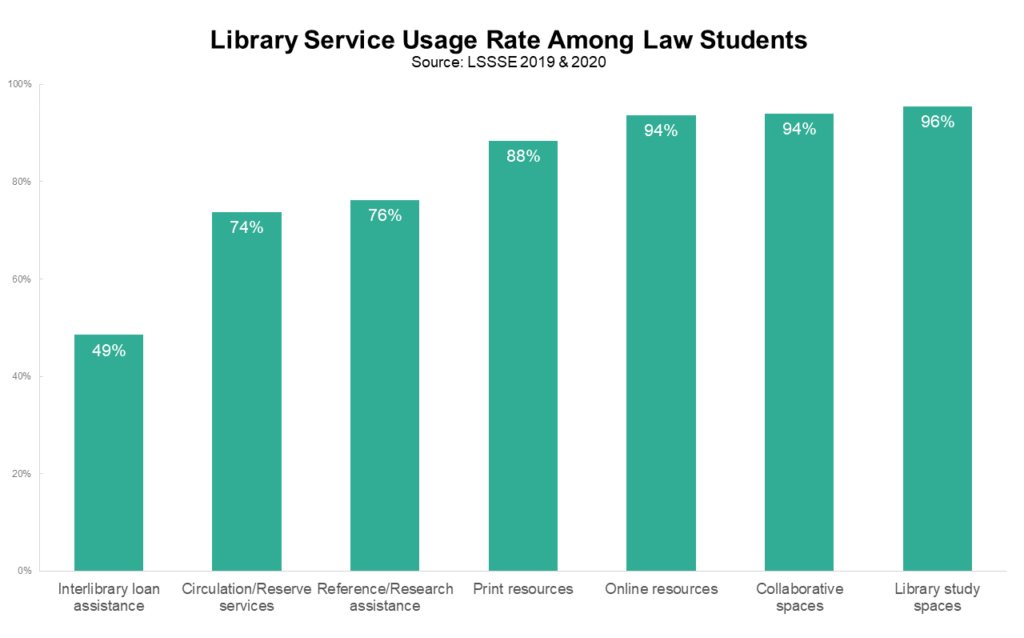
Usage Rates
Though many university libraries have reduced their physical presence in favor of more virtual offerings, law libraries remain a notable exception, likely due to the intense reading loads of their student patrons. A full 96% of LSSSE respondents have used their law library as a study space in the past year, and 94% have used their law library’s collaborative spaces. Nearly all law students (94%) used online resources, and another 88% used print resources. About three-quarters of students received reference assistance and used circulation services, and about half asked for interlibrary loan assistance. Thus, overall usage rates of law library resources are quite high.
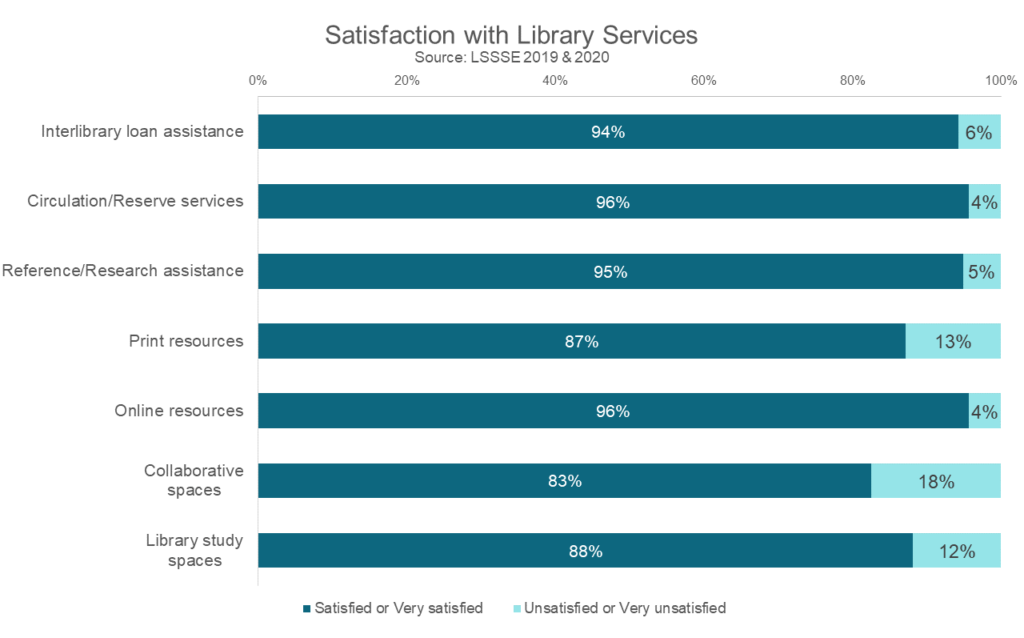
Satisfaction
Among students who used each service, satisfaction is generally high. The services that involve personal interactions are most highly rated; around 95% of respondents who used interlibrary loan, circulation/reserve, and reference assistance were satisfied or very satisfied. Students were somewhat less satisfied with their law library’s physical spaces, with around 18% of students expressing dissatisfaction with the library’s collaborative spaces and around 12% of students expressing similar negative opinions about their library’s study spaces. Students are more likely to be satisfied with online resources (96%) than with print resources (87%).
LSSSE results strongly suggest that law libraries are crucial to the law school experience. Nearly all students had used their law library in the previous year, and law students were generally quite satisfied with the core services they found there. Most students were pleased by their interactions with library staff and resources, although some students desired changes to their library’s collaborative spaces and study spaces. This suggests that law schools could invest somewhat more in physical aspects of the law library, rather than online ones, to increase student satisfaction. It will be interesting to see whether students interact with their physical and virtual law libraries in different ways during this odd year of social distancing and remote learning. Stay tuned for LSSSE 2021 results.

Time Spent Caring for Others, Part 2
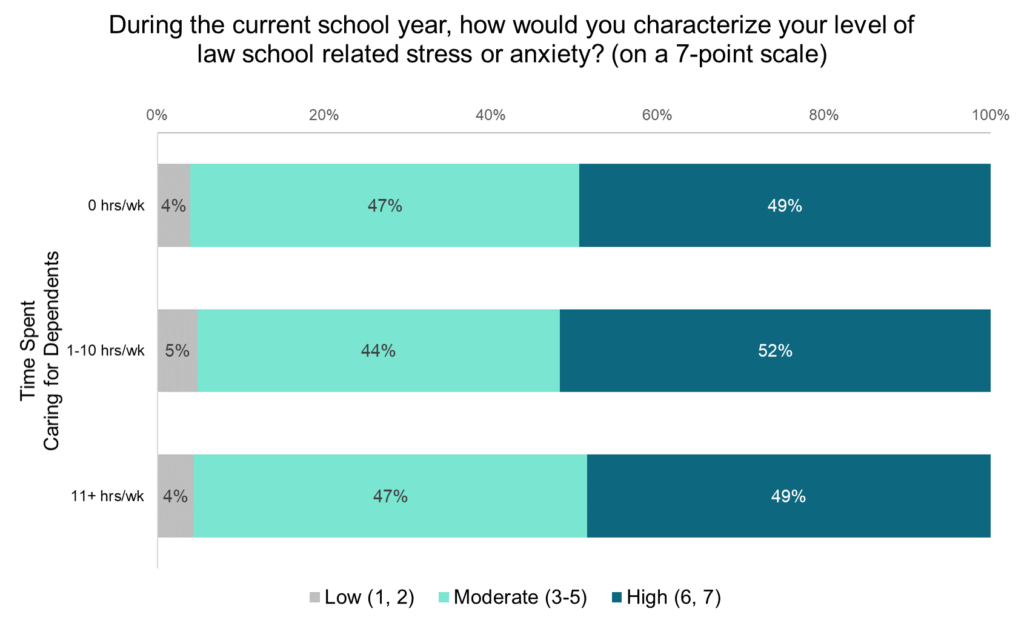
In our last post, we examined the differences in time spent caring for dependents among law students by age, gender, and enrollment status (part-time or full-time). In this post, we look at the stress and satisfaction levels of students with different levels of caretaking duties. Most law students report moderate to high levels of law school related stress and anxiety (3 or higher on a 7-point scale). Interestingly, there are virtually no differences in law school related stress levels among students based on the amount of time they spend caring for dependents. Students at all levels of caretaking responsibility are all equally stressed during law school, with around 50% having high levels and around 45% having moderate levels.
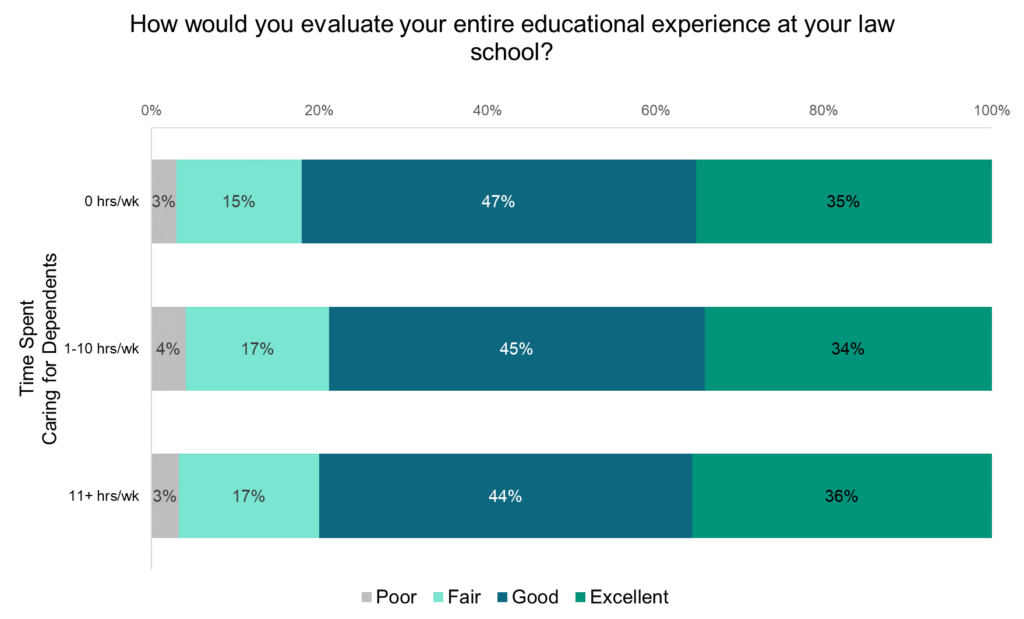
Law students with no, low, or high levels of time spent caring for dependents also report similar levels of satisfaction with the law school experience, with slightly more than a third saying their experience has been “excellent” and slightly less than half rating their experience as “good.”
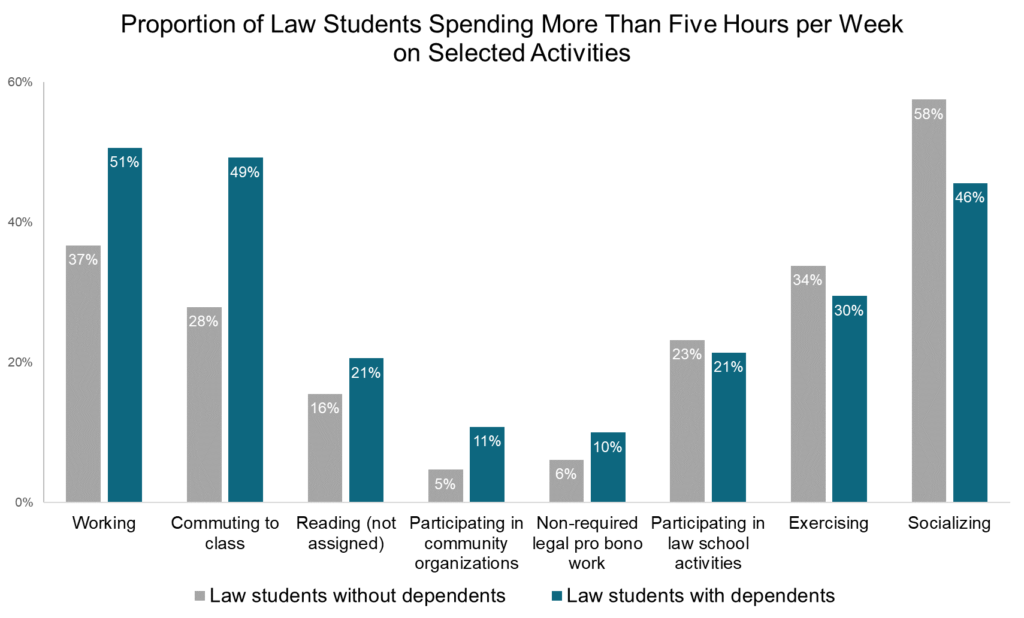
However, students with varying levels of caretaking responsibilities do diverge in how they allocate their time among law school activities, work, and leisure. Nearly half (49%) of students with caretaking duties spend more than five hours per week commuting to class while only 37% of students without caretaking duties report the same. Students without dependents tend to spend more time on leisure activities such as socializing and exercising whereas students with dependents are more likely to work for pay and have longer commutes to class. This suggests that caretaking students meet the needs of their dependents at the expense of time that might otherwise be spent on self-care activities. This trade-off is similar to the findings of the LSSSE 2019 Annual Results, which show that women are performing well in law school but with higher costs to their physical and mental health relative to their male classmates. Non-caretakers are slightly more likely to spend at least five hours per week participating in law school activities while caretakers are somewhat more likely to engage in legal pro bono work not required for class and to participate in community activities. So when caretaking students have the ability to engage in extracurricular activities, they are likely to choose different activities than their non-caretaking classmates.
Clearly, the way students spend their time varies depending on whether they spend time caring for others during the week, even though both groups are remarkably similar in stress levels and overall satisfaction. This implies that students who differ in caretaking duties may adapt by taking advantage of different resources and strategies in order to make the most of their law school experience. Students who have greater caretaking duties are also more invested in other non-campus-related activities—including work, community organizations, and pro bono services. Though they spend less time socializing, they remain almost equally invested in participating in law school activities overall.

Time Spent Caring for Others, Part 1
Law students with support networks are more likely to be successful in their studies, but students who are interdependent with others may also bear substantial caretaking duties. In the analysis of how students use their time, LSSSE asks about how many hours per week respondents provide care for dependents living in their household (parents, children, spouse, etc.). We decided to dig into the data to see which students are most likely to spend time caring for others and how caretaking duties interact with measures of student stress and satisfaction.
Demographics of Caretaking
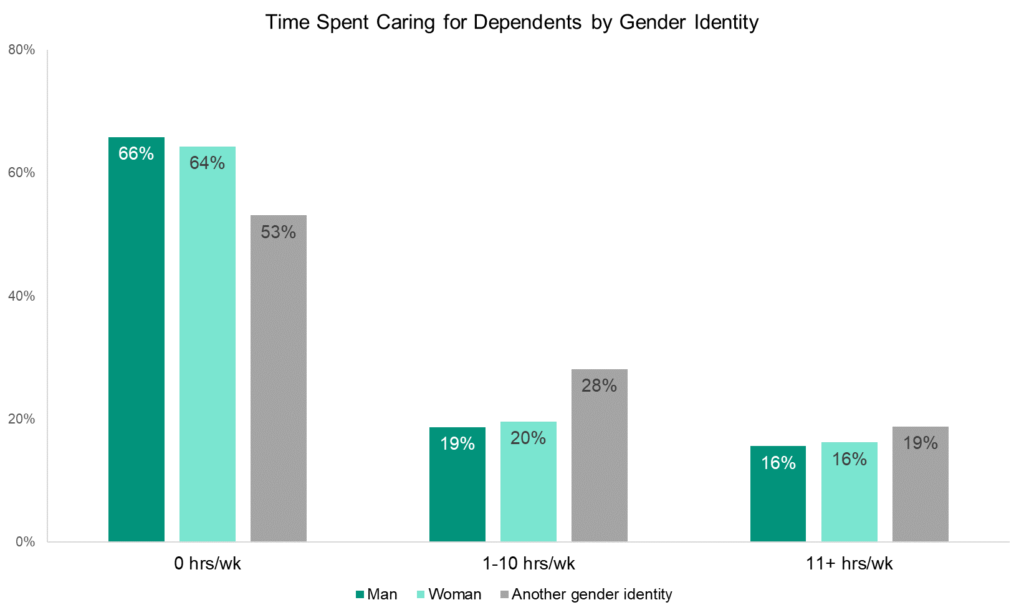
Among law students, men and women are equally likely to report spending some amount of time each week caring for dependents who live with them. Thirty-five percent of men and 36% of women spend at least one hour per week taking care of dependents. Students of other gender identities spend somewhat more time on caretaking duties, with almost half (47%) spending at least an hour per week.
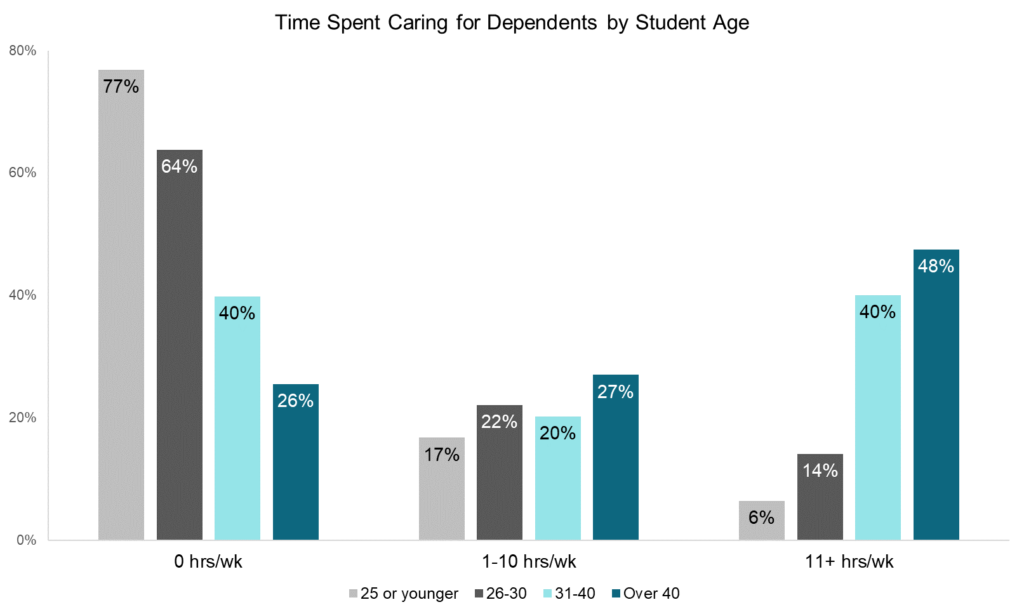
As law students get older, they tend to spend more time on caretaking tasks. About 77% of students 25 or younger spend no time at all caring for dependents during the week, but only 26% of students over 40 can report the same. In fact, about half of students over 40 spend eleven or more hours per week taking care of dependents. About 40% of students in their thirties have similarly intense caretaking roles, but that figure drops dramatically for students under 30.
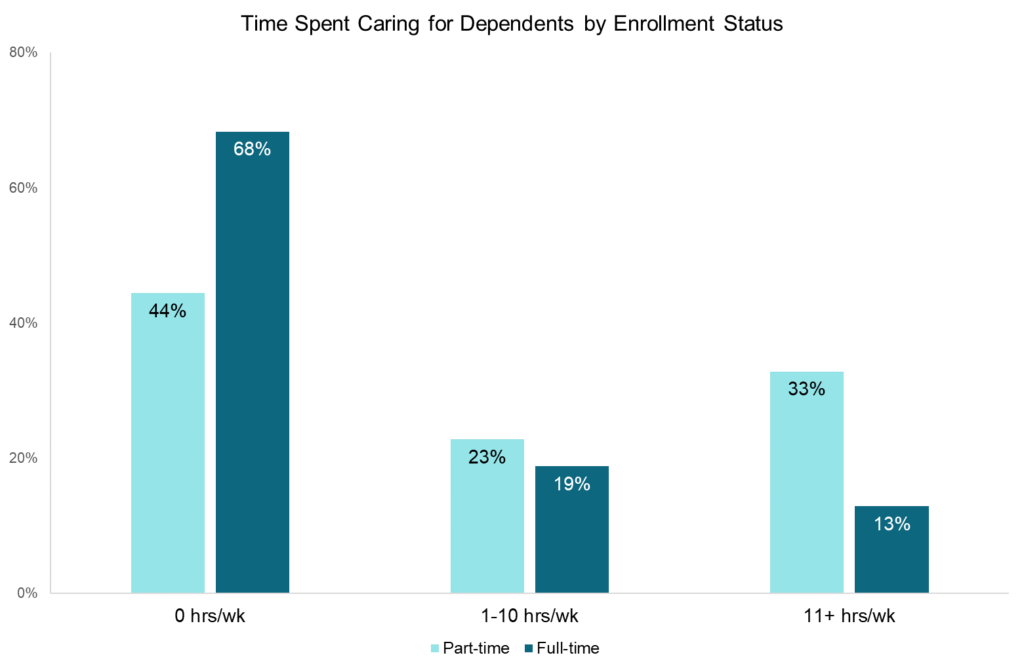
Part-time students are more likely than full-time students to spend some time each week caring for dependents. Fifty-six percent of part-time students report caring for dependents compared to 32% of full-time students. One-third of part-timers spend eleven or more hours per week caring for dependents while just 13% of full-timers report the same.
Overall, the LSSSE data show that there are variations in the time students spend caring for children, parents, and others. Older students and part-time students are more likely to spend time caring for dependents, relative to their younger and full-time counterparts. Interestingly, men and women are about equally likely to engage in caretaking duties. Next week, we will explore how caretaking responsibilities interact with law students’ stress levels and their overall satisfaction with the law school experience.


LSSSE Annual Results 2019: The Cost of Women’s Success (Part 4)
The Troubling Secret to Success
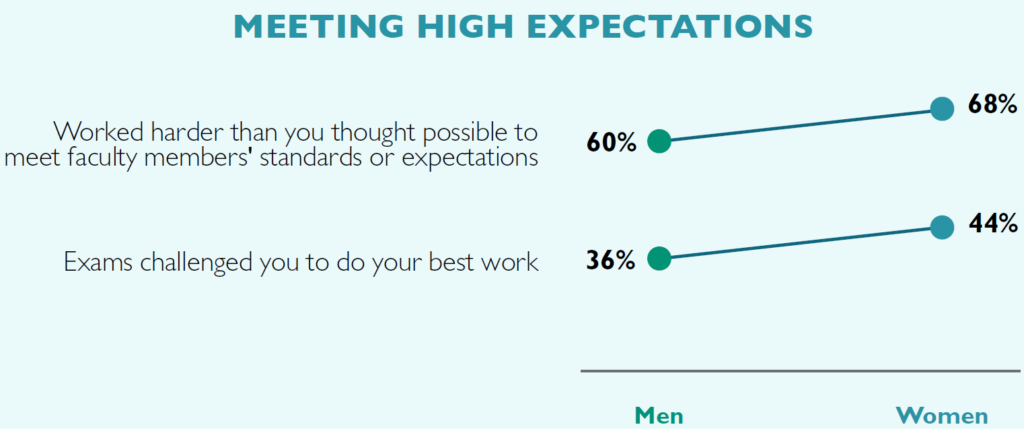
What is the secret to the success of female law students? They enter law school with fewer resources and amass significant burdens once enrolled, but perform at equal or higher levels than their male peers along many metrics. The data suggest one clear answer: women law students work extraordinarily hard, juggling their various personal and academic responsibilities at the expense of self-care. While most students work hard to meet the high expectations of their professors, women students report sustained effort at higher levels than their male peers. A full 68% of women note that they “Often” or “Very Often” worked harder than they thought they could to meet faculty members’ standards or expectations, compared to 60% of men. Similarly, higher percentages of female students than male rise to the challenge of submitting their best work on exams. LSSSE respondents were asked to report “the extent to which your examinations during the current school year have challenged you to do your best work” on a 7-point scale. Remarkably, 44% of women report the highest level of engagement (a 7 out of 7) as compared to 36% of men. Again, these findings of hardworking women are consistent across race/ethnicity.
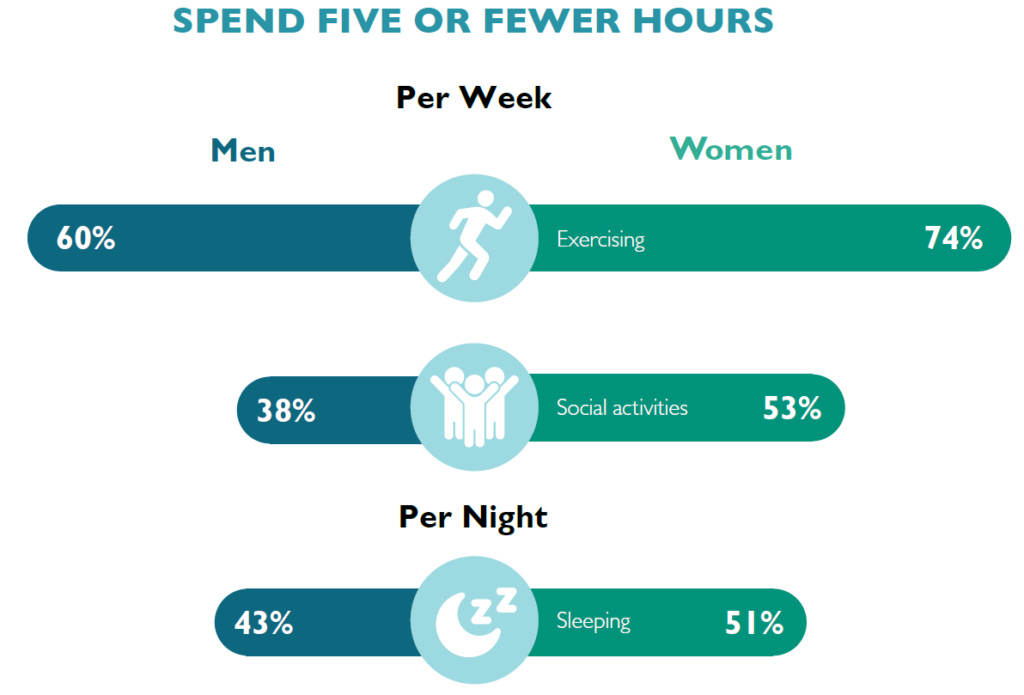
Tragically, the hard work that women dedicate to enabling their success comes at a significant cost. The tradeoff is that women are much less likely than men to engage in important social, leisure, and self-care activities. Each of these findings is consistent across racial/ethnic groups when comparing women with men. For instance, 41% of women spend zero hours per week reading for pleasure, compared to 25% of men. Similarly, the overwhelming majority of women law students find little time for physical fitness, with 74% reporting that they exercise no more than 5 hours a week (along with 60% of men). Expanding this concept to other leisure activities—including watching TV, relaxing, or even partying—does not improve this gender disparity. More than half (53%) of women law students spend five or fewer hours per week engaged in any of these social activities, compared to just over a third (38%) of men. Furthermore, half (51%) of women report sleeping five or fewer hours per night in an average week, along with 43% of men. In the scramble to get ahead academically, women are overlooking downtime; they are prioritizing their academic success at the expense of their own wellbeing. Such limited opportunities to disconnect from schoolwork, engage in physical fitness, rest, relax, and socialize with others can have serious implications for the long-term physical and mental health of women law students.
For more in-depth analysis about gender disparities in legal education, you can read the entire LSSSE 2019 Annual Results The Cost of Women’s Success (pdf) on our website or contact us.

LSSSE Annual Results 2019: The Cost of Women’s Success (Part 3)
Opportunities for Improvement
Given the many challenges facing women upon entry to law school, it is no surprise that there are also opportunities to improve the experience for women students in legal education. LSSSE data on concepts as varied as classroom participation, caretaking, and debt make clear that women need greater support.
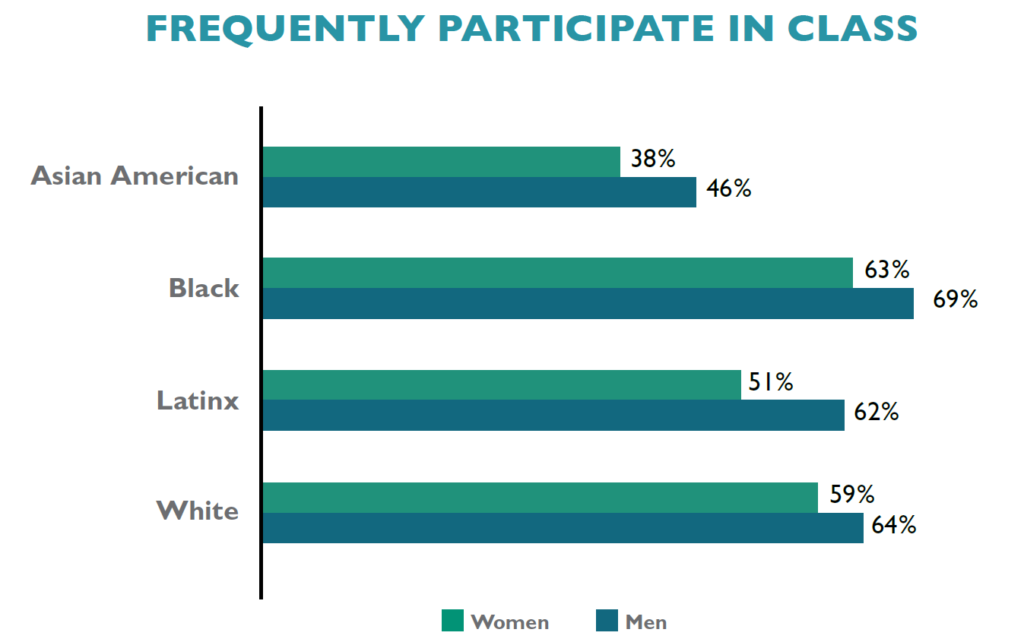
Engagement in campus life is an especially significant indicator of success. Law students who are deeply invested in both classroom and extracurricular activities tend to maximize opportunities for success overall. As stated in a previous post, women are just as likely as men to be involved in various co-curricular endeavors. Yet, smaller percentages of women than men are deeply engaged in the classroom. While 64% of men report that they “Often” or “Very Often” ask questions in class or contribute to class discussions, only 58% of women do. This gender disparity remains pronounced within every racial/ethnic group, as men participate in class at higher rates than women from their same background. There are also interesting variations by raceXgender, with Black men frequently participating at higher rates than any other group (69%), and at almost twice the rate of Asian American women (38%).
Many women students also spend numerous hours during their law school careers providing care to household members. For instance, 11% of women report that they spend more than 20 hours per week providing care for dependents living with them, as do 8.6% of men. These competing responsibilities require a significant investment of time, which could otherwise be spent on studying for class, working with faculty on a project outside of class, or even engaging in leisure activities. Instead, these students are taking care of their families.
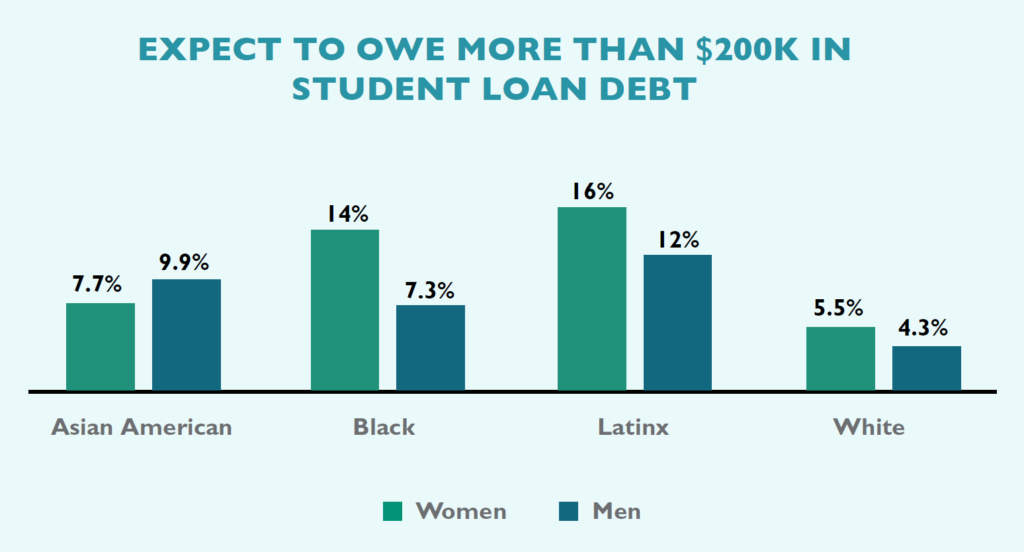
An especially troubling discovery is that high percentages of women than men incur significant levels of debt in law school. Among those who expect to graduate from law school with over $160,000 in debt are 19% of women and 14% of men. This gender difference remains constant within every racial/ethnic group. Even more alarming is the disparity among those carrying the highest debt loads: 7.9% of women will graduate from law school owing over $200,000 as compared to 5.5% of men. LSSSE data not only confirm existing research on racial disparities in educational debt, with people of color and especially Black and Latinx students borrowing more than their peers to pay for law school, but also reveal that women carry a disproportionate share of the debt load as compared to men. Furthermore, when considering the intersection of race/ethnicity and gender, we see that women of color specifically are graduating with extreme debt burdens.
Next week, we will conclude this series with some troubling trade-offs that women make to overcome the disadvantaged position in which they often find themselves relative to their male counterparts. You can read the entire LSSSE 2019 Annual Results The Cost of Women’s Success (pdf) on our website.